TP9 | Planetary volcanism, tectonics, and seismicity

TP9

Planetary volcanism, tectonics, and seismicity
Conveners: Petr Broz, Anna Horleston | Co-conveners: Sam Poppe, Maxence Lefevre, Oguzcan Karagoz, Ernst Hauber
Orals FRI2
| Fri, 11 Sep, 11:00–12:30 (CEST)|Room Saturn (Jazz 3)
Orals FRI3
| Fri, 11 Sep, 14:00–15:30 (CEST)|Room Saturn (Jazz 3)
Posters THU-POS
| Attendance Thu, 10 Sep, 18:00–19:30 (CEST) | Display Thu, 10 Sep, 08:30–19:30|Foyer 2, F2.36–41
Fri, 11:00
Fri, 14:00
Thu, 18:00
Volcanism, tectonics, and seismicity represent key expressions of internal activity across the Solar System, fundamentally shaping the surfaces and interiors of terrestrial planets, moons, and icy satellites. Recent advances — including high-resolution orbital datasets, returned lunar samples, and seismic measurements from the Moon and Mars — have provided major insights into planetary interior structure, lithospheric processes, and the links between magmatism, tectonics, and seismic behavior. Together, these observations are transforming our understanding of how planetary bodies evolve and how endogenic processes manifest under different physical and environmental conditions.

Following the success of missions such as InSight, upcoming and recent missions — including Dragonfly, VERITAS, EnVision, Chang’e 6, and the Farside Seismic Suite — promise substantial progress in characterizing volcanic, tectonic, and seismic processes on Titan, Venus, and the Moon. These missions will refine constraints on planetary interiors, crustal structure, and the mechanisms driving seismicity. In parallel, small-body seismology is rapidly emerging as a new frontier, with future exploration concepts increasingly incorporating seismic investigations of asteroids and comets.

This session invites contributions addressing planetary volcanism, tectonics, and seismicity through observational, analytical, experimental, and theoretical approaches. We welcome studies of volcanic and tectonic landforms, magma–tectonic interactions, faulting and lithospheric deformation, seismicity and interior structure, as well as numerical and laboratory modeling. Submissions on geochemical and geophysical constraints, comparative planetology, mission concepts, instrumentation, and data analysis related to planetary interiors and seismic processes on planets and small bodies are particularly encouraged.

Orals FRI2: Fri, 11 Sep, 11:00–12:30 | Room Saturn (Jazz 3)

Chairpersons: Anna Horleston, Maxence Lefevre, Oguzcan Karagoz
11:00–11:12
|
EPSC2026-611
|
ECP
|
On-site presentation
Agnes Hendrickx, Carl Martin, and Arwen Deuss

The deep internal structure of the moon is vital to constrain its thermochemical evolution and the evolution of the Earth-Moon system. Despite decades of study, lunar core size estimates vary widely (200-400 km) and even seismological studies of the same core-reflected phases have produced estimates that differ greatly. In preparation for a new era of lunar missions and seismological network, it is important to maximize the information extracted from the Apollo seismic archive to streamline the integration of future data.

Core-reflected phases have previously been detected using stacks of deep moonquake (DMQ) clusters, i.e. regions of repeated seismicity deep (>800 km) within the moon. Through adaptive stacking and advanced multi-component, multi-station alignment, we improve the signal-to-noise ratio of these stacks. This allows S-arrivals to be detected in additional clusters, increasing the amount of data available to constrain core reflections. Furthermore, by permitting minor variations in predicted arrival times to account for uncertainties in DMQ locations and velocity models, we improve the coherence of stacked core phases.

The resulting stacks predominantly reveal coherent energy corresponding to an interface near 380-400 km radius, but an additional discontinuity around 300 km is also frequently detected. These radii are similar to previous seismological estimates of lunar core size, explaining why earlier analyses selected either one as the core boundary. We will interpret these in terms of discontinuities such as the Core Mantle Boundary and potential further smaller discontinuities. These findings may reconcile earlier interpretations and offer new constraints on the layering of the Moon's deep interior.

How to cite: Hendrickx, A., Martin, C., and Deuss, A.: Constraining the Moon's deep interior layering with Apollo seismic data, Europlanet Science Congress 2026, The Hague, The Netherlands, 7–11 Sep 2026, EPSC2026-611, https://doi.org/10.5194/epsc2026-611, 2026.

11:12–11:24
|
EPSC2026-592
|
ECP
|
On-site presentation
Alexander Stott, Ludovic Margerin, Marie Calvet, Raphael Garcia, Melanie Drilleau, Nobuaki Fuji, Anna Horleston, and Doyeon Kim

Over the 1440-sol mission of the NASA InSight lander, more than 1900 seismic events (marsquakes) were recorded and catalogued by the Marsquake service [1]. These events have enabled the determination of both the bulk interior structure [e.g. 2,3,4] and hinted at more curious aspects, for example, a basal mantle layer [5,6], mantle plumes/dynamics [e.g. 7] and crustal heterogeneities [e.g. 8]. Much evidence for such features has come from a small select group of events, owing to their superior signal quality or magnitude. On top of this, only a handful of events have generated deep mantle phases [9].

Given that InSight is only a single station, it is necessary to develop methods that extract information from a broader range of marsquakes to further develop our understanding of event origins and interior structure. To this end, we propose a clustering approach for the P-wave coda of events. This method targets the relatively underused high frequency energy of events, typically dominated by scattering [8] and more affected by environmental noise [10]. The clustering approach effectively acts as a selective event stacking to improve signal to noise ratios, identifying only the most similar events to create the stack. Using this method, we identify a set of P-wave coda features and track their evolution over distances. 

We will explore the obtained families of P-waves morphology to infer the potential range of event sources and help improve marsquake classifications [1]. This is of interest to probe questions on whether they are generated from tectonic or impact sources [1], with recent research proposing the possibility of a swarm source for certain events [11]. This interpretation, in turn, has implications for the variability of Mars’s crustal structure. Furthermore, the signal to noise ratio improvement highlights delayed energy arrivals, providing new characteristics to infer structural complexities from scattering behaviour [8]. 


References

[1] Ceylan, Savas, et al. "The marsquake catalogue from InSight, sols 0–1011." Physics of the Earth and Planetary Interiors 333 (2022): 106943.
[2] Knapmeyer-Endrun, Brigitte, et al. "Thickness and structure of the Martian crust from InSight seismic data." Science 373.6553 (2021): 438-443.
[3] Khan, Amir, et al. "Upper mantle structure of Mars from InSight seismic data." Science 373.6553 (2021): 434-438.
[4] Stähler, Simon C., et al. "Seismic detection of the martian core." Science 373.6553 (2021): 443-448.
[5] Samuel, Henri, et al. "Geophysical evidence for an enriched molten silicate layer above Mars’s core." Nature 622.7984 (2023): 712-717.
[6] Khan, Amir, et al. "Evidence for a liquid silicate layer atop the Martian core." Nature 622.7984 (2023): 718-723. 
[7] Broquet, Adrien, and Jeffrey C. Andrews-Hanna. "Geophysical evidence for an active mantle plume underneath Elysium Planitia on Mars." Nature Astronomy 7.2 (2023): 160-169.
[8] Menina, S., et al. "Stratification of heterogeneity in the lithosphere of Mars from envelope modeling of event S1222a and near impacts: Interpretation and implications for very‐high‐frequency events." Geophysical Research Letters 50.7 (2023): e2023GL103202. 
[9] Horleston, Anna C., et al. "The far side of Mars: Two distant marsquakes detected by InSight." The seismic record 2.2 (2022): 88-99.
[10] Stott, Alexander E., et al. "Machine learning and marsquakes: a tool to predict atmospheric-seismic noise for the NASA InSight mission." Geophysical Journal International 233.2 (2023): 978-998.
[11] Dahmen, Nikolaj L., et al. "Analysis of high frequency Marsquake swarms informed by deep learning." Journal of Geophysical Research: Planets 131.1 (2026): e2025JE009229.


How to cite: Stott, A., Margerin, L., Calvet, M., Garcia, R., Drilleau, M., Fuji, N., Horleston, A., and Kim, D.: Identification of new Marsquake clusters from P-wave coda analysis and implications for crustal structure and seismicity, Europlanet Science Congress 2026, The Hague, The Netherlands, 7–11 Sep 2026, EPSC2026-592, https://doi.org/10.5194/epsc2026-592, 2026.

11:24–11:36
|
EPSC2026-1249
|
On-site presentation
Mei Li, Tianyu Liu, and Ziyu Jiang

Introduction

Short-term earthquake (EQ) prediction is still one of the most challenging targets in Earth science today. The lithosphere–atmosphere–ionosphere coupling mechanism is still unclear. In this paper, the Swarm-B and the CSES satellites, as well as global strong EQs, are employed to investigate the spatio-temporal characters of the seismo-ionospheric influence.

Data and data processing method

Firstly, the electron density data measured by CSES and Swarm-B satellites from August 2018 to December 2021 are collected and 4,846 global strong EQs with MS ≥ 5.0 are also derived from the GMT catalog (https://www.globalcmt.org/) in this period. These collected earthquakes are de-clustered to 3,577 ones. These events basically form the main seismic belts worldwide (Figure 1), where mid-low latitude (Lat. ≤ 60°) EQs stand for 97.5%.

Figure 1. Spatial distribution of the declustered 3,577 EQs with MS ≥ 5.0.

Then, ionospheric perturbations (PERs) have been searched within ±65º via software developed by Li and Parrot (2012, 2013) and 39,802 nighttime CSES and 61,556 Swam-B PERs with space size t = 20–120 s and absolute amplitude A less than 100% have been obtained totally. The information for each perturbation includes time, orbit, location (longitude and latitude), space size, amplitude, etc.

Spatio-temporal features of seismo-ionospheric response

Figure 2. Ionospheric PER density as a function of the distance D from epicenter and the time delay from occurrence time of global 3,577 (a) CSES real EQs, (b) Swarm-B real EQs, and (c) randomly generated ones.

The above obtained CSES and Swam-B electron PERs are correlated to 3,577 EQs under conditions of D = 1500 km, T = 15 days and Kp < 3 to avoid the effect from solar activities, respectively. The detected PER densities by subtracting background values of as a function of distance D and delay time T before an earthquake have been demonstrated in Figure 2a and Figure 2b for CSES and Swarm-B, respectively. 

To validate these results, 3,577 points are evenly generated within the latitudes ±65° to replace the locations of the ‘real’ considered events, and the occurrence times are that of ‘real’ ones subtracting one month but without a modification on ‘real’ event magnitudes. Then, this newly generated EQ list is conducted the same statistical process as the ‘real’ ones and the corresponding result is displayed in Figure 2c.

As shown in Figure 2a and Figure 2b, the seismo-ionospheric influence determined by the strong EQs is typically featured by occurring within 5 days before in time and shifts 500–700 km for the first peak from epicenter instead of right above it in space. Then, there are two other plasma density peaks at about 1000 km and 1400 km in Figure 2a and Figure 2b. They are weaker in CSES panel than in Swam-B one as only nighttime CSES PERs have been utilized. These results are validated by random generated EQs as shown in Figure 2c presenting different scene. The seismo-ionospheric influence for mid-low latitude EQs shifts from the epicenter rather than right above it and this conclusion seems to indicate a potential LAI coupling mechanism that seismogenic current propagates along magnetic lines.

To confirm this point, we examine two separated groups of EQs: 742 EQs out of ±40° latitudes and 2307 ones within ±30° latitudes from global 3,577 ones. These two groups of events are under statistical work with the same conditions. The corresponding results are displayed in Figure 3. 

Figure 3. Ionospheric PER density as a function of the distance D from epicenter and the time delay from occurrence time of (a) 742 EQs out of ±40° latitudes and (b) 2,307 EQs within ±30° latitudes.

From Figure 7a, it is obvious that the seismo-ionospheric influence induced by mid-low latitude seismic activities has a significant offset of 900 km and is collectively centering their epicenters within 600 km for mid-high latitude ones. Therefore, the conclusion almost reaches that the location of seismo-ionospheric influence is basically depends on latitude where an EQ occurs.      

Conclusions

In this paper, the electron PERs recorded by the CSES satellite and Swarm-B satellite have been correlated to strong EQs and the statistical results have shown that the seismo-ionospheric influence significantly5 days before in time, and in space shifts 500–700 km for mid-low latitude EQs and at least 900 km for ‘high’ latitude ones from the epicenters instead right above them, and locates within 600 km for ‘low’ ones. These results support the LAI coupling mechanism of seimogenic current propagating along the magnetic lines and will improve our earthquake prediction practice. 

Acknowledgments

This work was supported by the Special Expenses for Basic Scientific Research under grant no. CEAIEF2025030104 and no. CEAIEF20240202, and the National Natural Science Foundation of China (NSFC) under grant no. 42474118.

References

[1] Li, M., and Parrot, M. (2012). “Real time analysis” of the ion density measured by the satellite DEMETER in relation with the seismic activity. Nat. Hazards Earth Syst. Sci., 12(9), 2957–2963, https://doi.org/10.5194/nhess-12-2957-2012.

[2] Li, M., and Parrot, M. (2013). Statistical analysis of an ionospheric parameter as a base for earthquake prediction. J. Geophys. Res. Space Physics, 118(6), 3731–3739, https://doi.org/10.1002/jgra.50313.

[3] Li, M., Shen, X., Parrot, M., Zhang, X., Zhang, Y., Yu, C., Yan, R., Liu, D., Lu, H., Guo, F., and Huang, J. (2020). Primary joint statistical seismic influence on ionospheric parameters recorded by the CSES and DEMETER satellites. J. Geophys. Res. Space Phys., 125, e2020JA028116, https://doi.org/10.1029/2020JA028116.

[4] Li, M., Jiang, X., Li, J., Zhang, Y., and Shen, X.(2024). Temporal-spatial characteristics of seismo-ionospheric influence observed by the CSES satellite. Adv. Space Res., 73, 607–623, https://doi.org/10.1016/j.asr.2023.07.044.

[5] Li, M., Yan, H., Liu, D., Liu, X., Gao, Y., Liu, J., Liu, T., Tan, H., and Shen, X. (2025). Spatio-temporal features of seismo-ionospheric influence revealed by the Swarm-B satellite. Adv. Space Res., 76, 5672–5687, https://doi.org/10.1016/j.asr.2025.08.025.

How to cite: Li, M., Liu, T., and Jiang, Z.: Spatio-temporal features of seismo-ionospheric influence revealed by the CSES and Swarm-B satellites, Europlanet Science Congress 2026, The Hague, The Netherlands, 7–11 Sep 2026, EPSC2026-1249, https://doi.org/10.5194/epsc2026-1249, 2026.

11:36–11:48
|
EPSC2026-144
|
ECP
|
On-site presentation
Anna Gülcher and Stephen Kane

Earth is the only known rocky planet to have sustained long-lived plate tectonics, a type of mobile lid regime that has profoundly influenced our planet's mantle cooling, volatile cycling, crustal recycling, and long-term surface habitability. Because present-day surface heat loss exceeds the combined contributions from radiogenic heating and basal heat supplied from the core, Earth’s mantle is not in thermal steady state and continues to cool. Progressive decline of internal heat sources is therefore expected to reduce convective vigor, thicken the lithosphere, and eventually weaken the stresses required to sustain subduction and mobile-lid tectonics. Yet Earth’s future tectonic evolution will not be governed by interior cooling alone. As the Sun continues to brighten during its main-sequence evolution, increasing stellar flux at Earth may drive substantial long-term surface warming through atmospheric and climate feedbacks. Rising surface temperature modifies the upper thermal boundary condition of mantle convection, alters lithospheric temperature gradients, and may partly counteract cooling-induced lithospheric strengthening.

Here we investigate the coupled long-term future of Earth’s mantle dynamics and surface boundary conditions by linking stellar evolution calculations to geodynamic mantle convection models. We first compute the future luminosity evolution of a solar-mass star using established stellar evolutionary tracks calibrated to reproduce the present Sun, and derive the corresponding changes in incident flux at Earth’s orbit and equilibrium surface temperature through time. These calculations are used to construct time-dependent surface temperature scenarios that span moderate warming associated with continued solar brightening and stronger warming cases that approximate amplified greenhouse evolution. We then apply these boundary conditions to two-dimensional spherical annulus thermochemical mantle convection simulations using the geodynamic code StagYY. All models begin from a reference case that reproduces first-order present-day Earth conditions after 4.5 Gyr of evolution, including realistic mantle thermal structure, plate-like surface mobility, and geologically plausible plate velocities. From this present-day state, simulations are extended for a further 8 Gyr under contrasting surface temperature pathways, allowing direct comparison of tectonic longevity, mantle cooling rates, volcanic productivity, and lithospheric behavior.

In the constant-temperature reference future, Earth remains tectonically active for several billion years, but convection steadily weakens as radiogenic heating and core heat flux decline. Mantle plumes and subduction downwellings become less frequent, thermal boundary layers thicken, and surface mobility gradually slows. These results support the view that mobile-lid tectonics on Earth is unlikely to persist indefinitely in the absence of renewed internal energy sources.

When solar-driven warming is imposed, the long-term tectonic trajectory changes. Increasing surface temperature reduces the viscosity contrast across the lithosphere and weakens the near-surface thermal lid. In moderately warmed scenarios, sluggish-lid tectonics develops sooner and is accompanied by enhanced intrusive magmatism. In stronger warming scenarios, plate tectonics is sustained only for a limited time after which transitions to sluggish-lid and ultimately stagnant-lid regimes occur earlier than in the reference case. The different evolutionary pathways are quantitatively compared in terms of tectonic mobility, mantle cooling, magmatic productivity, and lithospheric behavior.

Our results imply that Earth’s tectonic future depends on a balance between diminishing internal heat production, core cooling, and increasing stellar forcing. More broadly, these findings demonstrate that tectonic regime evolution on rocky planets cannot be inferred from interior properties alone. Stellar age, luminosity evolution, and planetary climate history exert control on whether planets maintain mobile lids, transition to stagnant lids, or occupy intermediate states. This has direct relevance for interpreting Earth-like exoplanets observed at different evolutionary stages, as well as Venus and Venus-like worlds, where strong stellar forcing, elevated surface temperatures, and uncertain tectonic histories may fundamentally shape mantle dynamics, volcanic resurfacing, and long-term (in)habitability.

How to cite: Gülcher, A. and Kane, S.: Modeling Earth's future mantle convection with evolving surface temperature , Europlanet Science Congress 2026, The Hague, The Netherlands, 7–11 Sep 2026, EPSC2026-144, https://doi.org/10.5194/epsc2026-144, 2026.

11:48–12:00
|
EPSC2026-108
|
ECP
|
On-site presentation
Angelina Abel and Christian Renggli

Magma oceans represent a fundamental stage in the early evolution of rocky planets and are thought to be widespread during planetary accretion and differentiation. During this phase, extensive melting of the silicate mantle facilitates chemical exchange between the interior and the atmosphere, thereby exerting a primary control on the formation and evolution of primordial atmospheres. The composition of these primordial atmospheres is controlled by the release of volatile and moderately volatile elements from the magma ocean. Moderately volatile elements such as Cu are sensitive to evaporation under magma ocean conditions while remaining partially retained, making them valuable tracers of magma ocean outgassing. In addition to temperature, outgassing processes are governed by melt composition, oxygen fugacity, and ligand availability. As ancient magma oceans remain inaccessible to direct observation, their composition and outgassing behavior cannot be directly constrained. Experimental studies are therefore essential to understand magma ocean-atmosphere interactions.

In this study, outgassing experiments on Cu-bearing chemical systems under vacuum conditions are conducted using a high-temperature setup that combines a simultaneous thermal analyzer with a quadrupole mass spectrometer (NETZSCH STA 449 F3 Jupiter). This approach enables the simultaneous quantification of mass loss and identification of gas-phase species, allowing the determination of kinetic parameters, such as activation energies. The study initially focuses on simple chemical systems, including pure compounds such as Cu metal, Cu oxides, Cu sulfides, and Cu chlorides, and is subsequently extended to more complex silicate melts once the behavior of the simpler systems is well constrained. The outgassing behavior of Cu in silicate melts will be investigated as a function of melt composition, oxygen fugacity, and ligand availability, which are varied stepwise to assess their individual effects.

Initial experiments on simple chemical systems reveal pronounced differences in Cu volatility and gas-phase speciation depending on the starting material. Cu sulfides release CuS into the gas phase at temperatures as low as 600 °C, whereas Cu oxides decompose at around 900 °C, producing monoatomic Cu and O2. In contrast, Cu metal exhibits significant evaporation only at temperatures above 1250 °C. These results indicate that Cu volatility is strongly influenced by its chemical environment.

Building on these results, the influence of ligand availability on Cu volatility is further investigated in reduced silicate melts. While the initial experiments primarily constrain evaporation kinetics, a comprehensive understanding of magma ocean outgassing also requires thermodynamic data. To address this, Knudsen cell experiments will be conducted in a later stage of the project. This method allows for determination of equilibrium vapor pressures and evaporation coefficients under controlled conditions, thereby providing direct constraints on the thermodynamics of Cu evaporation. By combining kinetic data from high-temperature outgassing experiments with thermodynamic constraints from Knudsen cell measurements, this study aims to better quantify the role of chemical environment in magma ocean outgassing and its implications for chemical evolution of primordial atmospheres.

How to cite: Abel, A. and Renggli, C.: From Magma Oceans to Atmospheres: Copper Volatility as a Tracer of Magma Ocean Outgassing, Europlanet Science Congress 2026, The Hague, The Netherlands, 7–11 Sep 2026, EPSC2026-108, https://doi.org/10.5194/epsc2026-108, 2026.

12:00–12:12
|
EPSC2026-599
|
On-site presentation
Valentin Bonnet Gibet, Chloé Michaut, and Nicola Tosi

Long-wavelength variations in crustal thickness are a common feature of rocky planets, but their origin remains unclear. Mars and the Moon have prominent hemispheric crustal thickness asymmetries, whereas Mercury appears to lack such a global dichotomy in the available data. This study examines whether such long-wavelength variations can arise on stagnant-lid planets from endogenous mechanism, without invoking external events such as giant impacts. We focus on two positive feedback mechanisms that operate during the early stages of mantle convection and crust formation. Both mechanisms rely on mantle melting that is enhanced beneath thinner lithospheric lids, where pressures are lower. The first mechanism links crustal thickness to the extraction rate of heat-producing elements from the mantle: because these elements are incompatible and are preferentially concentrated in melts, thicker crust locally enriches the lid in radiogenic material, which results in a hotter and thinner lid and promotes further melting and crust extraction from the convective mantle below (Bonnet Gibet al. 2022). The second mechanism links lid thickness to its own growth rate through the melt dependence of mantle rheology: melt decreases mantle viscosity and modifies the efficiency of convective heat transport. As explained above, thinner lids result in larger melt fractions in the convective mantle below and therefore in a more efficient mantle heat flux, which leads to a lower lid growth rate where the lid is thinner (Watson al. 2022). Linear stability analyses show that both feedbacks preferentially amplify degree-1, hemispheric scale instabilities, with the lid thickening feedback mechanism operating faster than the crustal thickening feedback mechanism (Bonnet Gibet et al. 2026).

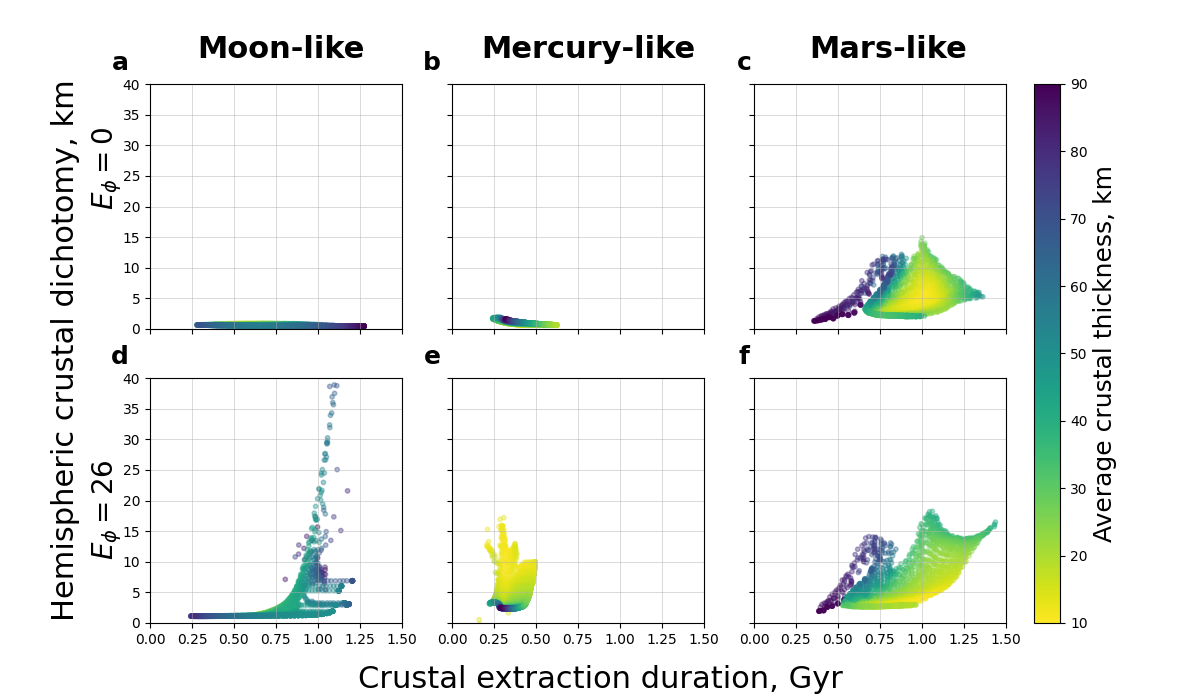
To investigate these mechanisms quantitatively, we use a parameterized stagnant-lid convection model with crustal growth by melt extraction. The convective mantle is treated as a well-mixed interior overlain by a conductive lid. The model includes the redistribution of heat-producing elements between crust and mantle during crust formation, as well as the influence of melt on mantle rheology. To represent hemispheric asymmetry, the lid is divided into two hemispheres that evolve independently while remaining coupled to the same convective mantle. We can therefore follow crust formation, lid growth, and the global thermal evolution of the planet over 4.5 Gyr of evolution. In this model, the main parameters are the efficiency of melt extraction and the reference mantle viscosity, which together regulate planetary cooling, hence how long mantle melting persists. We systematically explored the parameter space for two end-member cases: with or without melt-dependent rheology (see Figure 1).

Figure 1: Final hemispheric dichotomy in crustal thickness (km) as a function of the total crustal extraction duration the crustal extraction duration, i.e. the total time over which the crust forms (Gyr) with the global volume-averaged final crustal thickness in colour- scale for different planet cases. The first row shows model calculated using Eϕ = 0 (without melt-dependent rheology) while the second row shows models calculated using Eϕ = 26 (with melt-dependent rheology).


The comparative behaviour of Mars, the Moon, and Mercury depends strongly on planet size, mantle thickness, and hence on the duration of crust extraction. On Mars, the crustal thickening feedback alone is sufficient to generate a crustal thickness dichotomy similar to the observed one (Figure 1c), and the inclusion of the lid thickening feedback mainly enhances the growth of the asymmetry (Figure 1f). On the Moon, the crustal thickening mechanism alone is insufficient to produce the observed nearside-farside asymmetry (Figure 1a). A significant dichotomy only develops when both feedbacks interact (Figure 1d). In this case, a lid thickness asymmetry first appears rapidly, then promotes an asymmetric melt extraction, and finally allows a crustal thickness contrast to grow, which subsequently triggers the crustal thickening feedback mechanism. Mercury evolves differently because its rapid cooling, caused by its thin mantle, limits the duration of crust extraction and therefore limits the ability of the crustal thickening mechanism to develop (Figure 1b). In this case, the lid thickening feedback is able to generate a significant hemispheric asymmetry, but only for sufficiently thin crusts (Figure 1e). More broadly, our results show that long-wavelength crustal variations can arise naturally from positive feedback mechanisms involving mantle partial melting, lid asymmetry, and crustal growth.

Building on these results, current work aims to investigate the interaction between crust extraction and mantle convection using 2D global geodynamical models for stagnant-lid planets. In these models, crust formation is coupled self-consistently to mantle melting through melt extraction at Darcy velocity, while the influence of partial melting on mantle rheology and convective dynamics is explicitly taken into account. This approach will allow us to explore how mantle plumes in a partially molten mantle interact with the positive feedback mechanisms described here, and to determine how these processes control the wavelength and amplitude of crustal thickness variations on Mars and Mercury.


How to cite: Bonnet Gibet, V., Michaut, C., and Tosi, N.: The formation of long-wavelength variations in crustal thickness on Mars, Mercury and the Moon. , Europlanet Science Congress 2026, The Hague, The Netherlands, 7–11 Sep 2026, EPSC2026-599, https://doi.org/10.5194/epsc2026-599, 2026.

12:12–12:24
|
EPSC2026-404
|
ECP
|
On-site presentation
Ondřej Krýza, Petr Brož, Jacob Adler, Matthew Sylvest, and Manish Patel

Metastable liquids (including water, brines, and mud)  are thought to play an important role in shaping planetary surfaces, from putative sedimentary volcanism and recurring slope lineae on Mars to cryovolcanic activity on icy bodies such as Europa, Enceladus, and Triton (e.g., [1-3]). Under the cold and low-pressure conditions present on many planetary bodies, such liquids become inherently metastable once exposed at the surface, undergoing rapid boiling, evaporative cooling, and freezing (e.g., [4-6]).

All these different processes share one important requirement: a liquid must be suddenly exposed to a low-pressure environment before it has time to thermodynamically adjust to the new conditions. Yet most existing experimental setups, whether designed for flows of brines, pure water, or mud, rely on gradual depressurization (e.g., [7-10]). During this process, evaporative cooling progressively pre-conditions the fluid prior to eruption, promoting partial equilibration, early ice or salt-crystal nucleation, and changes in rheology before surface exposure occurs. As a result, the observed flow dynamics may preferentially reflect late-stage, partially equilibrated behaviour rather than the initial response of a metastable liquid to rapid decompression, potentially limiting the applicability of such experiments to planetary surface processes involving abrupt liquid release.

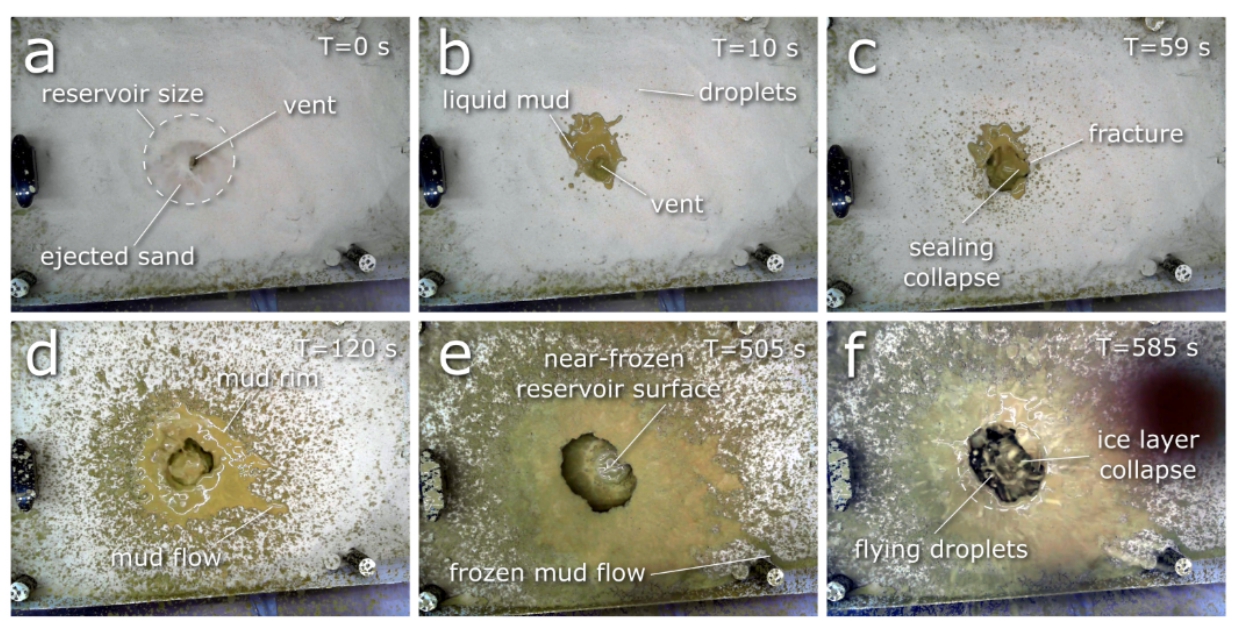
Here, we introduce a new experimental approach enabling controlled subsurface release of metastable mud under Mars-relevant low-pressure (~4.5 mbar) and subfreezing (−25 °C) conditions. The experiments used low-viscosity mud stored beneath a frozen crust within a low-pressure chamber. The fluid is stored beneath an ice-sealed reservoir that is subsequently thermally weakened and breached from below using a localized heating element (Fig. 1). Unlike previous surface-release experiments, the presented setup enables subsurface-confined eruptions driven by internally generated boiling pressure. This setup minimizes direct interaction between the mud and the low-pressure environment prior to eruption, allowing the fluid to remain close to its initial thermal state until rupture occurs. The ensuing eruption is therefore driven by in situ boiling and rapid decompression rather than by slow pre-equilibration during chamber evacuation.  

Fig. 1. Sequence of images showing reservoir opening, fountains, droplets, liquid mud, and flows on panels.

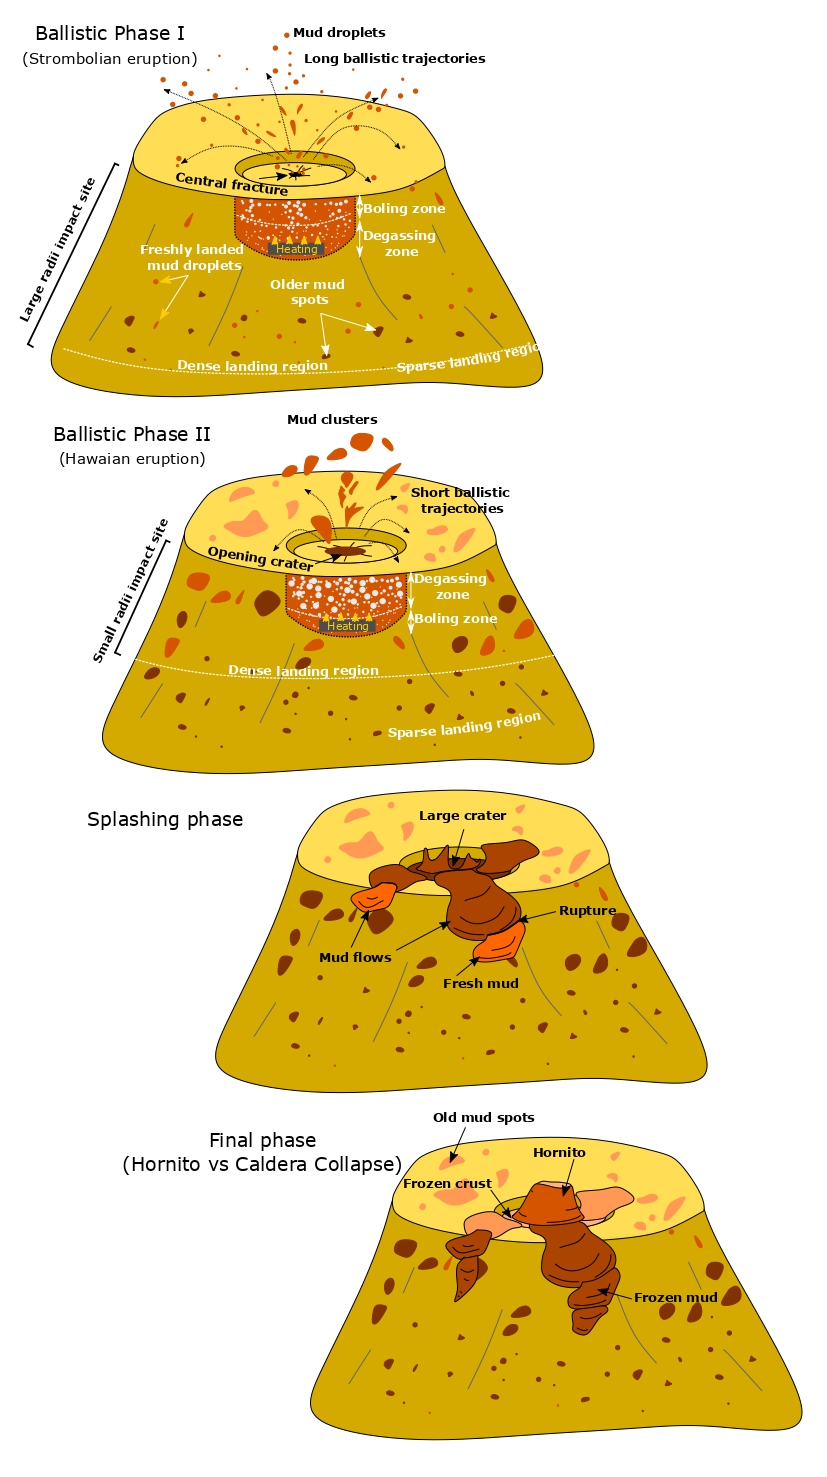
The experiments reveal a systematic progression in eruptive behaviour, recognisably analogous to natural sedimentary volcanism. An initial ballistic, Strombolian-like phase is characterised by discrete short-lived bursts ejecting mud droplets from the vent. This activity progressively transitions into a mixed ballistic-effusive regime and ultimately into pulsatory effusive emplacement forming coherent mud flows downslope (Fig. 2). Repeated ballistic and pulsatory activity also promoted proximal accumulation of erupted material and the development of cone-like edifices around the vent. The eruption dynamics are driven by internally generated pressure pulses associated with boiling and phase transitions within the metastable reservoir, rather than by externally imposed pressure gradients. The experiments therefore demonstrate that boiling of metastable mud alone is sufficient to generate cyclic pressurization, pulsatory eruptions, and sustained flow emplacement under Mars-like pressure conditions.  

Figure 2: Conceptual evolution of eruptive behaviour from ballistic mud ejection to pulsatory effusive flow emplacement under low-pressure conditions. 

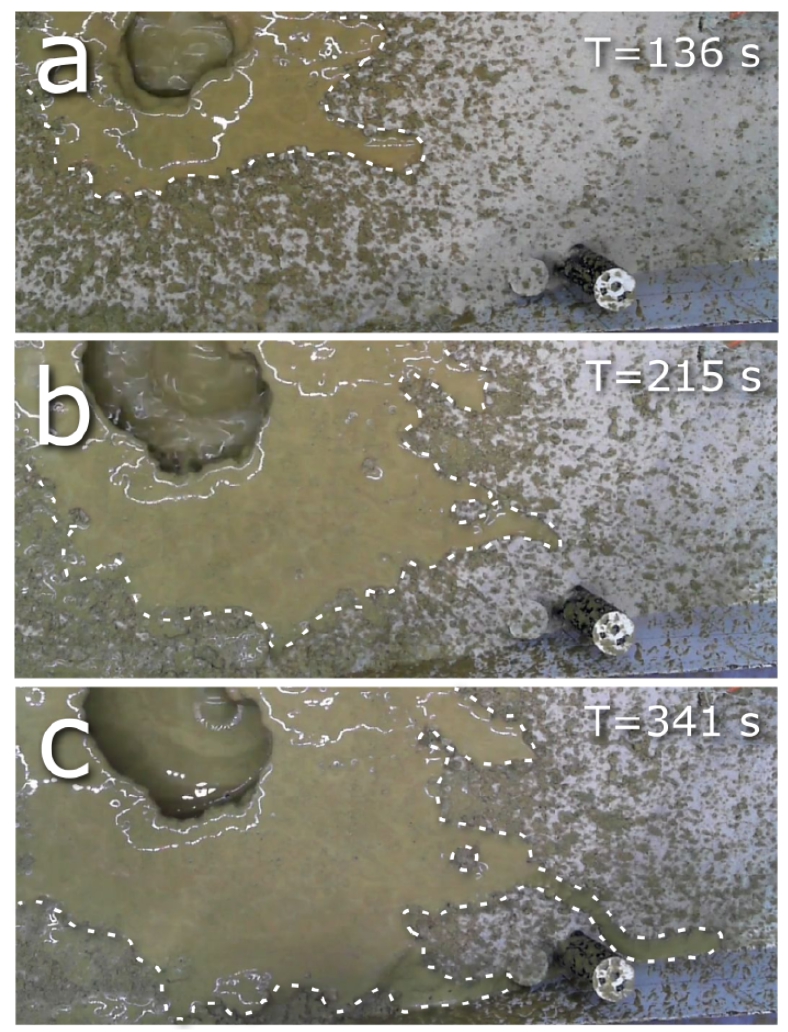
Flow development is controlled by droplet size, transport distance, and limited cooling during ballistic transport (~0.5–4 °C). The relatively small thermal losses during flight allow erupted mud to remain liquid upon deposition despite ambient subfreezing conditions, promoting coalescence of ballistic ejecta into continuous flows (Fig. 3). This suggests that even under Martian gravity and atmospheric pressure, ballistic emplacement may directly contribute to the formation of coherent flow-like deposits. These observations suggest that similar coupling between ballistic emplacement and coherent flow formation may also occur under Martian surface conditions.  

Figure 3: Formation of mud flows around the eruption site through progressive accumulation and coalescence of ballistic and effusive mud emplacement. 

Together, these results demonstrate that sedimentary volcanism under low-pressure planetary conditions can operate as a self-sustaining mechanism capable of generating both explosive and effusive behaviour without the need for continuous external pressurization. The presented subsurface-confinement-and-breach approach provides a scalable experimental framework for investigating metastable liquids under rapidly changing low-pressure conditions. Beyond sedimentary volcanism on Mars, the setup is readily adaptable to brines, cryogenic fluids, and cryovolcanic analogues relevant to icy bodies, offering new experimental constraints on eruption dynamics, flow emplacement, and planetary surface evolution. 


References

[1] Fagents (2003), JGR, 108, 5139. [2] Lesage et al. (2021). [3] Brož et al. (2023), Earth Surf. Dyn., 11, 633–661. [4] Hecht (2002), Icarus, 156, 373–386. [5] Bargery et al. (2010), Icarus, 210, 488–506. [6] Brož et al. (2025), EPSL, 668, 119331. [7] Brož et al. (2020a), Nat. Geosci., 13, 403–407. [8] Brož et al. (2023), JGR: Planets, 128, e2023JE007950. [9] Krýza et al. (2025), Commun. Earth Environ., 6, 116. [10] Adler et al. (2025), Commun. Earth Environ., 6, 841.

How to cite: Krýza, O., Brož, P., Adler, J., Sylvest, M., and Patel, M.: Beyond gradual depressurization: Building mud volcanoes from a metastable reservoir, Europlanet Science Congress 2026, The Hague, The Netherlands, 7–11 Sep 2026, EPSC2026-404, https://doi.org/10.5194/epsc2026-404, 2026.

12:24–12:30

Orals FRI3: Fri, 11 Sep, 14:00–15:30 | Room Saturn (Jazz 3)

Chairpersons: Petr Broz, Sam Poppe, Ernst Hauber
14:00–14:12
|
EPSC2026-882
|
On-site presentation
Gerald Eichstädt, Anton Ermakov, Michael Ravine, and Scott Bolton

During Juno’s approach to Perijove 58, her wide-angle visible light imager JunoCam took a sequence of Io images. Four of those images show the lava lake Loki Patera with a solar specular deviation angle varying approximately between 0.25 and 0.8 radians.

We call the angle between the solar specular vector relative to Io’s nominal surface normal and the vector from the respective surface point to the camera the solar specular deviation angle. We call the angle between the plane defined by the sun and the respective surface normal solar specular azimuth when seen relative to the solar specular vector. This construct is similar to polar azimuthal coordinates, just with the solar specular vector as symmetry axis, and the vector to the Sun being used to define the zero azimuth.

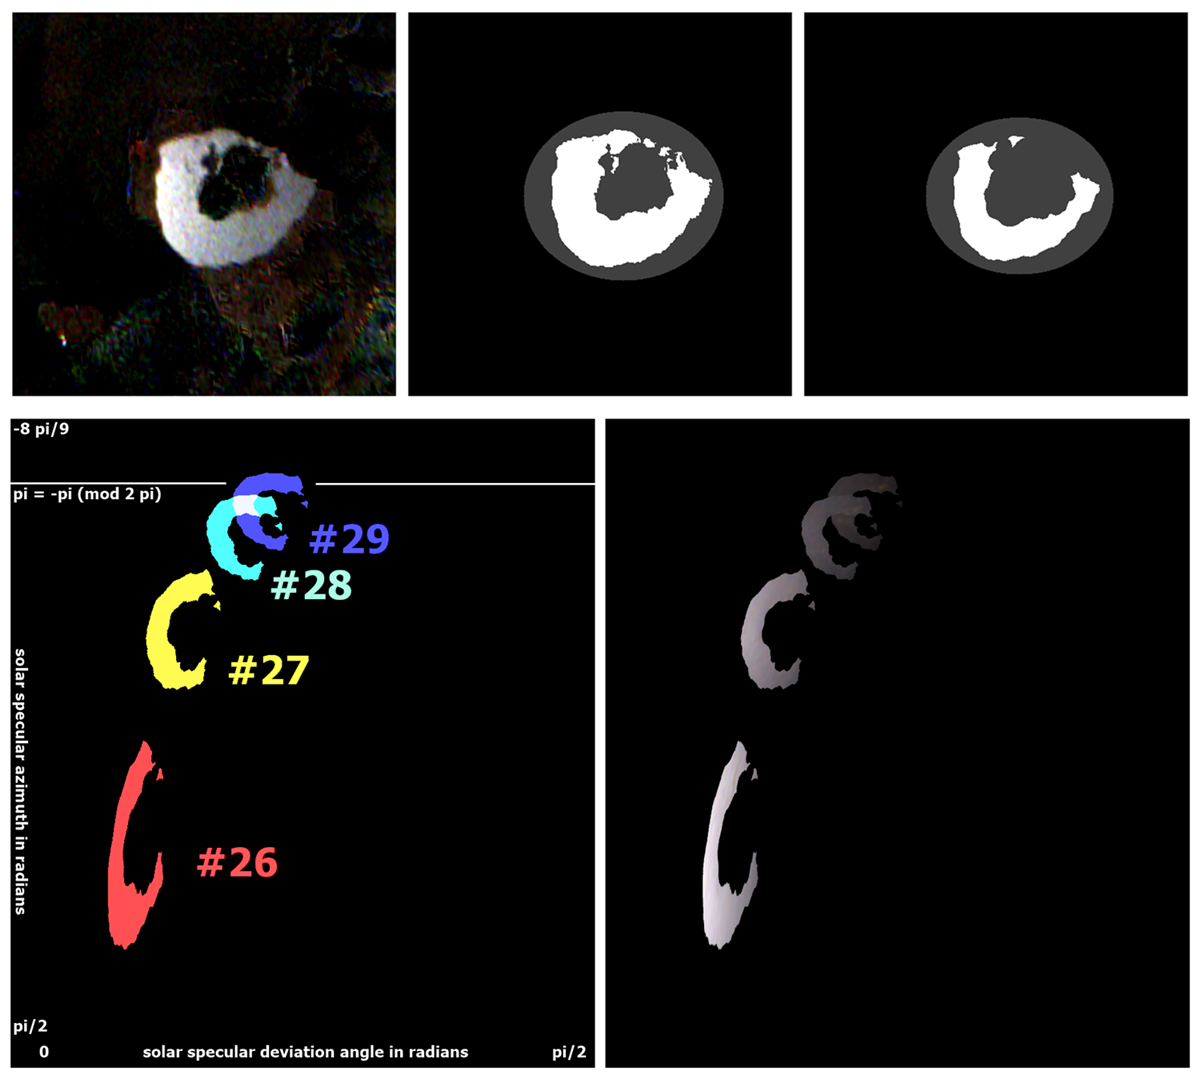
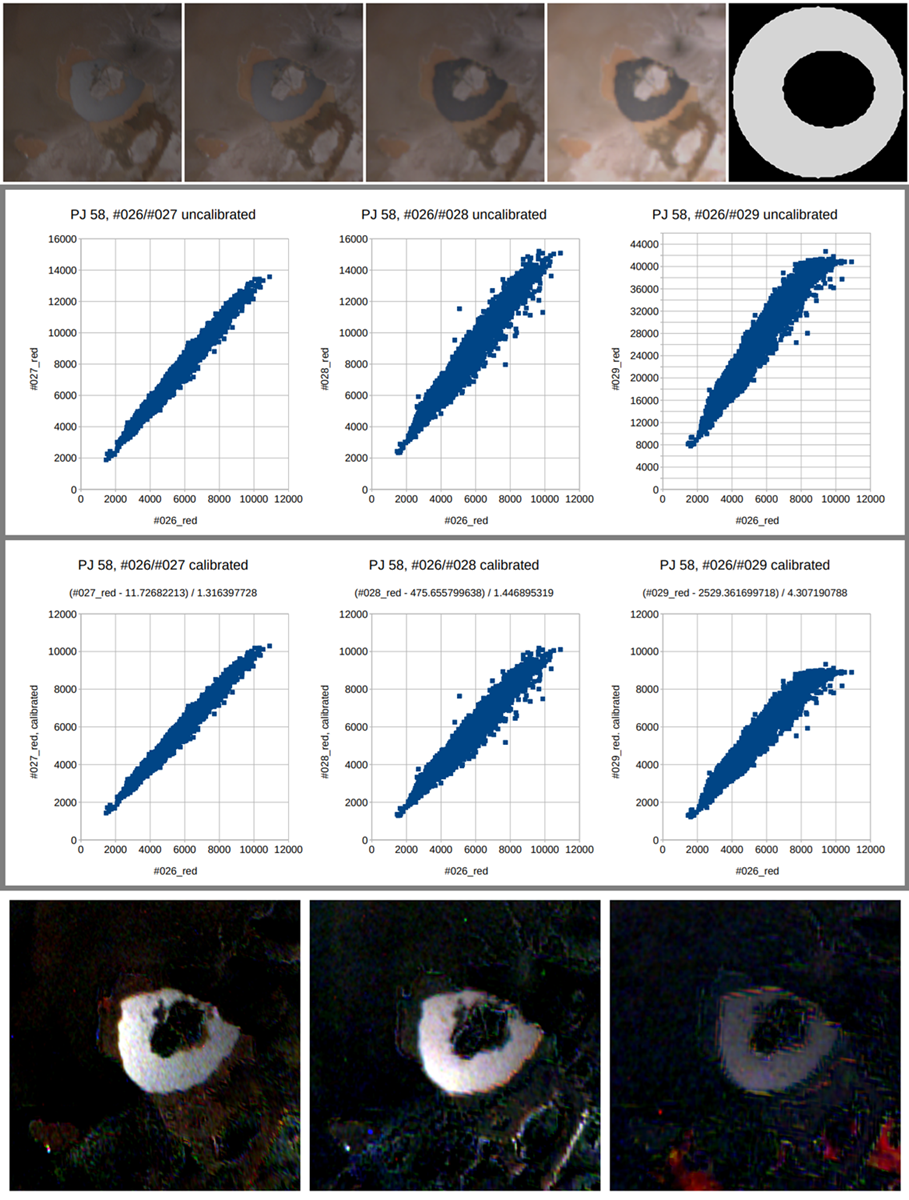
We sample an annulus around the lava lake in order to estimate relative exposure times and dark biases by applying linear least-square regression. This approach is described in Figure 1.

Figure 1: Crops of cylindrical map projections of the four JunoCam images 26, 27, 28, and 29 taken before Perijove 58 are shown in the first row, together with a mask that defines an annular area around the lava lake of Loki Patera. North is to the right. Samples within this annulus are taken for images 27, 28, and 29, and brightness-correlated to the same locations in image 26. The second row shows the resulting correlation diagrams. Linear least-square regression is applied to those data sets as an approximation of a calibration of images 27, 28, and 29 relative to image 26. The resulting calibrated correlation is shown in the third row. The fourth row shows the residuals betweem consecutive images, hence for image pairs (26-27), (27-28), and (28-29).

The residuals remove most of the area outside the lava lakes. The lava lakes themselves show up very distinctly. We use this property for image pair (26-27) together with the red/green slope of image 26, and with a draft elliptical area selection, as a heuristics to define a mask that covers the lava lake. This mask is then further eroded in order to make sure that sampling within the mask does contain only interior points of the lava lake area, see Figure 2.

Figure 2: The first row visualizes steps from the difference (26-27) of calibrated images 26 and 27, over a mask that covers the lava lake area, to an eroded mask that covers only the interior area of Loki Patera. The second row plots the mask and the masked and calibrated caldera in coordinates of the solar specular deviation angle and azimuth, both in radians, and applied to all four considered images. Since the Juno spacecraft is changing her position with each image, the lava lake changes its apparent position relative to the solar specular vector. Compared to the surrounding area of the lava lake, its interor area is brightest for image 26, and dims until image 29, while the solar specular deviation angle is increasing. The y axis at the left border of the two panels at the bottom defines the solar specular vector, along which a perfect spherical mirror with Io’s radius and center would reflect the sunlight.


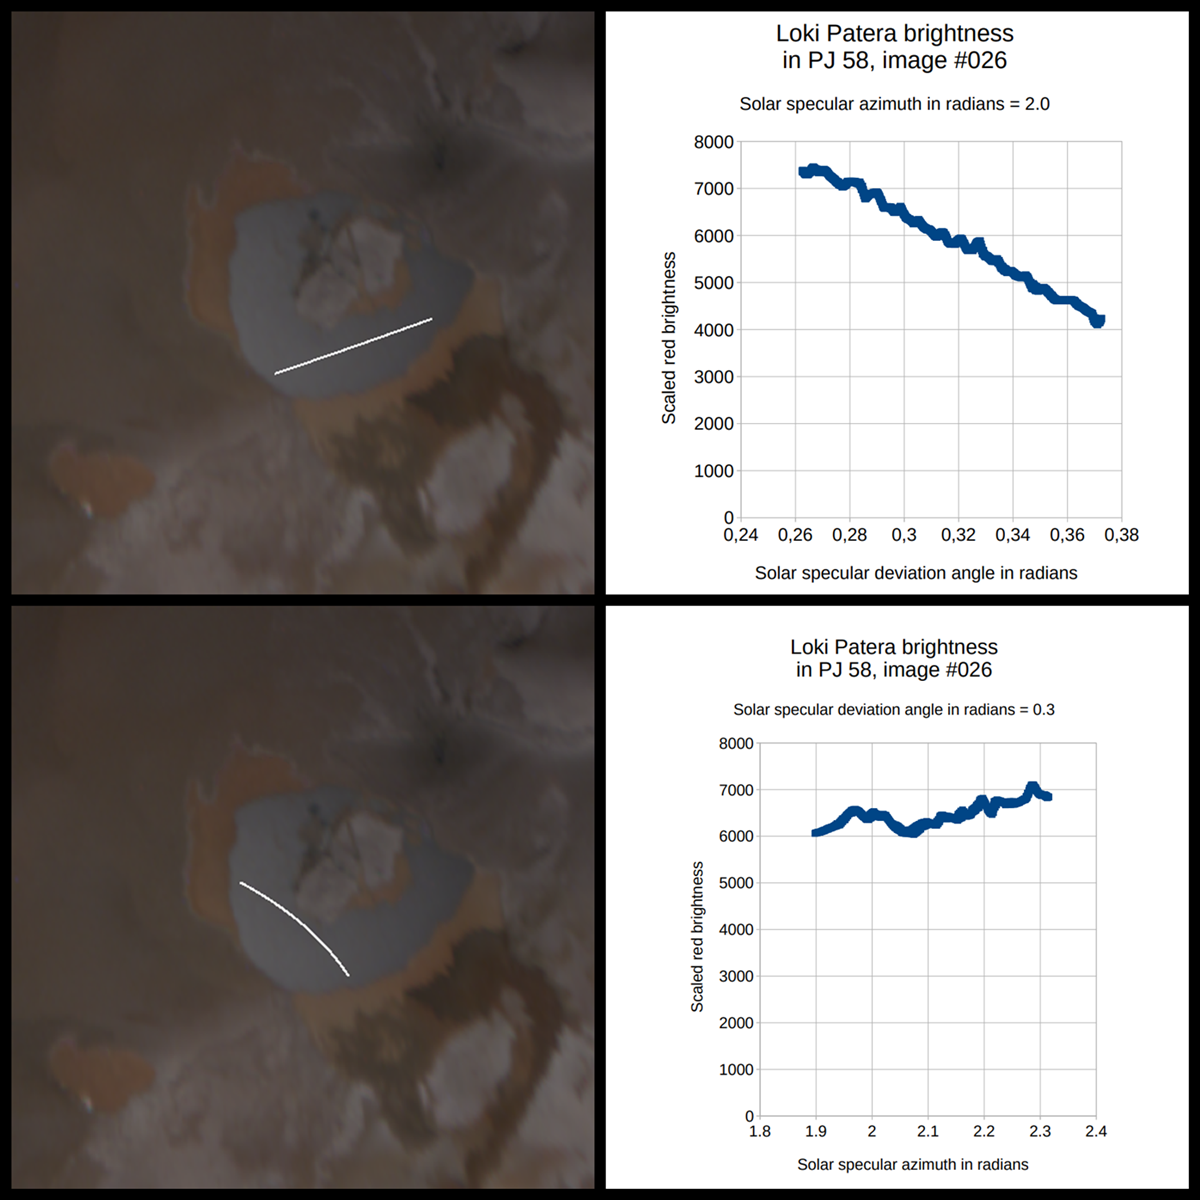
With this prerequisites, we sample Loki Patera along contour lines of either constant solar specular deviation angle, or of constant solar specular azimuth. Sampling is restricted to the eroded mask in order to retrieve only valid samples from the interior of the lava lake area. Both cases are visualized in Figure 3.

Figure 3: The first row samples along the contour line with a solar specular azimuth equal to 3.0 radians. The second row samples along the line with a specular deviation angle of 0.3 radians. The left column shows the sampling tracks in cylindrical map projections. The right column shows the brightness charts of the red channel. The effect of the solar specular deviation angle is significant and locally close to linear, while the effect of the azimuth can be interpreted as weakly linear, not quite constant, and noisy, or influenced by local heterogeneities.

Samples taken along contour lines suggest that brightness values of the lava lake can be reasonably approximated patera-locally, and for each image separately by linear regression over two dimensions with the solar specular deviation angle and azimuth as axes.

Concavity of the brightness plot becomes apparent only after combining charts of a sequence of images.


How to cite: Eichstädt, G., Ermakov, A., Ravine, M., and Bolton, S.: Loki Patera’s specular surface by JunoCam image data, Europlanet Science Congress 2026, The Hague, The Netherlands, 7–11 Sep 2026, EPSC2026-882, https://doi.org/10.5194/epsc2026-882, 2026.

14:12–14:24
|
EPSC2026-1176
|
ECP
|
On-site presentation
Diogo Quirino, João C. Duarte, Pedro M. Machado, J. Mattias Green, Filipe M. Rosas, and João Dias

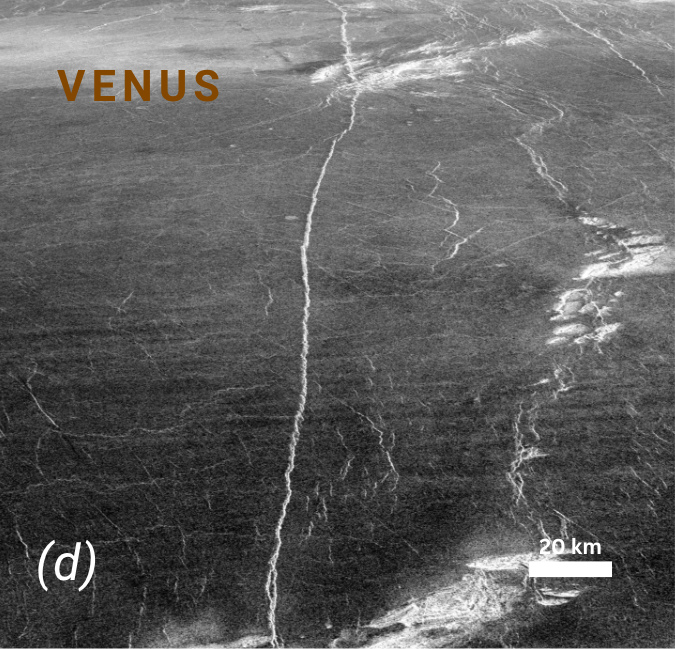
One of the biggest open questions about Venus is the degree and extent of present-day volcanism [1]. Despite having a similar size and density to Earth, Venus underwent distinct geodynamic evolution with no plate tectonics. The planet hosts a wide diversity of tectonic and volcanic landforms, as revealed by NASA/Magellan global imagery (1990 – 1994) [2].

One prominent feature is the extensive, widespread rifts on Venus (e.g., [3]), covering about 8% of the planetary surface [4]. These are extensional structures [5], among the youngest geological features on the planet according to stratigraphic interpretation [6]. Evidence of recent rift volcanism has been suggested for Olapa Chasma [7 – 9] and Ganis Chasma [10 – 11]. However, the mechanisms of rift formation, age, and relationships with other structural features remain poorly understood, yet crucial for supporting modelling studies [12].

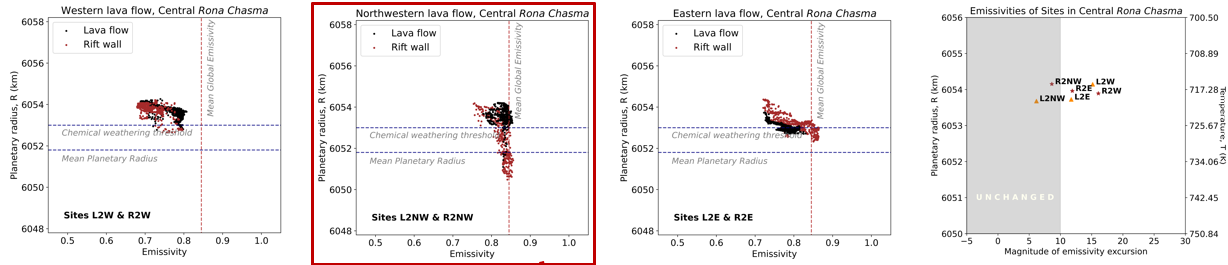
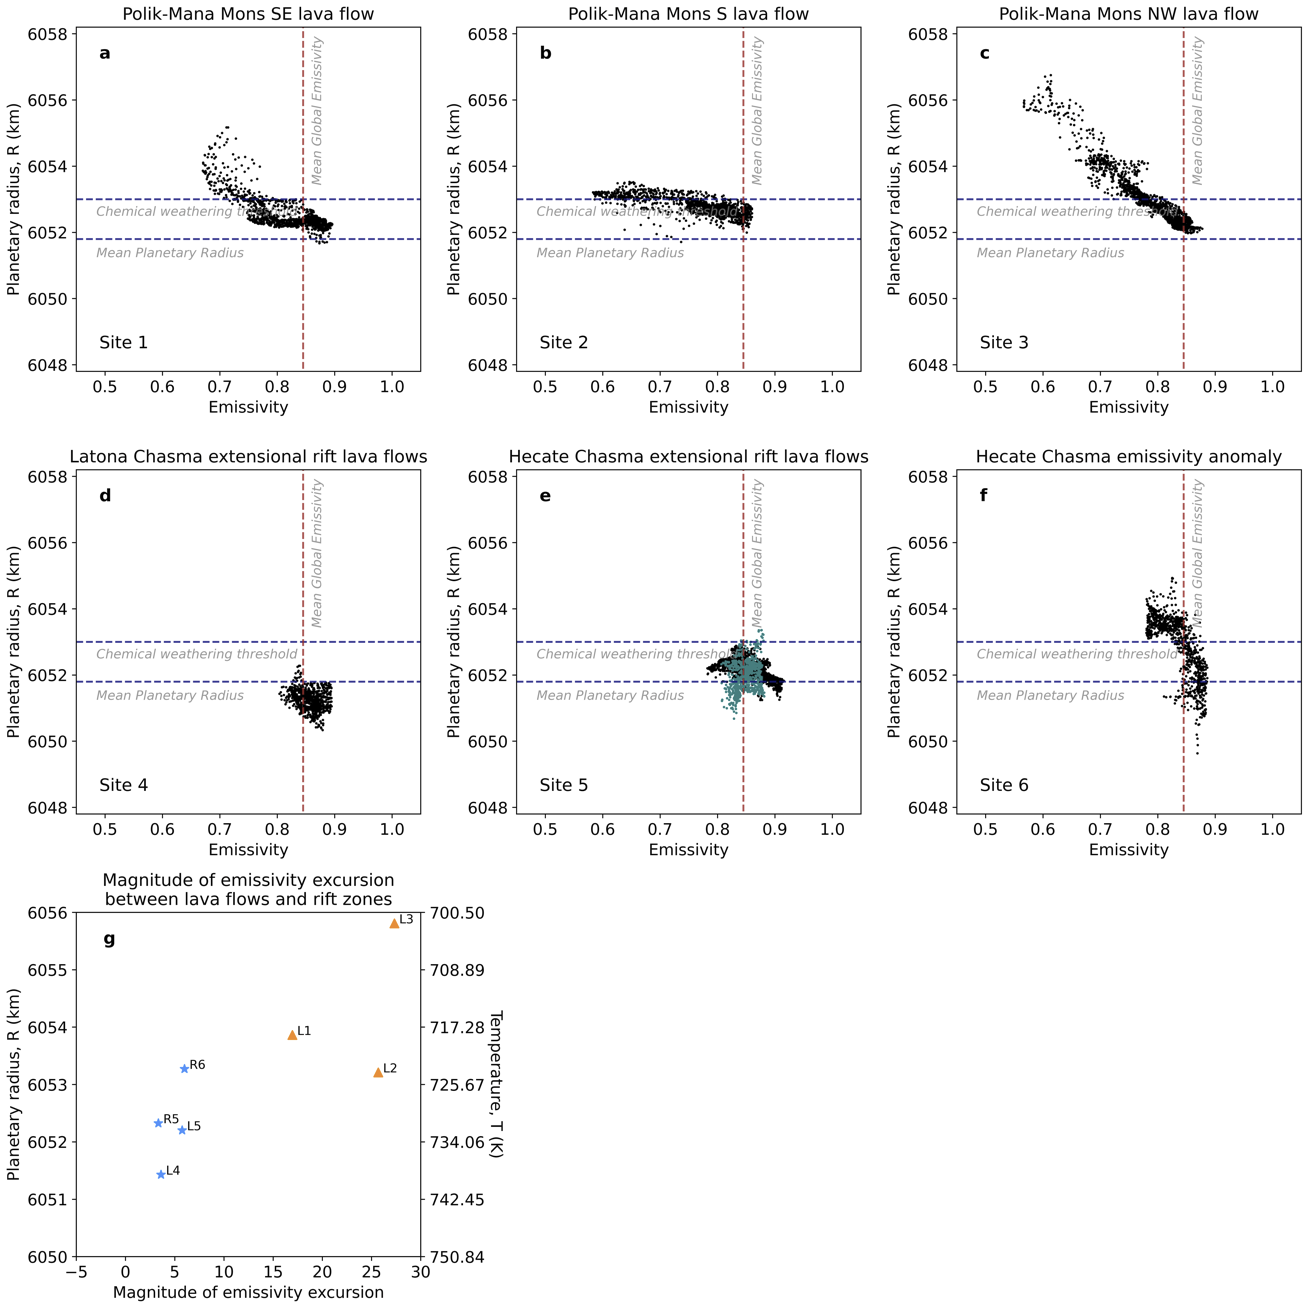
In this study, we analyse the tectonovolcanic activity of major rifts on Venus using microwave emissivity as a proxy to constrain the weathering degree, relative age, and composition [11, 13 – 14], assuming the presence of ferroelectric minerals [13, 15 – 16]. We use Synthetic Aperture Radar (SAR), microwave emissivity, and elevation datasets collected from NASA/Magellan (see Figure 1). Site selection, radar emissivity, and elevation extraction are performed in ArcGIS Pro to examine emissivity excursion with altitude. Complementary analyses based on stratigraphic relationships with structural features, such as lava flows, rift structures, and lineaments, provide relative chrono-stratigraphy and conceptual interpretation of tectonovolcanic activation processes. For example, we observe a very recently active region within Rona Chasma, where we can detect multiple and distinct emissivity excursions by isolating specific lava flows (see Figure 2). One of these lava flows shows a very limited excursion despite being above the chemical weathering threshold. Combined with radar imagery, we confirm that the lava flow is fresh and study its cross-cutting relations with the neighbouring rift - which support a pattern of rift activation, followed by lava emplacement and later rift cutting over the lava flow. We expand this analysis to all major rifts on Venus, focusing on regions where lava flows are evident. Thus, the objective is to provide a conceptual model for global-scale tectonovolcanic rift activation by combining microwave emissivity excursions, stratigraphic relationships, and stress patterns. These results are relevant to upcoming accepted and potential missions to Venus in the coming decade, which will yield extensive new data. The objective is to identify and select possible rift zones with recent tectonovolcanic activity to support the selection of regions of interest on Venus (e.g., ESA/EnVision).

Figure 1. (a - f) Elevation versus emissivity plots for the selected rift region in the vicinity of Polik-Mana Mons (24.5ºN; 264ºE) in Venus. The green data points in (e) indicate rift terrain and are used to separate its contribution from the lava flows (in black) which occupy a smooth terrain with less variations in topography; (g) magnitude of emissivity excursions as a function of elevation and temperature for the different sites in analysis (orange triangles represent lava flows; blue stars represent rift walls with lava flows (L) or rift terrain (R)).

Figure 2. Same as above, but for a recent active region in Rona Chasma (2.5ºN; -72ºE).

References: [1] Filiberto, J., et al., 2025. Geochemistry, 85; [2] Saunders, R. S., & Pettengill, G. H., 1991. Science, 252, 247; [3] Masursky, H., et al., 1980, J. Geophys. Res., 85, A13; [4] Price, M., & Suppe, J., 1995. EM&P, 71, 99; [5] Magee, K. P., & Head, J. W., 1995. J. Geophys. Res., 103, B1; [6] Ivanov, M. A., & Head, J. W., 2011. P&SS, 59, 1559; [7] D’Incecco, P., et al., 2020. EPSL, 546, 116410; [8] D’Incecco, P., et al., 2021. PSJ, 2, 5; [9] López, I., et al., 2022. J. Volcanol. Geotherm. Res., 421, 107428; [10] Shalygin, E. V., et al., 2015. GRL, 42, 12; [11] Brossier, J., et al., 2022. GRL, 49, e2022GL099765; [12] Regorda, A., et al., 2023. JGR: Planets. 128, e2022JE007588; [13] Brossier, J. F., et al. 2020. Icarus. 343. 113693; [14] Brossier, J., et al., 2021. JGR: Planets. 126, e2020JE006722; [15] Shepard, M. K., et al., 1994. GRL, 21, 6; [16] Treiman, A. H., et al., 2016. Icarus, 280, 172.

Funding: DQ acknowledges this work to be supported by FCT - Fundação para a Ciência e Tecnologia, I.P. by project reference and DOI identifier 10.54499/2023.05220.BD. 

How to cite: Quirino, D., Duarte, J. C., Machado, P. M., Green, J. M., Rosas, F. M., and Dias, J.: Exploring Rift Tectonovolcanism on Venus: a global perspective, Europlanet Science Congress 2026, The Hague, The Netherlands, 7–11 Sep 2026, EPSC2026-1176, https://doi.org/10.5194/epsc2026-1176, 2026.

14:24–14:36
|
EPSC2026-201
|
ECP
|
On-site presentation
Xi Yang, Taras Gerya, and Anna Gülcher

Extensional rift systems on Venus are widely distributed and provide important insights into Venus's past and current tectonic activities [1]. Outstanding questions for Venusian rifts relate to their driving forces and lithospheric properties, which have been explored by a few studies. Previous 2D geodynamic models [2] explored Venus rifting with limited tectonic extension rates (1 cm/yr) and very thin lithosphere, and indicated strong crustal rheology needed for rift localization and rift morphologies being strongly affected by crustal thickness. More recent 3D models of Venus rifting [3] showed different types of rifting morphologies with a 2 cm/yr extension rate that depend on crustal rheology, crustal thickness, and lithosphere thermal structure. Both of these geodynamic studies explored Venus rifting with visco-plastic incompressible rock rheologies.

Here, we use a state-of-the-art thermomechanical model I3ELVIS [4] that accounts for visco-elasto-plastic compressible rock rheology and plastic strain-induced weakening to investigate the rifting process on Venus. In particular, we test models with three different crustal rheologies [5]: plagioclase, dry diabase, and mafic granulite. The mantle material uses dry olivine [6], which accounts for grain size evolution (Zener pinning) [7]. We model the rifting with slow, moderate, and fast extension rates of 1, 3, and 10 cm/yr, respectively. To initialize spontaneously localizing rifting, we prescribe a 150-km-thick thermal lithosphere ( ~1650 K isotherm) that is slightly thinned in the middle. Of particular interest, we track the width of the rift flank uplift, which is defined as extending from the peak topography outward to where the flank uplift is indistinguishable from the surrounding terrain. For all modeled and observed rifts, this feature is extracted with a lateral resolution of 16 km, consistent with the global resolution of the Magellan measurements.

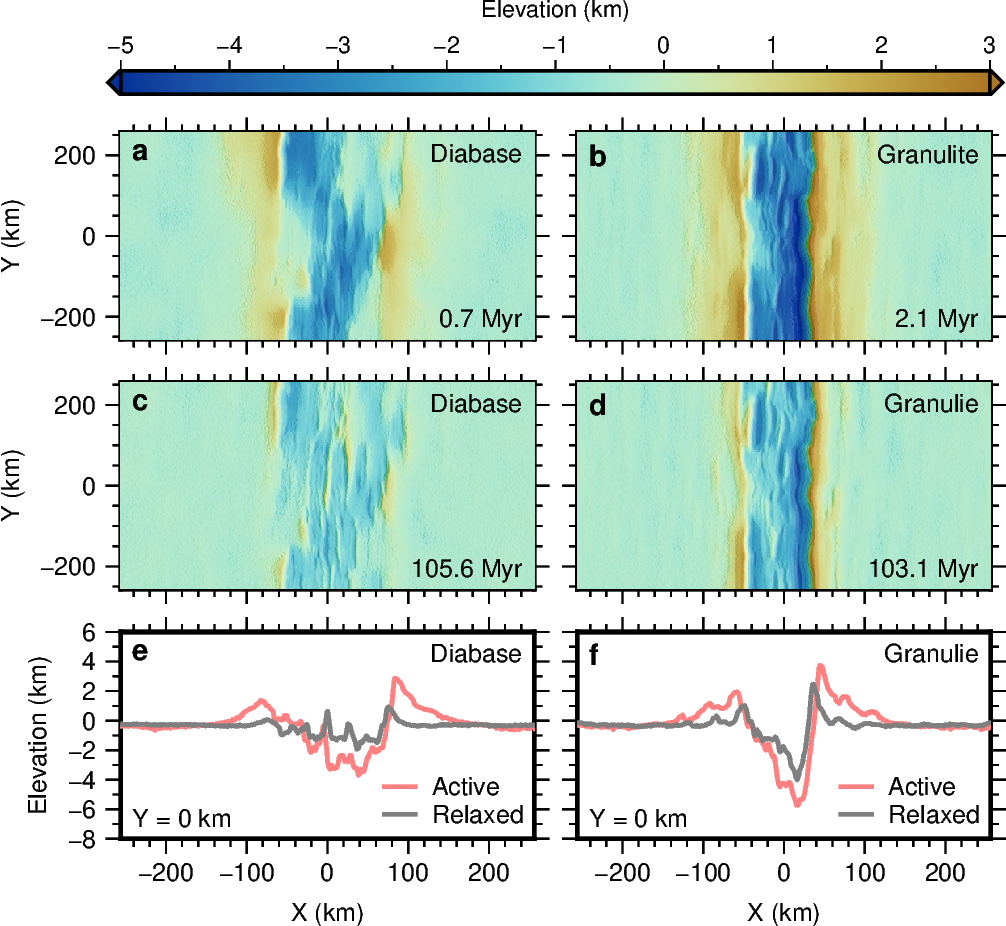
We find that the crustal rheology and the tectonic extension rate particularly influence fault formation during rifting. The diabase crust models subjected to small/moderate extension rates produce a rift valley characterized by several small-scale normal faults. When subjected to a fast extension rate, the diabase crust forms a rift valley with a set of conjugate normal faults and a dominant normal fault at the edge of the rift valley  (Fig.1a). The stronger granulite crust subjected to a moderate (Fig.1b) or fast extension rate generates dominant detachment fault or a pair of conjugate normal faults, repsectively,  and it only generates several sets of normal faults without a dominant normal fault when subjected to a slow extension rate. The weakest plagioclase crustal rheology generates a rift valley with fault-like topography only when subjected to a moderate or fast extension rate. We repeated all models with the extension rate of 10 cm/yr for a 100-km-thick lithosphere (~1625 K isotherm); none could generate a rift valley, demonstrating the need for a relatively thick thermal lithosphere.  

Fig.1 (a,b) Active and (c,d) relaxed topography and (e,f) their topographic profiles at Y = 0 km that are derived from the models of (a,c) the diabase crust subjected to an extension rate of 10 cm/yr and (b,d) the granulite crust subjected to an extension rate of 3 cm/yr. The (c,d) relaxation starts from the models (a,b) active models active models.


All rifts formed in our models generate wide rift flank uplifts with a median width >60 km. In particular, the strong mafic granulite crust with moderate to fast extension rates and the dry diabase crust rheology with fast extension rates show a median flank uplift width exceeding 120 km (e.g., Fig.1a,b). To investigate whether the wide uplifted rift flanks can serve as evidence for active rifting, we investigate the isostatic relaxation of rifts by continuing the same numerical models with zero extension rate. After about 100 Myr of relaxation, the median widths of rift flank uplift in the diabase and granulite crust decrease to <30 (Fig.1c) and 50 km (Fig.1d), respectively, demonstrating that wide rift flank uplifts (>100 km) are indeed a signature of currently or recently active rifting (Fig.1e,f).

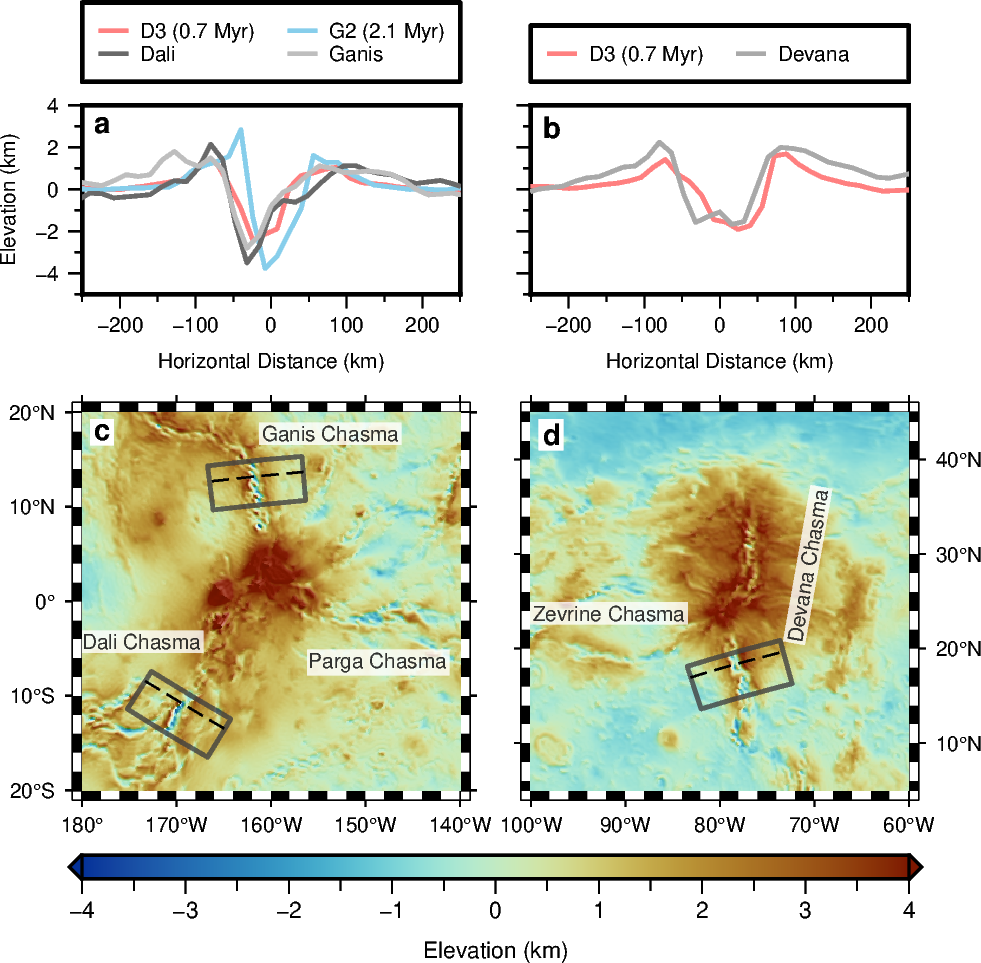
Fig.2 (a,b) The topographic profiles and (c,d) regional topographic maps of (a,c) Alta and (b,d) Beta Regiones. The profiles are oriented from West to East, and their location are denoted by dashed black lines. (a,b) Down-sampled (16 km) topographic profiles from models of the diabase crust subjected to a 10 cm/yr extension rate (D3) and the granulite crust subjected to a 3 cm/yr extension rate (G2), respectively. (c,d) The gray boxes denote the regions used to extract the median width of rift flank uplifts.


We analyze the topography of rift valleys from Ganis, Dali, and Devana chasmata; their median width of rift flank uplifts is about 110, 160, and 180 km, respectively (Fig.2c,d). Comparing these profiles to our results suggests that the rift valleys of these chasmata are presently or recently (within a few tens of Myr) active. Furthermore, our models favor a dry diabase crust with a high extension rate or a mafic granulite crust with a moderate extension rate, which generates a similar topography of rift valleys (Fig.2a,b). These are aligned with previous studies suggesting that the Venusian crust should be basaltic with mafic rheology [8-10] and previous rifting models [2,3]. The preferred rapid extension rate might be associated with plume-lithosphere interactions in the studied regions, which needs future testing.


Reference:

[1] Price, M. & Suppe, J., EM&P (1995). [2] Regorda, A. et al., JGR-Planets (2023). [3] Gülcher, A. et al., EPSL (2025). [4] Gerya, T. (2019) [5] Ranalli, G. (1995). [6] Hirth, G. et al., Geophys. Monogr. Ser (2004). [7] Bercovici, D. & Ricard, Y., Phys. Earth Planet. Inter. (2012). [8] Foster, A. & Nimmo, F., EPSL (1996). [9] Mackwell, S. et al., JGR-Solid Earth (1998). [10] Nimmo, F. & Mackwell, S., PNAS (2023).

How to cite: Yang, X., Gerya, T., and Gülcher, A.: Wide rift flank uplifts suggest active rifting on Venus, Europlanet Science Congress 2026, The Hague, The Netherlands, 7–11 Sep 2026, EPSC2026-201, https://doi.org/10.5194/epsc2026-201, 2026.

14:36–14:48
|
EPSC2026-377
|
ECP
|
On-site presentation
Davide Sulcanese, Giuseppe Mitri, Camilla Cioria, Edoardo Santero Mormile, Mafalda Ianiri, Suzanne E. Smrekar, and Scott Hensley

Introduction

Venus does not show an unambiguous global network of plate boundaries, yet its surface preserves widespread evidence for tectonic deformation, volcanism, and possible lithospheric mobility. Recent work has suggested that parts of the Venusian lowlands may be divided into relatively coherent crustal blocks, or campi, bounded by deformation belts and tectonically disrupted margins¹. Such domains may be compatible with localized lithospheric mobility within a stagnant-lid or plutonic-squishy-lid planet, without requiring Earth-like plate tectonics². Here we investigate a tectonically complex lowland domain in Vinmara Planitia, previously identified as part of a Venusian campus¹, to assess whether its structural architecture is consistent with localized boundary-like deformation and strain partitioning.

Data and approach

We analyzed Magellan Synthetic Aperture Radar images, radar altimetry, gravity, microwave emissivity, and meter-scale roughness data across three tectonic sectors of the Vinmara domain: the contractional ridge belt of Ahsonnutli Dorsa, the extensional groove belt of Surupa Dorsa, and a faulted tessera terrain located southwest of Ahsonnutli Dorsa. SAR and altimetry data were used for structural mapping and topographic analysis³. Gravity data were derived from the Magellan gravity field, truncated to the reliable degree strength of the study region⁴, while emissivity and roughness data were used as ancillary constraints on the surface properties of Surupa Dorsa⁵,⁶. Topographic profiles across Ahsonnutli Dorsa were compared with a two-dimensional elastic flexure model to evaluate whether the long-wavelength relief is compatible with lithospheric bending⁷. In the tessera terrain, piercing points and structural markers were restored across fault zones to estimate lateral displacements. The resulting fault geometries were then compared with a first-order Euler-pole reconstruction⁸ to evaluate whether contraction, extension, and lateral displacement can be described as part of the same kinematic system.

General interpretation

The main result of this study is that deformation within the Vinmara domain is spatially organized. Ahsonnutli Dorsa forms a narrow, slightly arcuate contractional belt, Surupa Dorsa forms a broad extensional groove belt, and the southwestern tessera terrain records measurable lateral displacement along west-southwest to east-northeast trending faults. Restoring matched markers across four sectors of the tessera terrain yields offsets of 1.8 to 4.2 km, with a mean displacement of about 2.8 km and a cumulative displacement of approximately 11.3 km. All restored displacement vectors indicate a coherent northeastward sense of motion. Together, these observations suggest that deformation was partitioned along different margins of a relatively coherent crustal block.

A first-order Euler-pole reconstruction is consistent with this interpretation. The mapped tessera-cutting faults are compatible with transform-like motion, Surupa Dorsa is oriented approximately as an extensional boundary, and Ahsonnutli Dorsa occupies the contractional side of the inferred system. This configuration does not imply Earth-like plate tectonics on Venus. Rather, it suggests that localized lithospheric mobility may occur within a planet that lacks a global plate-boundary network.

End-member geodynamic scenarios

Within this kinematic interpretation, Ahsonnutli Dorsa and Surupa Dorsa can be evaluated through more specific end-member scenarios. Ahsonnutli Dorsa is associated with thrust-related structures, a trench-like topographic low, a broad elevated sector to the west, flexure-compatible long-wavelength topography, and a volcanic trend located landward of the contractional front. Flexural modeling of six topographic profiles reproduces the broad observed relief, with an average coefficient of determination of 0.86 and effective elastic thickness values of about 0.8 to 8.8 km. These observations are consistent with an end-member underthrusting or subduction-like interpretation, although they do not uniquely demonstrate subduction.

Surupa Dorsa is characterized by extensional faulting, an elongated axial topographic high, local syn-belt volcanism, relatively low Bouguer anomaly values where the belt broadens, and increased emissivity and meter-scale roughness along the groove system. This combination of observations is compatible with a focused tectono-magmatic extensional system and supports a spreading-like end-member interpretation. However, as for Ahsonnutli Dorsa, this interpretation remains non-unique because of the spatial resolution limits of the available Magellan datasets.

Implications

The Vinmara domain indicates that some Venusian lowland blocks may have undergone localized relative motion accompanied by contraction, extension, and lateral displacement. The results do not require a global plate tectonic regime, but they show that boundary-like deformation may develop locally within the Venusian lithosphere. Future VERITAS and EnVision observations will provide higher-resolution topography, radar imaging, gravity, interferometric measurements, and compositional data with which to reassess the origin, timing, and possible activity of structures such as those in Vinmara Planitia⁹,¹⁰.

Acknowledgments

G.M., D.S  acknowledge support from the Italian Space Agency (Grant No. 2022-15-HH.0). 

References

  • Byrne et al. 2021, PNAS, 118, e2025919118.
  • Lourenço et al. 2020, Geochem. Geophys. Geosyst., 21, e2019GC008756.
  • Ford 1993, Guide to Magellan Image Interpretation, NASA.
  • Konopliv et al. 1999, Icarus, 139, 3-18.
  • Pettengill et al. 1992, JGR Planets, 97, 13091-13102.
  • Robinson and Wood 1993, Icarus, 102, 26-39.
  • O’Rourke and Smrekar 2018, JGR Planets, 123, 369-389.
  • McKenzie and Parker 1967, Nature, 216, 1276-1280.
  • Smrekar et al. 2022, IEEE Aerospace Conference, 1-20.
  • Ghail et al. 2021, VEXAG Meeting Abstracts.

How to cite: Sulcanese, D., Mitri, G., Cioria, C., Santero Mormile, E., Ianiri, M., Smrekar, S. E., and Hensley, S.: Strain partitioning and possible block-scale motion in Vinmara Planitia, Venus, Europlanet Science Congress 2026, The Hague, The Netherlands, 7–11 Sep 2026, EPSC2026-377, https://doi.org/10.5194/epsc2026-377, 2026.

14:48–15:00
|
EPSC2026-394
|
ECP
|
On-site presentation
Amisha Baiju, Sam Poppe, Tegan Havard, and Daniel Mège

Graben systems are elongated topographic depressions bounded by normal faults and are widespread across rocky planetary bodies in the Solar System. They are commonly interpreted as surface expressions of crustal extension driven by tectonic and/or magmatic stresses. Similar morphologies occur under very different mechanical, thermal, and tectonic conditions, while the limited ability to probe extraterrestrial subsurfaces restricts understanding direct links between surface observations and underlying processes. Despite individual studies, no updated consensus framework exists that harnesses the wealth of high-resolution optical and topographic data collected by recent planetary missions to reconcile these interpretations across the different environments. Interpretations, therefore, often rely on morphology combined with simplified analytical or numerical models.

We present a comparative synthesis of graben-like structures across Mars, Earth, the Moon, Venus, and Mercury, prioritizing observable surface characteristics and morphologies while critically assessing the extent to which subsurface processes can be inferred. Published analyses of remote sensing and topographic datasets are evaluated across planetary bodies that differ in gravity, lithospheric thickness, tectonic regime, magmatic activity, and surface modification.

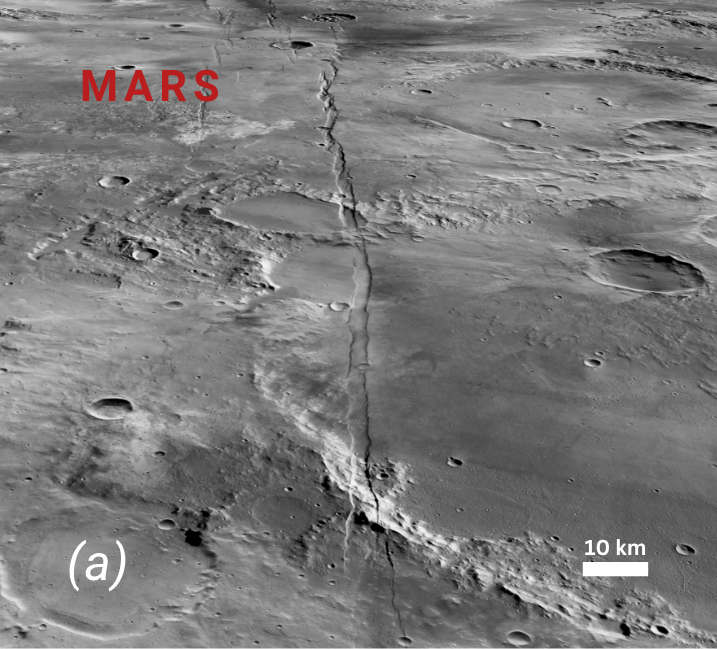
We identify systematic differences in graben scaling, fault spacing, and segmentation. Terrestrial grabens are typically small, segmented, and rapidly modified by erosion, whereas lunar grabens are narrow, shallow, and spatially restricted, commonly associated with basin loading and thermal contraction. Venusian grabens form extensive radial and concentric systems around volcanic rises, reflecting deformation dominated by lithospheric flexure. Martian grabens display the widest morphometric range, including large fault offsets, wide graben floors, and long fault continuity, likely facilitated by relatively low gravity, a thick lithosphere, and limited erosional modification.

These observations highlight the non-uniqueness of morphology-based interpretations. While a morphology-first framework provides a more consistent basis for classification, it also remains insufficient to uniquely constrain formation mechanisms, emphasizing the need for further observational and modelling studies.

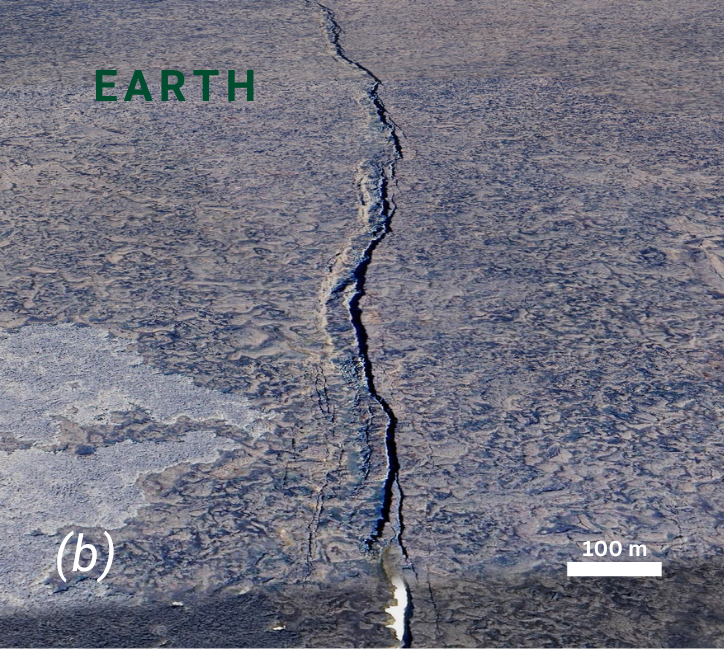
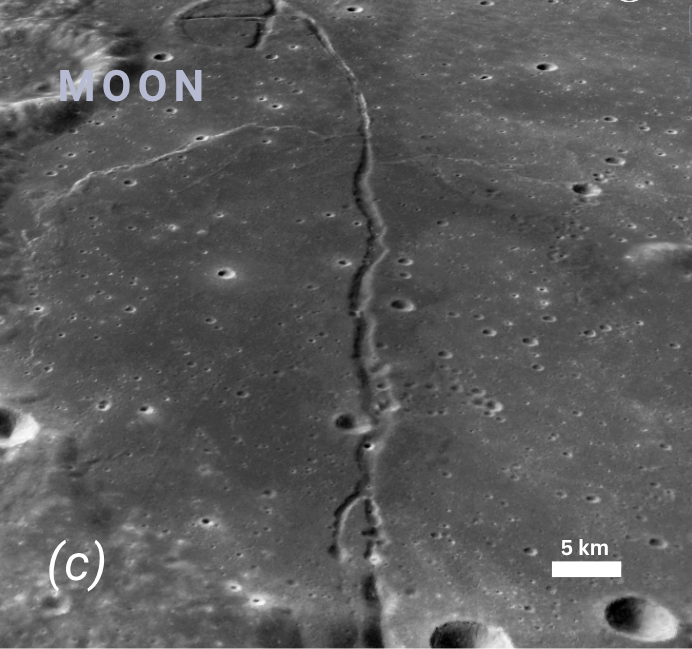
Fig.1: Graben and fracture systems across different planetary bodies - (a) Part of Sirenum Fossae Graben (MRO CTX Mars, NASA); (b) Part of the Sveinagj Graben system in Iceland (Google Earth); (c) Graben in the SW Mare Humorum (LROC, NASA); (d) Fatua Corona Graben (Venus Magellan, NASA) 

How to cite: Baiju, A., Poppe, S., Havard, T., and Mège, D.: Graben systems across the Inner Solar System: a Comparative Framework for their Morphology and Formation Mechanisms, Europlanet Science Congress 2026, The Hague, The Netherlands, 7–11 Sep 2026, EPSC2026-394, https://doi.org/10.5194/epsc2026-394, 2026.

15:00–15:12
|
EPSC2026-496
|
ECP
|
On-site presentation
Filippo Carboni

Planetary geology studies are mainly based on remote sensing data, among which Digital Elevation Models (DEMs) are fundamental to understand the geological evolution of planetary bodies. DEMs are used to analyze the morphological expression of geological surface features, among which compressional tectonic structures are fundamental to understand the interior of planets and their evolution. Their morphological expression are directly linked to geometry of subsurface faults, their depth and shortening using numerical and forward kinematic modelling [1]. However, the morphological expression is strongly dependent on the spatial resolution of the topographic data.

A systematic investigation to quantify how resolution and data type affect the comprehension of fault parameters and shortening is still missing. This work evaluates the effect of data resolution in the analysis of compressional ridges.

The analysis is based on remote sensing structural mapping, statistic and kinematic analysis of topographic profiles including line length combined with faulting linked to topographic offset and trishear (TS) combined with fault parallel flow (FPF) kinematic modelling. The analysis is carried out on Mars, selecting five different wrinkle ridges covered by MOLA ,HRSC, CTX and HiRISE data to guarantee a gradual increase of resolution from ~463 m/px, ~100 m/px, ~6 m/px to ~0.3 m/px, respectively.

The analysis is based on topographic profiles, equally spaced by 1–2 km (depending on the ridge length), orthogonally oriented to the mean direction of the tectonic structures (Fig. 1). Along each section, and per each DEM resolution, the ridge width and relief (WR and RR, respectively) are measured to define the ridge size based on a morphological harmonic index obtained from HiRISE data; a lower index represents a wide but low ridge or a high but narrow ridge; a higher index represents a wide and high ridge.

Fig. 1. The five selected study areas showing the topography through HiRISE data, along with the location and orientation of the topographic profiles.

Along each section and per each DEM resolution, the ridge line length (l0) and horizontal length (l1) are measured to obtain values of folding through the line length method in combination with faulting from the relation of elevation offset and assumed fault dip of 30° [2]. Along two representative selected topographic profiles per each study area and DEM resolution, the TS-FPF is applied to obtain values of shortening and depth to detachment [1].

The morphological and structural analysis results are integrated in a statistical analysis to characterize the differences between data resolutions of MOLA, HRSC, CTX respect to HiRISE data; the HiRISE analysis is assumed to give the best representation of the natural case. The analysis comprises the absolute and percentage difference (Bias), the coefficient of determination (R2) and the normalized root mean square deviation (NRMSE). Box-whisker plots are used to show the bias between different parameters.

The effect of resolution on the morphological analysis demonstrated how the MOLA, can generally approximate the overall ridge geometry, but underestimates down to 42% with emphasis on the relief. The HRSC can better resolve structures complexities but it is characterized by higher standard deviations. The CTX is resolves the majority of the morphological characteristics.

The effect of resolution on the structural analysis suggests how the methodology by [2] is subject to high deviations; it can lead to shortening overestimations up to 500% on MOLA and 250% on HRSC data. Its application on CTX data gives results comparable with HiRISE data. Kinematic forward modelling delivers reliable estimations of shortening and detachment depth when applied to CTX data and HRSC, at a lesser extent, while yielding less reliable results when applied to MOLA. The latter can underestimate or overestimate shortening up to -80% and 60%.

Spatial resolution affects the possibility to resolve objects of different sizes: bigger objects could be resolved also by lower resolution data, while smaller object might be hidden. The plots (Fig. 2a,b) show how the ridge size is handled by different spatial resolutions: while smaller structures (lower WRi) lead to more scattering solutions, bigger structures (higher WRi) can be more coherently characterized even by MOLA. The distribution of CTX data is concentrated around 0% deviation from HiRISE, the distribution of MOLA and HRSC data is strongly scattered in the left of the plot, while more concentrated around 0% in the right. A WRi of ~225m marks the shift from poorly resolvable sizes to relatively properly resolvable sized. Below  this threshold, only high resolution data can be considered reliable (e.g., CTX), while above it, even lower resolution data (i.e., MOLA and HRSC) can give overall reliable results.

Fig. 2. Plots showing the relationships between the morphological harmonic index WRi in respect to (a) the combined folding and faulting shortening, (b) the kinematic forward model slip and (c) depth to detachment.

The analyzed data differs in terms of acquisition methods. MOLA is obtained through the interpolation of sampling points acquired along a subpolar orbit with N-S point separations of ~300m and E-W of ~1km, with a total elevation uncertainty of ± 3m; it tends to smooth out steep ridges. HRSC is created by processing two dedicated stereo channels acquired in a single pass with a ~20m vertical accuracy, being affected by artefacts displayed as spikes and lows. CTX and HiRISE requires the stereo processing of separate stereo images acquired at different times and emission angles, with a vertical accuracy of ~3–5m. They are dependent on illumination conditions and emission angles during acquisitions and might be affected by acquisition and processing noise.

[1] Carboni et al., 2025, Icarus 425, 116330. [2] Golombek et al., 1991, 21st LPSC 21, 679–693.

How to cite: Carboni, F.: Data Resolution on the Analysis of Planetary Compressional Structures, Europlanet Science Congress 2026, The Hague, The Netherlands, 7–11 Sep 2026, EPSC2026-496, https://doi.org/10.5194/epsc2026-496, 2026.

15:12–15:24
|
EPSC2026-234
|
ECP
|
On-site presentation
Sam Poppe, Tegan Havard, Claire E. Harnett, Amisha Baiju, and Daniel Mège

Grabens are found on planetary bodies across the inner Solar System. They are elongated topographic depressions bounded by normal faults and fracture systems, and they attest to extension induced by tectonic and magmatic stresses in the upper rocky crust. The intrusion of dykes – tabular, subvertical magma bodies – in the upper five kilometers of Earth´s crust can induce the formation of normal faults and graben systems in the overlying crustal rocks. Therefore, graben-and-fracture systems on Mars and other planetary bodies, observed in association with volcanic eruption products, have been inferred as often induced by dyke intrusions. These systems are one of the few surface features where we can interrogate current and past subsurface stress states of the upper planetary crust and understand magmato-tectonic processes that form and deform the rocks.

Geometric and analytical assumptions have been combined with fundamental principles of rock mechanics to model the relationship between observed graben-and-fracture system geometry at the surface and dyke geometry, orientation, and depth in the subsurface. The existing models mostly assume an elastic response of a homogeneous upper planetary crust to dyke-induced stresses, which overlooks observations at geological outcrops on Earth that evidence the role of mechanical host rock heterogeneities and dynamic fracturing during dyke propagation. The implications for the uncertainties of existing model results remain unclear.

Within the DAGGER project funded by the National Science Centre of Poland, we have therefore implemented dyke propagation simulations using the Discrete Element Method (DEM). The DEM allows for simulating large strain concentrations and dynamic fracturing in a particle-based assemblage that is unfeasible or ignored in other finite element or analytical methods (Cundall & Strack, 1979; Potyondy & Cundall, 2004). Using the two-dimensional particle flow code (2D PFC) of Itasca Consultants Ltd, we have systematically varied 1/ the host rock strength for representative crustal rocks (rhyolitic ignimbrites, sandstones, basaltic lava, and fine-grained granite); 2/ the gravitational acceleration of Mars and Earth; 3/ the depth of the dyke top below the surface. Our 2D DEM modelling results allow quantitative comparison of the displacements, strains, and stresses within the crust and at the surface induced by an opening dyke, and highlight the differences between the surface displacement and fracturing patterns that can be expected on Mars versus Earth.

Our approach will allow further comparison of the dyke propagation mechanisms on other planetary bodies and prepare for interpretations of graben-and-fracture system observations that are expected to improve drastically with upcoming orbital missions to Mercury, Venus, and the Moon. Our results will therefore contribute to a better understanding of magma propagation processes and the accumulating mechanical damage of the upper crust over time on extraterrestrial rocky planetary bodies.

References:

Cundall, P.A. and Strack, O.D., 1979. A discrete numerical model for granular assemblies. geotechnique, 29(1), pp.47-65.

Potyondy, D.O. and Cundall, P.A., 2004. A bonded-particle model for rock. International journal of rock mechanics and mining sciences, 41(8), pp.1329-1364.

How to cite: Poppe, S., Havard, T., Harnett, C. E., Baiju, A., and Mège, D.: Modelling of dyke-induced fracturing and faulting for understanding graben and fracture system development across the Inner Solar System, Europlanet Science Congress 2026, The Hague, The Netherlands, 7–11 Sep 2026, EPSC2026-234, https://doi.org/10.5194/epsc2026-234, 2026.

15:24–15:30

Posters: Thu, 10 Sep, 18:00–19:30 | Foyer 2

Display time: Thu, 10 Sep, 08:30–19:30
F2.36
|
EPSC2026-230
|
On-site presentation
Saihong Yang, Chunlai Li, Guangliang Zhang, and Qin Zhou

Introduction:  The lunar soil collected by the Chang'e-5 mission is mainly 2-billion-year-old mare basalt from the local area, and also contains a small amount of components from various other sources, such as the ejecting material from impact craters excavated beneath the landing site or near the lunar highlands (Qian et al., 2021a; Li et al., 2022). These ejecta provide valuable information on the composition of the lunar crust other than the Chang'e-5 mare basalt, providing important materials for understanding the complex evolutionary history of the lunar crust.

Samples and Methods: The clasts analyzed in this study are from the samples of CE-5 mission allocated by the China National Space Administration (CNSA). The petrography was carried out on a Zeiss Supra 55 field-emission scanning electron microscope (SEM) equipped with the energy dispersive spectroscopy (EDS) detector. The major element compositions were analyzed with a JEOL JXA8230 electron probe (EPMA). Structural characterizations of minerals were carried out using an EBSD detector installed on the Zeiss Supra 55 SEM.

Results: The clast bearing Cr-Zr-Ca armalcolite is composed of plagioclase, pyroxene, and minor minerals such as chromite, ilmenite, rutile, apatite, merrillite, iron sulfides, armalcolite, baddeleyite, silica, troilite and FeNi metal. The coarse-grained orthopyroxene and plagioclase coexist without showing any reaction structure. Other metal oxides and sulfides are distributed in the interstices.

The plagioclase has very calcic compositions with An content varying between 87.5 and 91.5. Pyroxene is mainly low-calcium pyroxene, with an average mineral composition of Wo3.5En68.8Fs27.7, and Mg# varies between 70.2 and 72.3. High-calcium pyroxene is present in very small amounts, with an average mineral composition of Wo45.1En43.7Fs11.1, and Mg# varies between 79.5 and 80.4, which is significantly higher than that of low-calcium pyroxene.

The “Cr-Zr-Ca armalcolite” grains contain 65.3~66.1 wt% TiO2, 1.6~1.7 wt% MgO, 10.5~10.6 wt% FeO, 9.8~9.9 wt% Cr2O3, 4.7~5.0 wt% ZrO2, and 2.8~3.1 wt% CaO, respectively. It also contains total REE up to 1.72 wt% (0.42~0.69 wt% La, 0.29~0.69 wt% Ce, 0.12~0.22 wt% Y, 0.06~0.22 wt% Dy, 0.06~0.22 wt% Er). The EBSD patterns of Cr-Za Ca armalcolite can only be indexed with the loveringite R3 structure with the mean angular deviations as low as 0.49.

Discuss: Based on 38 oxygen atoms, the chemical formula of Cr-Zr-Ca armalcolite is (Ca0.90Na0.03La0.06Ce0.06Dy0.01Y0.02)Σ1.08(Ti14.12Fe2.51Cr2.22Mg0.71Zr0.67Al0.40Mn0.04Si0.02)Σ20.69O38, which may be abbreviated as AM21O38. The EPMA and EBSD results in this study is consistent with loveringite, which is different from the orthorhombic Bbmm structure of Fe-Mg armalcolite (aggerty, 1973a; Zhang et al., 2020). It is identified as an important carrier of rare earth elements or should have derived from a REE-rich rock.

The types of armalcolite are closely related to the types of rocks and can indicate the genesis and source of rocks (Haggerty, 1973a). Cr-Zr-Ca armalcolite is usually associated with baddeleyite, rutile, ilmenite, chromite and other oxides, showing a relatively complex oxide association. However, the petrographic structure of the rock containing these minerals has not been clearly described and is generally considered to be related to non-mare high-alumina basalts (Haggerty, 1973a). The Cr-Zr-Ca armalcolite from the brecciated lunar meteorite Northwest Africa 8182 is also regarded as loveringite. The mafic silicate minerals from meteorite NWA 8182 (Zhang et al., 2020) and Allan Hills (ALH) A81005 (Treiman and Gross, 2015) have relatively high Mg# and are considered to be a new type of Mg-suite distinct from the Apollo samples. In our study, mineral compositions will fall between those of the fields defined by the Apollo Mg-suite in the classic diagram, where the An value of plagioclase is plotted against the Mg# of pyroxene. Combined with mineralogy and petrography, it clearly indicates that the clast is consistent with the norite in the Apollo samples. From the above, the appearance of loveringite are closely related to the types of rocks and can be used as an important indicator of Mg-suite rock with having a KREEP signature. The identification of this clast indicates that Chang'e-5 lunar soil samples contain Mg-suite rocks from the interior of PKT.


References: [1] Haggerty, S. E. (1973a) LPSC, 4,777. [2] Li, C.L., et al., (2022) NSR, 9. [3] Qian, Y.Q., et al., (2021) EPSL, 555. [4] Treiman, A. H. and Gross, J. (2015) AM, 100, 414-426. [5] Zhang, A. C., et al., (2022) AM, 105, 1021-1029.

How to cite: Yang, S., Li, C., Zhang, G., and Zhou, Q.: Mineralogical characteristics and their implications of the Cr-Zr-Ca armalcolite from the Chang'e-5 lunar soil sample, Europlanet Science Congress 2026, The Hague, The Netherlands, 7–11 Sep 2026, EPSC2026-230, https://doi.org/10.5194/epsc2026-230, 2026.

F2.37
|
EPSC2026-506
|
ECP
|
On-site presentation
Filippo Carboni

Introduction

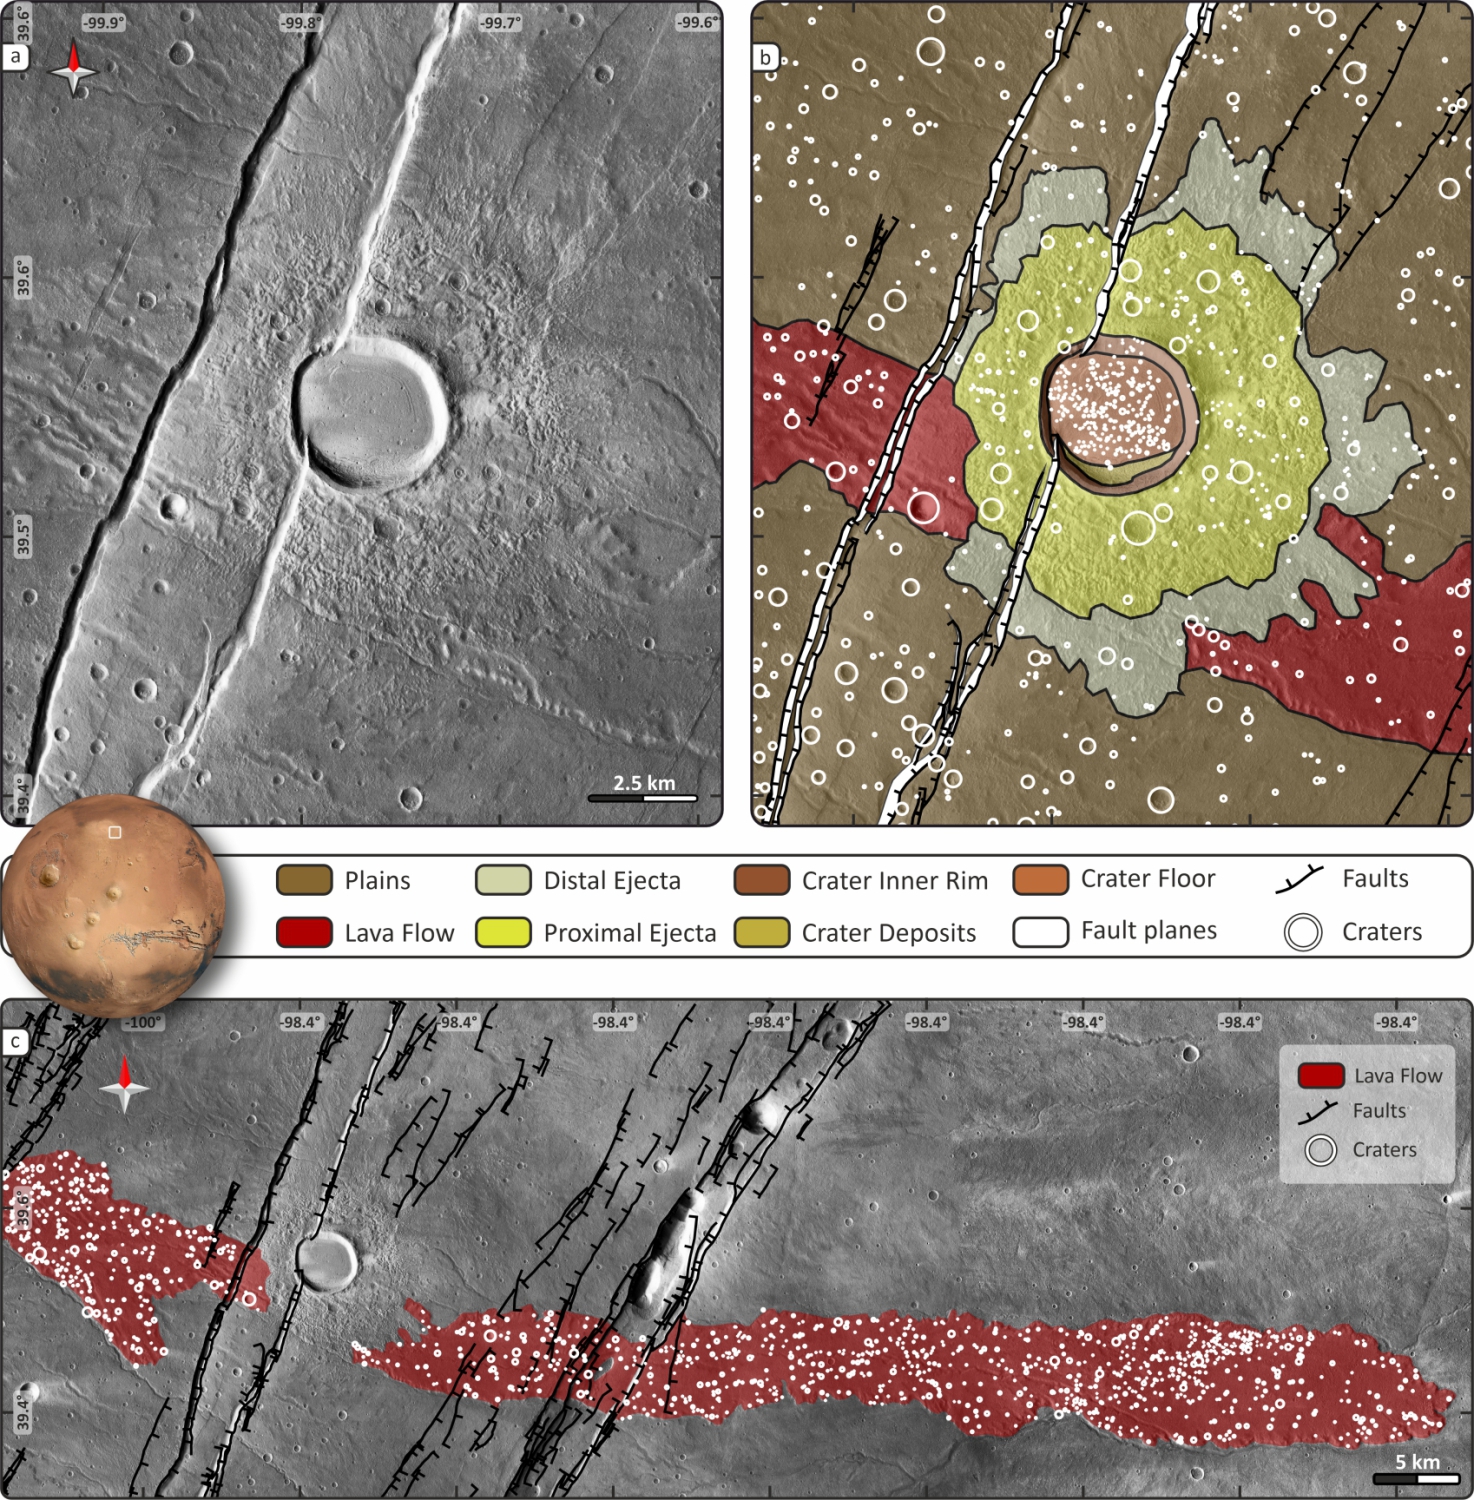
Alba Mons (AM) has been extensively studied in order to determine its geological evolution in relationships with the TVP and the geological processes driving its formation  [1]. Several dating attempts focussed on the relative dating of faults based on their cross-cutting relationships with different geological terrains, whose absolute age was inferred through cumulative crater counting [2]. 

However, an absolute fault dating (i.e. buffered crater counting of faults) and a clear stratigraphic constraints for the onset and termination of specific faults is still lacking. Such constraints allows to better determine not only the timing but also the kinematics and extensional rates associated with specific faults affecting AM. In this work, I select 1 emblematic area in the eastern side of AM (Fig.1), where structural and stratigraphic relationships between different geological features are evident and whose absolute ages can be inferred through cumulative and buffered crater counting techniques. Following the absolute dating I carry out a fault analysis to determine kinematic parameters and depth of faulting.

Fig.1. Map view of the crater object of this study (a), its geological map (b) and the total extent of the dated lava flow (c).

Data and Methods

Structural mapping was performed at 1:40.000 scale over 2 Global Context Camara (CTX) tiles from the V01 CTX mosaic [3], merged and centred at N40° W100° to remove any projection distortion. One pair of High-resolution CTX (~6 m/px) [4] was processed to obtain Digital Elevation Models (DEMs). Both the DEMs and derived orthoimages were imported into MoveTM software to build a 3D model aimed at characterizing the faults kinematic characteristics taking into account visible resurfacing.

The OpenCraterTool for QGIS [5], was used to map all visible craters through a conventional Crater Counting (CCC) method and Buffered Crater Counting (BCC) simple approach. To determine the proper buffer areas for the BCC analysis, the CSFD Tool software [6] was used. The cumulative size frequency distribution of the counted impact craters, per each mapped area and fault system, including their statistical and randomness analysis, was performed using the CraterStats software [7]. This work relies on the combination of production and chronology functions derived from [8] and [9].

Results and discussion

The results show a very good agreement, within dating errors, between the relative dating based on cross-cutting relationship (Fig. 2) and the absolute dating of faults based on the buffered crater counting (Fig. 3).

Fig.2. Absolute dating of stratigraphic succession mapped in the study area, including surrounding plains, lava flow, crater ejecta deposits and crater floor deposits.

In particular, the plains surrounding the crater have an age of 3.4 Ga (+0.3, -0.1), the lava flow is dated 1.4 Ga (± 0.1), the crater ejecta are dated 350 Ma (± 50) and the crater floor is dated 290 Ma (± 20). Considering that the faults clearly cuts the crater but not the crater floor, which clearly appears to seal the fault due to crater floor  resurfacing (i.e., infilling), the fault time of activity should be constrained between the ejecta age (i.e., impact time) and the crater infilling. The absolute dating of the graben system, analysed for a total length of ~170 km, gives an age of 320 Ma (± 40), which is in perfect agreement.

Fig.3. Absolute dating of the graben system cutting the crater.

However, the obtained age of faulting can either represent a single or the last of multiple stages of deformation. In the latter case, the fault pre-dates the crater, which is subsequently deformed during the latest activation; if so, the fault displacement should be higher away from the crater and lower in correspondence of the dislocated crater rims. Although the rims are visibly eroded at the fault hanging-wall, the along fault displacement analysis can be still considered representative. The kinematic analysis (Fig. 4) reveals that the displacement accrued by the faults looks to be constant, suggesting a single stage of relatively fast activation of the fault.


Fig.4. kinematic analysis of the fault showing the along-strike throw variation

References

 [1] Ivanov & Head, 2006, https://doi.org/10.1029/2005JE002469. [2] Krishnan & Kumar, P. S., 2023, https://doi.org/10.1029/2022JE007511. [3] Dickson et al., 2024, https://doi.org/10.1029/2024EA003555. [4] Malin et al., 2007, https://doi.org/10.1029/ 2006JE002808. [5] Heyer, et al., 2023, https://doi.org/10.1016/j.pss.2023.105687. [6] Riedel et al., 2018, http://dx.doi.org/10.1002/2018EA000383, 2018. [7] Michael and Neukum, 2010, https://doi.org/10.1016/j.epsl.2009.12.041. [8] Ivanov, 2001, https://doi.org/10.1023/A:1011941121102. [9] Hartmann and Neukum, 2001, https://doi.org/10.1023/A:1011945222010.

How to cite: Carboni, F.: Extension at Alba Patera: Kinematics and Absolute Dating, Europlanet Science Congress 2026, The Hague, The Netherlands, 7–11 Sep 2026, EPSC2026-506, https://doi.org/10.5194/epsc2026-506, 2026.

F2.38
|
EPSC2026-545
|
ECP
|
On-site presentation
Arthur Briaud, Jürgen Oberst, Alexander Stark, Hauke Hussman, and Haifeng Xiao

Tidal deformation provides one of the most powerful observational probes of the deep interiors of rocky planets and moons. Measurements of tidal Love numbers are sensitive to internal density structure, the presence of liquid layers, mantle rigidity and viscosity, and the thermal state of planetary interiors. They have therefore become key observables for investigating the internal structure of terrestrial bodies such as Mercury and the Moon (Williams et al., 2014; Verma and Margot, 2016; Steinbrügge et al., 2018; Thor et al., 2021). Recent and upcoming spacecraft missions, including the BepiColombo mission, are expected to significantly improve the precision of tidal measurements, opening new perspectives for comparative tidal studies across rocky planetary bodies.

One-dimensional (1D), radially symmetric interior models have become a standard framework for interpreting tidal observables. These models enable efficient probabilistic investigations of planetary interiors and have successfully reproduced first-order tidal responses for bodies such as Mercury and the Moon. However, the interpretation of tidal measurements remains strongly dependent on assumptions regarding internal density structure, mantle rheology, temperature, and the possible presence of liquid or partially molten layers. As observational precision improves, lateral variations in crustal thickness, mantle temperature, rigidity, or viscosity may also become increasingly relevant for interpreting not only the amplitude of tidal Love numbers, but also the spatial patterns of tidal deformation.

Here, we present ongoing work aimed at developing a comparative framework for investigating tidal deformation across rocky planets and moons. This approach combines probabilistic interior modeling with frequency-dependent viscoelastic tidal calculations to explore how different rheological formulations influence tidal observables over a broad range of forcing periods. The objective is to assess how tidal measurements can be used to constrain not only the radial structure of planetary interiors, but also their thermal and rheological state.

We investigate the tidal response associated with Hookean elastic, Maxwell, Andrade, and Sundberg–Cooper rheologies for planetary interiors characterized by distinct thermal states and internal structures. Preliminary results indicate that while the real part of the Love numbers is primarily controlled by bulk radial structure and core size, the imaginary component and tidal quality factor exhibit strong sensitivity to mantle rheology and forcing frequency. In particular, Andrade and Sundberg–Cooper rheologies generate broader dissipation spectra than classical Maxwell models, suggesting that multi-frequency tidal observations may provide important constraints on the viscoelastic properties of planetary mantles. This is consistent with previous studies showing that anelastic and transient rheologies can significantly modify tidal dissipation relative to Maxwell models (Renaud and Henning, 2018; Walterová et al., 2023).

Comparative analyses of Mercury and the Moon further illustrate how forcing frequency, mantle viscosity, and core properties jointly control the amplitude and spectral behavior of tidal deformation. These results emphasize the importance of considering both rheological complexity and frequency dependence when interpreting tidal measurements from terrestrial bodies. Such a comparative approach is particularly relevant because different rocky bodies sample different tidal forcing periods, thermal states, and interior configurations, thereby offering complementary constraints on planetary evolution.

Future high-precision observations from planetary missions may therefore provide new opportunities to constrain not only the radial structure of rocky planets and moons, but also the physical state and long-term evolution of their interiors. In this context, comparative tidal geophysics provides a promising framework for linking geodetic observations, mantle rheology, and planetary evolution across terrestrial bodies.

References

Williams, J. G., Konopliv, A. S., Boggs, D. H., Park, R. S., Yuan, D. N., Lemoine, F. G., ... & Zuber, M. T. (2014). Lunar interior properties from the GRAIL mission. Journal of Geophysical Research: Planets119(7), 1546-1578.

Renaud, J. P., & Henning, W. G. (2018). Increased tidal dissipation using advanced rheological models: Implications for Io and tidally active exoplanets. The Astrophysical Journal857(2), 98.

Steinbrügge, G., Padovan, S., Hussmann, H., Steinke, T., Stark, A., & Oberst, J. (2018). Viscoelastic tides of Mercury and the determination of its inner core size. Journal of Geophysical Research: Planets123(10), 2760-2772.

Thor, R. N., Kallenbach, R., Christensen, U. R., Gläser, P., Stark, A., Steinbrügge, G., & Oberst, J. (2021). Determination of the lunar body tide from global laser altimetry data. Journal of Geodesy95(1), 4.

Verma, A. K., & Margot, J. L. (2016). Mercury's gravity, tides, and spin from MESSENGER radio science data. Journal of Geophysical Research: Planets121(9), 1627-1640.

Walterová, M., Běhounková, M., & Efroimsky, M. (2023). Is there a semi‐molten layer at the base of the lunar mantle?. Journal of Geophysical Research: Planets128(7), e2022JE007652.

How to cite: Briaud, A., Oberst, J., Stark, A., Hussman, H., and Xiao, H.: Comparative planetology: probing the interiors of rocky planets through tidal deformation, Europlanet Science Congress 2026, The Hague, The Netherlands, 7–11 Sep 2026, EPSC2026-545, https://doi.org/10.5194/epsc2026-545, 2026.

F2.39
|
EPSC2026-631
|
ECP
|
On-site presentation
Aleksandra Fronczak and Łucja Kuszyk

Ground deformation monitoring is a key tool for understanding volcanic processes, particularly in settings where in situ observations are limited or unavailable. This study presents a comparative analysis of surface deformation associated with major eruptive events at Mount Etna and Stromboli between 2019 and 2023 using InSAR-derived satellite data.

The primary objective is to evaluate whether documented eruptive events correspond to detectable ground motion and classify deformation patterns before, during and after these events. 

Eruptive events were selected based on records from the Smithsonian’s Global Volcanism Program, ensuring a reliable event catalogue.

The analysis is based on data obtained from the European Ground Motion Service (EGMS).


A set of measurement points located on and around both volcanoes was used to analyse how deformation changes in space and over time. For each eruptive event, time windows for pre-, syn- and post-eruptive stages were defined, allowing for comparative analysis of trends and amplitudes. In addition to event-based analysis, high-amplitude deformation anomalies were also identified and evaluated in terms of their correspondence with known eruptions. Sentinel-2 optical imagery supported the interpretation of surface changes.

Large-scale signals are well captured, while small or rapid processes may be missed or undersampled. Integrating InSAR time series with optical data improves interpretation and supports applications in planetary science for analysing surface deformation on other planetary bodies.


How to cite: Fronczak, A. and Kuszyk, Ł.:  EGMS-based comparative analysis of ground deformation before and after volcanic eruptions of Etna and Stromboli (2019-2023), Europlanet Science Congress 2026, The Hague, The Netherlands, 7–11 Sep 2026, EPSC2026-631, https://doi.org/10.5194/epsc2026-631, 2026.

F2.40
|
EPSC2026-732
|
ECP
|
On-site presentation
Fleur Seuren and Alexander Braun

Traditionally, numerical models describing the flow in the fluid cores of terrestrial planets have been developed under the assumption of a spherically symmetric background density. In practice, this means that density gradients produced by chemical and thermal effects are taken to vary only in the radial direction and not horizontally.

Seismic observations of Earth's lowermost mantle, along with the crustal dichotomy observed on the Moon and Mars, however, challenge this spherical symmetry assumption as these observations may be indicative of heterogeneous heat flux at the core-mantle boundary. Indeed, dynamo modelling studies have demonstrated that lateral variations in the heat flux across the core-mantle boundary can, assuming a sufficiently large amplitude, produce laterally varying regions of thermal stratification within the outermost part of the fluid core. These regions of local stratification, sometimes referred to as regional inversion lenses, may have important consequences for the hydromagnetic waves and other core flow processes that are used to interpret observations of planetary magnetic fields and rotation. Yet, despite this potential importance, the influence of laterally varying buoyancy on core dynamics remains largely unmodelled due to the absence of computational tools capable of systematically evaluating it.

To address this, we present a spectral method capable of studying fluid flow including both radial and lateral background buoyancy, which represents a step towards more realistic models of wave dynamics in terrestrial planets. We apply this approach to some well-known wave modes thought to be present in the Earth's core, and discuss the implications of regional stratification for their propagation and detectability. 

How to cite: Seuren, F. and Braun, A.: Computing the flow in regionally stratified cores of the terrestrial planets, Europlanet Science Congress 2026, The Hague, The Netherlands, 7–11 Sep 2026, EPSC2026-732, https://doi.org/10.5194/epsc2026-732, 2026.

F2.41
|
EPSC2026-1251
|
On-site presentation
Anhui Sun

Volcanoes play a crucial role in shaping the Earth's morphology through tectonic processes. Studying volcanic structure using imaging technologies, especially in the deep crust, is essential for gaining deep insights into the Earth's internal structure and geological history. However, conventional first-arrival-based seismic tomography often falls short in capturing fine deep crustal structural features, particularly in complex volcanic terrains, orogenic belts, and crust-mantle transition zones.

The limitations of primary P-waves and S-waves include the uneven spatial distribution of seismic stations, limited coverage of earthquake events, and, in particular, insufficient penetration depth of ray paths. These limitations hinder the reliable imaging of deep volcanic structures. Regional seismic later phases, such as Moho-reflected PmP waves, crustal reflected SmS waves, various crustal converted phases, and refracted waves, provide valuable information on the deep crustal structure, including the Moho discontinuity and uppermost mantle. These later phases undergo diverse medium response processes along different propagation paths, effectively compensating for the insufficient ray coverage and weak deep constraint capability of commonly used first-arrival data.

This study¹⁻⁵ presents an efficient integrated imaging method that combines primary seismic first arrivals and multi-type later phases extracted from dense regional seismic network observations and deep seismic sounding experiments. The approach involves:

1.Precise phase picking combining manual and automated techniques, and optimization of the traditional ray tracing algorithm for complex layered crustal media.
2.Hierarchical weight assignment rules formulated to assign weights to different seismic phases based on their reliability and sensitivity to subsurface structures.
3.Multi-parameter joint inversion constraints incorporating both velocity perturbation and seismic anisotropic characteristics into the inversion process.

Thus, our method effectively improves the identification capability of low-velocity anomalies in the mid-lower crust, depicts the spatial morphology and burial scale of deep magma storage chambers, and clearly traces the vertical extension trends of volcanic magma transport conduits. The inversion results reveal extensively distributed low-velocity anomalous zones that are genetically closely related to deep magmatic thermal activities and reveal directional crustal anisotropic characteristics formed under the joint control of long-term regional tectonic stress fields and continuous magma intrusion processes.

The later-phase data have been successfully applied in typical volcanic distribution areas and adjacent tectonic transition zones, such as those in Asia and Europe. This method can provide solid and reliable deep structural constraints for systematic research covering volcanic magmatic evolutionary history, regional continental dynamic evolution mechanisms, volcanic geological disaster early warning, and quantitative risk assessment.

The high-resolution crustal structure obtained through the later-phase joint imaging technique holds enormous interdisciplinary development potential. The quantitatively calculated crustal seismic wave velocity values, anisotropic fast velocity directions, and medium physical property parameters can be closely matched and systematically cross-analyzed with multiple types of geochemical research data as well. Thus, we can build an interdisciplinary research bridge connecting deep crustal geophysical exploration and surface geochemical mechanism analysis. Moreover, this bidirectional mutual verification and complementary interpretation mechanism can effectively help solve the multi-solution problem inherent in independent seismic structural interpretation, and also compensate for the inability of traditional geochemical research to constrain the deep spatial occurrence state of magmatic materials.

With stable technical performance and wide environmental adaptability, this improved method is expected to have broad cooperative application prospects in combination with volcanic geology, geochemistry, petrology, and other related disciplines.

References
1.Li, S., Sun, A., Li, T., Tong, P., Fang, L., An, Y., Zhang, Y., Zhao, P. & Yang, F. Constructing and training of a deep learning dataset for PmP waves in the southeastern Tibetan Plateau. Earth Sci. 51(3), 1169–1181 (2026). doi: 10.3799/dqkx.2025.128
2.Sun, A. & Zhao, D. Anisotropic tomography beneath Northeast Tibet: Evidence for regional crustal flow. Tectonics 39, e2020TC006161 (2020).
3.Sun, A., Zhao, D., Gao, Y., Tian, Q. & Liu, N. Crustal seismic imaging of Northeast Tibet using first and later phases of earthquakes and explosions. Geophys. J. Int. 217, 405–421 (2019).
4.Sun, A., Zhao, D., Ikeda, M., Chen, Y. & Chen, Q. Seismic imaging of southwest Japan using P and PmP data: Implications for arc magmatism and seismotectonics. Gondwana Res. 14, 535–542 (2008).
5.Zhao, D., Todo, S. & Lei, J. Local earthquake reflection tomography of the Landers aftershock area. Earth Planet. Sci. Lett. 235, 623–631 (2005).

How to cite: Sun, A.: Enhancing Deep Crustal Structure Imaging: An Efficient Seismic Tomography Method Combining First Arrivals and Later Phases, Europlanet Science Congress 2026, The Hague, The Netherlands, 7–11 Sep 2026, EPSC2026-1251, https://doi.org/10.5194/epsc2026-1251, 2026.