Multiple terms: term1 term2
red apples
returns results with all terms like:
Fructose levels in red and green apples
Precise match in quotes: "term1 term2"
"red apples"
returns results matching exactly like:
Anthocyanin biosynthesis in red apples
Exclude a term with -: term1 -term2
apples -red
returns results containing apples but not red:
Malic acid in green apples
hits for "" in
Network problems
Server timeout
Invalid search term
Too many requests
Empty search term
TP11
Following decades of limited exploration, Venus is once again in the spotlight of planetary exploration, with an exciting wave of missions set to transform our understanding of this enigmatic world. ESA's EnVision aims to explore Venus, uncovering clues about its geological history and activity, interior structure, atmospheric composition, and long-term climate evolution. Beyond EnVision, other planned space missions (DAVINCI+, VERITAS, Shukrayaan-1, CLOVE), as well as a diverse array of scientific activities, including ground-based observations, laboratory experiments, analogue studies, algorithm development and theoretical modeling are contributing to a comprehensive understanding of Venus, with a growing need for increasingly consistent coupling between processes and physical layers, from the core to the upper atmosphere.
We welcome contributions from all areas of Venus research, including interior processes, surface geology and geomorphology, atmospheric dynamics, laboratory simulations, and past mission data analysis. By bringing together diverse expertise, this session aims to enhance our understanding of Venus' history and current state, while exploring its broader implications for planetary evolution throughout the Solar System and beyond.
Envision is ESA’s next mission to Venus and was adopted in January 2024. Thales Alenia Space Itay (TAS-I) was awarded the contract to build the spacecraft in December 2024, initiating the mission implementation. The launch is scheduled for the early 2030s, and the start of the science operations at Venus is expected in mid 2030s, following the mission cruise and aerobraking phase around Venus to achieve a low Venus polar orbit.
The scientific objective of Envision is to provide a holistic view of the planet from its inner core to its upper atmosphere, studying the planets history, activity and climate. Envision aims to establish the nature and current state of Venus’ geological evolution and its relationship with the atmosphere. Envision’s overall science objectives are to: (i) characterize the sequence of events that formed the regional and global surface features of Venus, as well as the geodynamic framework that has controlled the release of internal heat over Venus history; (ii) determine how geologically active the planet is today; (iii) establish the interactions between the planet and its atmosphere at present and through time. Furthermore, Envision will look for evidence of past liquid water on its surface.
The nominal science phase of the mission will last six Venus cycles (~four Earth years), and ~210 Tbits of science data will be downlinked using a Ka-/X-band communication system. The science objectives will be addressed by five instruments and one experiment, provided by ESA member states and NASA. The NASA S-band Synthetic Aperture Radar contribution is, however, at the time of writing highly uncertain, and ESA is therefore investigating alternative European S-band SAR technologies for the targeted (repeat) surface imaging, polarimetric and stereo imaging, radiometry, and altimetry. The procurement of the high-frequency Subsurface Radar Sounder (SRS) is lead by ASI, and the instrument will perform novel sounding of the upper crust in search of material boundaries. The three spectrometers, VenSpec-U, VenSpec-H and VenSpec-M, operating in the UV and Near-IR, will map trace gases, search for volcanic gas plumes above and below the clouds, and map surface emissivity and composition. Their procurements are led by CNES, BELSPO and DLR. The Radio Science Experiment (RSE) will exploit the spacecraft Telemetry Tracking and Command (TT&C in Ka-/X bands) system to determine the planet’s gravity field and to sound the structure and composition of the middle atmosphere and cloud layer in radio occultation. Its science related procurement is led by CNES. All instruments have heritage and robust margins relative to the requirements for operations at Venus, and were chosen to meet the broad range of measurement requirements needed to support the Envision scientific objectives. The science teams will adopt an open data policy, with public release of the scientific data in the ESA Planetary Science Archive (PSA) after validation and verification. Public calibrated data availability is <6 months after data downlink.
ESA is starting a competitive Phase B1 for a European SAR instrument in summer 2026. In parallel, a European SAR Instrument Science Team is being appointed to support ESA and the Envision Science Working Team (SWT) for the European SAR design finalization. Furthermore, new SWT working groups have started to work on the scientific preparation of the mission in the areas of Venus surface Regions of Interest, Envision aerobraking science, Venus atmosphere science, Venus surface, subsurface and interior science, and Venus spin state science. In this presentation, the scientific objectives and the status will be provided, including an overview of on-going scientific activities in the working groups and beyond.
How to cite: Straume-Lindner, A. G. and Pacros, A. and the Envision Science Working Team (SWT) and SOC team: Envision Mission science activities and status, Europlanet Science Congress 2026, The Hague, The Netherlands, 7–11 Sep 2026, EPSC2026-613, https://doi.org/10.5194/epsc2026-613, 2026.
VenSpec is the spectroscopic payload suite of ESA’s EnVision mission to Venus and consists of three complementary instruments — VenSpec-U [1], VenSpec-H [2], and VenSpec-M [3] — coordinated through a common interface towards the spacecraft, the Central Control Unit (CCU) [4]. Together, the suite provides data spanning the surface, lower atmosphere, cloud deck, and mesosphere of Venus, enabling an integrated investigation of the coupled Venusian environment. This synergistic approach reflects the holistic scientific strategy of EnVision, which seeks to understand why Venus and Earth, despite their similar size and bulk composition, evolved along dramatically different pathways. By combining multi-wavelength spectroscopy with coordinated science investigations, VenSpec will address fundamental questions related to the geological and atmospheric evolution of Venus, the nature of present-day surface–atmosphere interactions, and the possibility of ongoing volcanic activity.
VenSpec is designed as a coordinated observatory rather than as three independent instruments. Its scientific concept is based on the recognition that understanding Venus requires linking processes occurring at different altitudes and spatial scales, from surface mineralogy and thermal anomalies to atmospheric chemistry, cloud variability, and mesospheric dynamics. The suite will therefore investigate Venus as an interconnected system in which geological, chemical, and dynamical processes interact over a broad range of temporal and spatial scales. Coordinated observations and data analysis across ultraviolet and near-infrared wavelengths will allow direct correlations between surface emissivity variations, volcanic gas tracers, cloud-top absorbers, atmospheric circulation, and trace gas variability, providing an unprecedented framework for studying the evolution and present activity of Venus.
The VenSpec suite instruments:
VenSpec-U is an ultraviolet spectral imager operating between 190 and 380 nm at both low and high spectral resolution. It is optimized to investigate the composition and dynamics of the upper atmosphere and cloud tops, including monitoring sulfur-bearing species, cloud properties, and the still unidentified ultraviolet absorber.
VenSpec-H is a high-resolution near-infrared spectrometer covering four spectral bands between 1.16 and 2.48 μm. It targets key atmospheric species within the troposphere and mesosphere, including SO₂, H₂O, HDO, CO, OCS, and HCl, providing constraints on atmospheric chemistry, circulation, and vertical transport processes. Polarimetric filters are also included to characterize the mesospheric hazes.
VenSpec-M is a multispectral imaging spectrometer operating in 14 near-infrared channels between 0.79 and 1.51 μm. It exploits these narrow spectral windows to retrieve surface thermal emission through the dense Venusian atmosphere, enabling near-global mapping of surface emissivity, compositional variability, weathering state, and localized thermal anomalies potentially associated with active volcanism.
The three instruments are coordinated through the CCU, which provides harmonized operations, unified commanding, power switching and coherent data handling across the suite.
The VenSpec Suite consortium brings together all the engineering expertise required to design, develop, and build the instrument, ensuring that the development of its four units is fully driven by the scientific requirements.
Science objectives of the VenSpec suite:
The core scientific objectives of VenSpec focus on understanding the links between Venus’s surface, atmosphere, and climate evolution. One major goal is the search for signatures of ongoing volcanic activity through the combined detection of thermal anomalies, surface emissivity changes, and atmospheric gas variability. By coordinated monitoring both surface and atmospheric processes, VenSpec will investigate whether active volcanism is currently shaping the Venusian environment and contributing to the observed variability of sulfur-bearing species in the atmosphere. The suite will also characterize surface–atmosphere coupling processes by tracing volcanic plumes, chemical exchanges, and radiative interactions from the surface to the cloud tops.
Another major objective is the characterization of Venus’ atmospheric composition, chemistry, and dynamics. Coordinated observations across ultraviolet and infrared wavelengths will constrain the distribution and temporal variability of trace gases, cloud properties, aerosol, and atmospheric circulation patterns. These measurements will improve our understanding of the sulfur cycle and the mechanisms controlling the stability and evolution of the Venusian atmosphere. At the same time, observations of surface emissivity and alteration patterns will provide new constraints on crustal composition, weathering processes, resurfacing history, and the long-term geological evolution of Venus.
To maximize scientific return, the VenSpec consortium is organized as a fully integrated science and engineering team built around interdisciplinary working groups [5, 6, 7, 8, 9]. These groups combine expertise in radiative transfer, atmospheric chemistry, laboratory spectroscopy, climate modeling, surface studies, solar reference characterization, and coordinated ground-based observations. Their activities support the development of common atmospheric reference models, cross-channel retrieval strategies, laboratory spectral databases obtained under Venus-relevant conditions, and complementary Earth-based monitoring campaigns. Together, these interdisciplinary activities provide the observational, experimental, and theoretical foundation required for the coherent scientific exploitation of VenSpec data.
The integrated VenSpec science framework is essential for ensuring physically consistent interpretation of observations across all spectral channels and for maximizing synergy with the broader EnVision payload and science operations. By combining multi-wavelength observations with laboratory studies, atmospheric modeling, and coordinated operations planning, VenSpec will provide a comprehensive view of Venus as an active and evolving planetary system. The suite will therefore contribute not only to resolving long-standing questions regarding Venusian volcanism, atmospheric variability, and climate evolution, but also to improving our broader understanding of terrestrial planet evolution, planetary habitability, and the divergent evolutionary histories of Earth-like worlds.
References: [1] Marcq et al. (2025) EPSC-DPS2025-395; [2] Robert et al. (2026, this meeting); [3] Alemanno et al. (2025) EPSC-DPS2025-991; [4] Fitzner et al. (2024), SPIE Proc. 131440D. [5] Lasue et al. (2026, this meeting); [6] Aoki et al. (2026, this meeting); [7] Barraud et al. (2025), EPSC-DPS2025-1653; [8] Erwin et al., (2025), EPSC-DPS2025-1645; [9] Barraud et al. (2025), EPSC-DPS2025-1787.
How to cite: Alemanno, G., Robert, S., and Marcq, E. and the VenSpec Suite Team: VenSpec on the ESA EnVision mission: Advancing Integrated Surface and Atmospheric Science of Venus, Europlanet Science Congress 2026, The Hague, The Netherlands, 7–11 Sep 2026, EPSC2026-565, https://doi.org/10.5194/epsc2026-565, 2026.
VenSpec-H is the high-resolution infrared spectrometer of the ESA EnVision mission, dedicated to the investigation of the composition and dynamics of Venus’ atmosphere. In support of the Phase B2/iPDR activities, an end-to-end science performance assessment framework has been developed to evaluate the capability of the instrument to meet its science objectives under representative observing conditions.
The analysis combines high-resolution radiative transfer simulations, instrument-level modelling and retrieval simulations based on the Optimal Estimation Method (OEM). Atmospheric spectra are generated using the ASIMUT-ALVL radiative transfer and retrieval suite and processed through the VenSpec-H instrument simulator (VHIS), which accounts for the instrument spectral response, optical throughput and detector noise contributions.
The study investigates the radiometric and scientific performance of the instrument for both dayside and nightside observations across the different spectral bands. Key performance metrics include signal-to-noise ratio (SNR), retrieval uncertainties and information content diagnostics such as the Degrees of Freedom for Signal (DOFS). The analysis also explores the sensitivity of the retrieval performance to atmospheric conditions, radiance levels and instrument assumptions.
Special attention was given to the retrieval of isotopic species related to the water history of Venus. The results show that the capability to retrieve these weak atmospheric signals strongly depends on the atmospheric conditions and radiance levels. This demonstrates the importance of using realistic atmospheric scenarios and advanced retrieval diagnostics when assessing the scientific capabilities of future planetary missions.
The results indicate the overall capability of the current VenSpec-H design to achieve the targeted science performance under the considered reference scenarios. In addition, the study highlights the importance of end-to-end retrieval analyses and information-content diagnostics to properly interpret the retrieval capability for weak atmospheric species and varying observing conditions.
This work provides a consolidated framework for future performance analyses and establishes the basis for subsequent investigations involving broader atmospheric variability, refined instrument modelling and optimisation of the observing strategy.
The VenSpec-H experiment is led by the Royal Belgian Institute for Space Aeronomy (BIRA-IASB) with co-ILS teams from Switzerland (ETHZ), Portugal (IA), Spain (IAA), the Netherlands (SRON), and the Czech Republic (JHIPC). The project acknowledges funding by: the Belgian Science Policy Office (BELSPO) under PEA nº400012813 and nº4000144206; the Swiss Space office (SSO) under PEA nº4000138690, nº4000138246, and nº400013824; Fundação para a Ciência e a Tecnologia (FCT) through the research grant UID/04434/2025; the Spanish Space Agency (AEE) under grants PID2021-126365NB-C21 and PID2021-126365NA-C22; the Czech national funding under PEA nº4000147310 and Czech Science Foundation Project No. 24-12656K; and the European Space Agency (ESA) under the EnVision Project. Belgium, Switzerland, Portugal, and the Czech Republic acknowledge the financial and contractual coordination by the ESA Prodex Office.
How to cite: Robert, S., Erwin, J., Pereira, N., Thomas, I., Neefs, E., De Cock, R., Berkenbosch, S., Jacobs, L., Bogaert, P., Beeckman, B., and Vandaele, A. C. and the VenSpec-H Science Team: End-to-End Science Performance Assessment of the VenSpec-H Instrument for EnVision, Europlanet Science Congress 2026, The Hague, The Netherlands, 7–11 Sep 2026, EPSC2026-1103, https://doi.org/10.5194/epsc2026-1103, 2026.
ESA’s Envision mission is a holistic investigation of Venus’ interior, surface and atmosphere, aimed at improving our understanding of the geodynamic, geological and climatic history and activity of our nearest planetary neighbour. To achieve that, we need a series of complimentary observations at global, regional and local scales, from different instruments and in different modes, and repeated observations for change detection. Envision will carry an integrated instrument suite of spectrometers (VenSpec), a Subsurface Radar Sounder (SRS) and a Synthetic Aperture Radar (VenSAR) that will collect these data. This will be further complemented by gravity and radio occultation observations using the satellite communications system to Earth.
Whilst we would like to image the entire planet at high resolution using the SAR instrument, that is not feasible in the 6-sidereal-day nominal mission life, hence Envision’s imaging strategy is targeted: collecting nested, multi-modal images which will be used to answer its complex science questions. At least 20% of the surface of Venus will be imaged using the SAR at 30 m spatial resolution (twice and at different angles, for generation of stereo topography for at least 18% of the surface) with a smaller fraction imaged a third time (for change detection) or at dual-polarisation, and an even smaller fraction imaged at 10 m resolution for detailed geomorphological analysis. The stereo-derived topography and Envision’s near-global altimetry data will be vital to answer science questions involving Envision’s other instruments and for its holistic science investigations. Considering EnVision’s overall scientific objectives, as well as individual instrument goals, synergies, and limitations, the key question then becomes how we decide which areas should be imaged and in which modes?
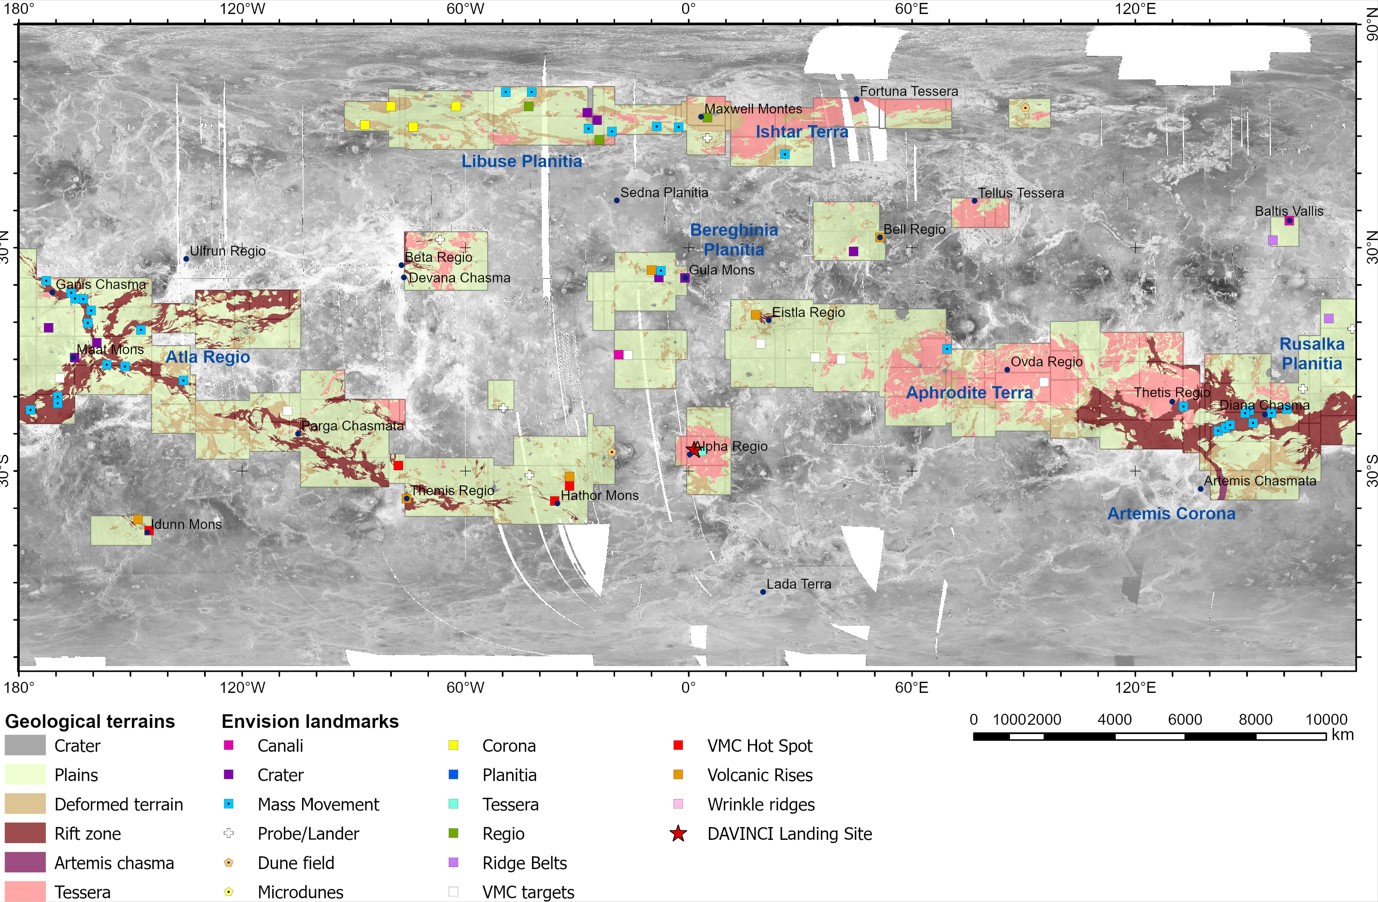
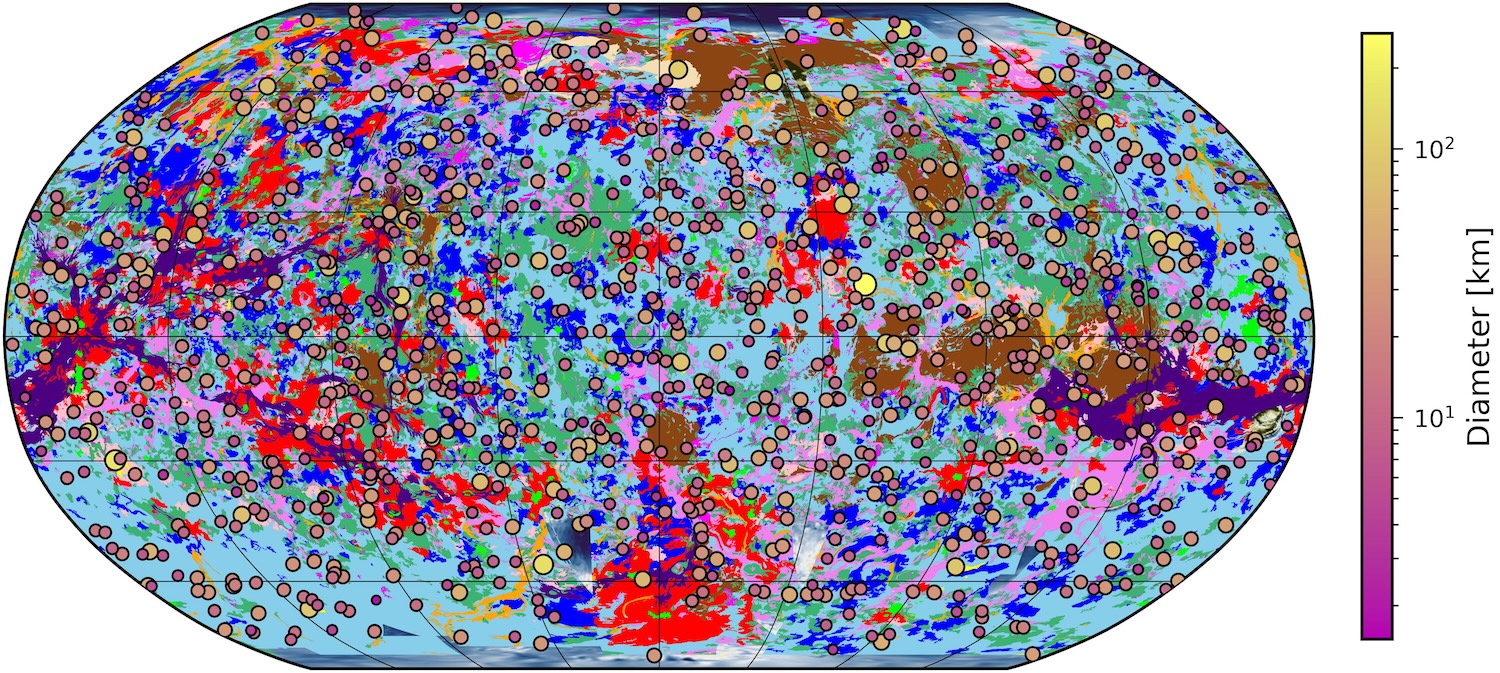
The Envision Science Working Team (SWT) formed an ROI Working Group (ROIWG), which was tasked with compiling a list of surface features on Venus, the imaging of which will help address the Envision Science Objectives. The list contains named and located features of interest, of all types (including, but not limited to, tectonic, volcanic, and impact features, and aeolian landforms), which was in turn used to construct Regions of Interest (ROIs), in a semi-automated, semi-objective way. It is anticipated that the imagery collected across the ROIs will capture a representative sample of its geological terrains and key features. These ROIs will thus form the basis of Envision’s SAR and radiometric imaging strategy and planning, as well as the strategy for the subsurface radar high density observations. Here we summarise the process and present an example of Envision’s ROIs (e.g. Figure 1) and how they will be used to optimize the scientific return of the EnVision mission. This target lists will be used by the Envision SWT to construct the mission Science Activity Plan for the Science Measurement Phase. In the future, as the mission advances, this target list will evolve, will be opened to community input, and will remain central to maximizing the value of synergistic, multi-instrument investigations of our sister planet.

Figure 1. Illustration of EnVision’s planned Regions of Interest (ROIs) as published in the Definition Study Report or Red Book (ESA-SCI-DIR-RP-00, European Space Agency, Nov 2023) with a selection of known target features as well as the geological terrains they would intersect, overlain on the global Magellan SAR image mosaic.
How to cite: Mason, P. J. and the Envision Science Working Team: Defining Envision’s Regions of Interest (ROI): from a community-led feature list to a targeted imaging strategy, Europlanet Science Congress 2026, The Hague, The Netherlands, 7–11 Sep 2026, EPSC2026-406, https://doi.org/10.5194/epsc2026-406, 2026.
Science
Venus and Earth share similar physical properties and likely formed through similar accretion mechanisms. Yet, the two planets followed very different evolutionary paths, leading to Venus being uninhabitable today, while Earth has remained habitable. Planetary atmospheres hold crucial clues about the geological and atmospheric evolution of a planet. Returning Venusian atmospheric samples to Earth for detailed analysis is crucial to understand why Earth and Venus evolved so differently. Furthermore, understanding the origin and evolution of our Solar System’s planetary atmospheres is key to studying exoplanets.
Noble gases in planetary atmospheres are unique tracers of the geological evolution of the planet as a whole. They carry the fingerprints of processes driving atmospheric composition, including the original supply of volatiles from the solar nebula, the delivery of volatiles by asteroids and comets, the escape rate of planetary atmospheres, the degassing of the interior through magmatic activity, and the timing of these processes throughout the planet’s history. Constraining these parameters is also essential for building consistent climate models of early Venus. However, the elemental and isotopic patterns of noble gases and other volatile elements such as C, N, S and O in Venus’ atmosphere are poorly known, representing a significant missing link in our understanding of Venus’ evolution [1]. Alongside NASA's upcoming DAVINCI in-situ measurements [2], a sample return mission will provide the unambiguous data required to answer long-standing questions about Venus’ origin and evolution. This is the primary objective of the Venus Atmospheric Sample Return (VATMOS-SR) mission.
Constraints
A key science requirement is collecting well-mixed atmospheric samples slightly below the homopause (~120 km at Venus, depending on latitude and solar time). Factoring in a two-scale-height safety margin, 110 km is the target altitude. To ensure sufficient volume for terrestrial laboratory measurements and redundancy, a minimum of two distinct cylinders must capture at least one liter (1000 cm3) of gas collected at an altitude of 110 km to conduct repeated measurements of all observables targeted by the mission. This estimate assumes a minimum atmospheric density [3], with only 50% of the gas sample used for immediate measurements, and 50% curated for future studies.
Additionally, sampling a planetary atmosphere at high speed (>10 km.s-1) induces an elemental and isotopic fractionation of volatile elements in the sampled gas due to differential diffusion of species through the strong compression layer. The speed of diffusion depends on species’ molecular weight. As a result, collected gas samples will present a mass-dependent elemental and isotopic fractionation relative to the starting composition. Fractionation during sampling can be accurately modeled using a Direct Simulation Monte Carlo (DSMC) method [4].
Skimming through even just the upper Venus atmosphere presents significant engineering challenges. A phase 0 study was recently conducted by CNES to support the science team in defining this innovative Venusian atmospheric sample return mission in the framework of the ESA F3 call. This phase 0 study involved the design of a novel interplanetary probe capable of withstanding the unique conditions of a double atmospheric entry: first into Venus's dense atmosphere and then back into Earth's.
Mission Design
A Vega-C launch vehicle injects the payload into an elliptical orbit with a periapsis altitude of approximately 1550 km. The payload consists of three elements: a propulsion module (similar to that of Lisa Pathfinder), a probe responsible for the Venus flyby and Earth return, and an Earth Return Capsule (ERC) to host atmospheric samples. After launch, the propulsion module raises the orbit perigee to about 30,000 km before separation. The probe then provides the remaining ΔV to escape Earth’s gravity and initiate the interplanetary transfer. Following a ballistic trajectory, the probe takes approximately four months to reach Venus. Designed as a free-return trajectory, the probe naturally returns to Earth after the Venus flyby, accounting and correcting for the deceleration induced by the Venusian atmosphere. The scientific sampling occurs at the minimum flyby altitude (periapsis), and trajectory correction maneuvers are performed on the outgoing leg of the Venus escape trajectory.
The magnitude of deceleration due to Venus atmospheric flyby is a major driver for the overall mission design. This deceleration is subject to two major uncertainties: atmospheric density (highly dependent on atmospheric modeling) and the minimum flyby altitude (which can deviate from the planned periapsis altitude). To ensure mission success, the probe must carry sufficient propellant to correct any ΔV discrepancies post-flyby. Using a statistical approach, a ΔV budget of 800 m/s was computed to cover 100% uncertainty in atmospheric deceleration estimates and 4 km uncertainty in flyby altitude. Following these corrections, the eight-month return trajectory to Earth is purely ballistic.
Finally, the probe’s design must account for the extreme Venusian atmospheric conditions, ensuring integrity during the high-speed sampling pass and during Earth's atmospheric re-entry. The thermal protection of the spacecraft uses silicon carbide (SiC) for the top of the Earth re-entry capsule, and carbon felt / phenolic resin (e.g., ASTERM or PICA) for the remaining surface of the spacecraft. During the vehicle’s <250-second transit through the Venusian atmosphere at altitudes below 200 km, aerothermal numerical simulations suggest a peak heating load of 1.6 to 1.8 MW/m2 at the nose of the vehicle. A layer of 80 mm of protective material for the nose is required to maintain internal surface temperatures below 400 K. Lower heating fluxes of 25 to 70 kW/m2 are estimated for the aft section, requiring less than 30mm of protective material.
Although VATMOS-SR was not selected for further development in the recent ESA F-call, the mission design presented in this study successfully demonstrates the technical feasibility of returning an atmospheric sample from Venus within one year.
[1] Avice et al. (2022), SSR, 10.1007/s11214-022-00929-9, [2] Garvin et al. (2022), PSJ, 10.3847/PSJ/ac63c2, [3] Mahieux et al. (2012), JGR Planets, 10.1029/2012JE004058, [4] Borner et al. (2025), Icarus, 10.1016/j.icarus.2025.116800
How to cite: Avice, G., Sotin, C., Lebonnois, S., Füri, E., Péron, S., Dumoulin, C., Mahieux, A., Breuer, D., Kleine, T., Usui, T., Parai, R., Trainer, M., Kohler, E., Rabinovitch, J., Betrand, J., and Francastel, A. and the CNES team: VATMOS-SR : A Venus atmospheric sample return mission, Europlanet Science Congress 2026, The Hague, The Netherlands, 7–11 Sep 2026, EPSC2026-862, https://doi.org/10.5194/epsc2026-862, 2026.
Introduction: In the early 2030s, NASA’s DAVINCI mission will capture unprecedented near-infrared descent imagery of the Alpha Regio tesserae on Venus. The Venus Descent Imager (VenDI), built by MSSS, is designed to acquire high-resolution optical data from ~21 km down to just 200–400 meters before touchdown [1]. This dataset will allow scientists to rigorously assess geological processes, chronological relationships, and end-member rock compositions. However, because the planetary science community currently lacks any high-resolution optical imagery of Venus, there is no existing analytical framework for interpreting these sub-cloud observations over complex volcanic landscapes.
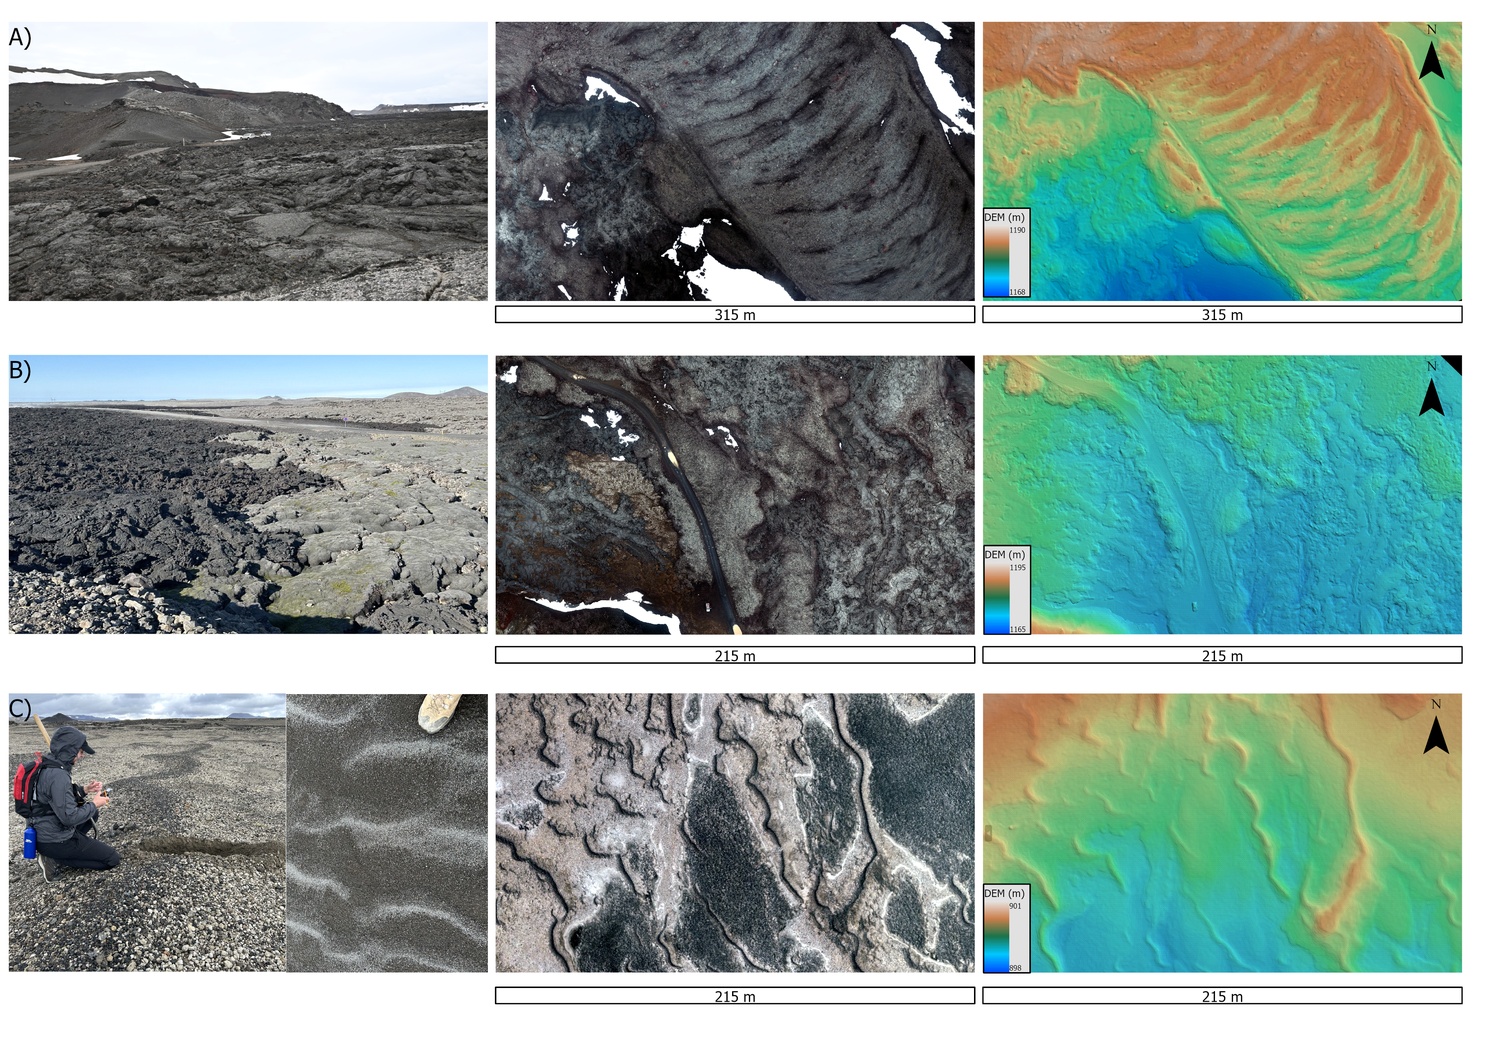
To bridge this critical gap and develop operational strategies for VenDI, we executed a comprehensive uncrewed aerial systems (UAS) campaign at the Sandfellshaed lava shield and other Reykjanes Peninsula sites in Iceland. By utilizing Structure-from-Motion (SfM) techniques to create high-resolution Digital Elevation Models (DEMs) and orthomosaics at centimeter to sub-centimeter scales [2, 3], these analog sites act as critical "training grounds." They provide the necessary ground-truth context to establish the spatial resolution limits required to recognize primary geologic features during DAVINCI's descent, ultimately maximizing the mission's scientific return.
Field Campaign Methodology: Over four days of active fieldwork, our team used UAS platforms to gather georeferenced images across approximately 1 km² of the Sandfellshaed shield and fresh Svartsengi lavas. Flight patterns were specifically engineered to simulate DAVINCI’s operational profiles: (1) broad terrain mapping at a 4 cm/pixel ground sample distance for regional DEM creation; (2) simulated descent trajectories from 120 m above ground level (the maximum permissible altitude) to mimic DAVINCI's approach angles; (3) Super-Low Altitude Mode (SLAM) traverses at 0.5–1 cm/pixel to capture sub-centimeter details, similar to the Curiosity rover's MARDI camera; and (4) highly targeted imaging of specific volcanic structures, such as radial lava flows, structural fractures, and the summit crater. We processed more than 800 overlapping image frames using both Agisoft Metashape and custom NASA SfM/BPS pipelines tailored for planetary science. This yielded multi-scale DEMs spanning from a 5 cm grid scale for regional maps down to sub-centimeter local patches derived from SLAM flights.
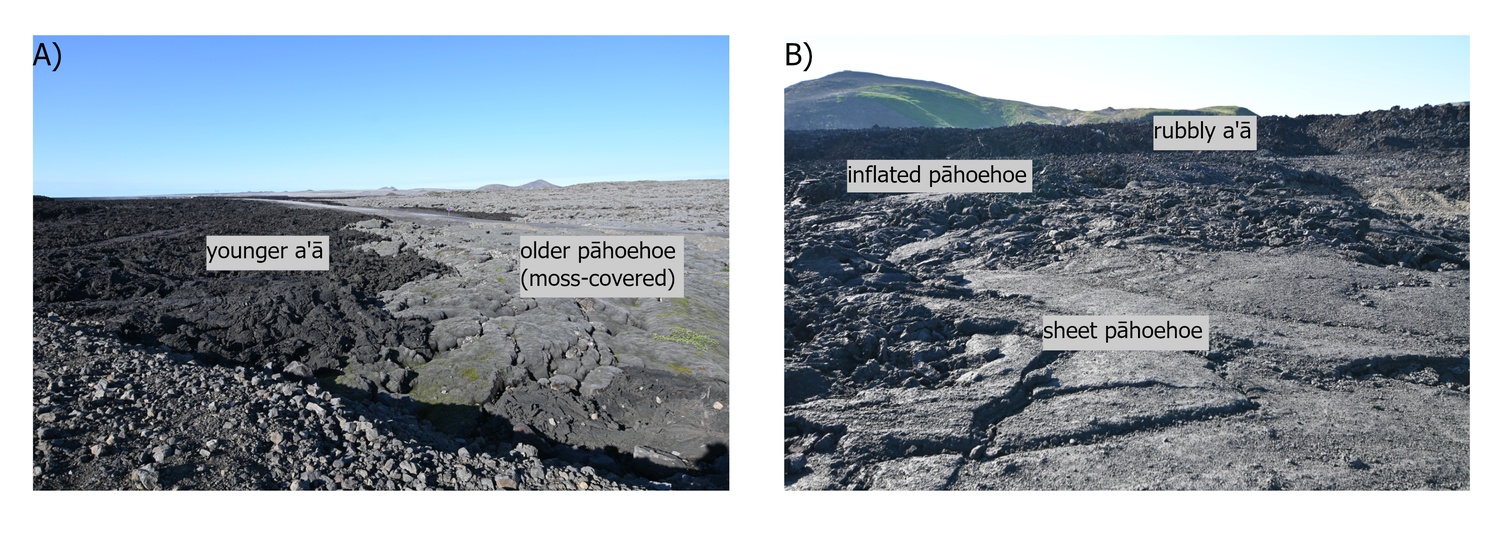
Venus Analog Justification: The monogenetic Sandfellshaed lava shield serves as a premier terrestrial counterpart to the valley-filling volcanics and structurally complex terrains anticipated within Alpha Regio at sub-meter scales. This basaltic shield displays multi-scale roughness, morphological features, and surface textures that closely match theoretical models and existing Magellan SAR observations of Venus. Featuring a mix of structural fissures (gja), rough volcanic flow textures, and smooth lava expanses, this location provided the ideal environment to determine the feature recognition thresholds and scale dependencies necessary for VenDI's mission objectives.
Initial Results and Data Products: The Icelandic deployment yielded crucial benchmark datasets, including flight telemetry, simulated descent sequences, and multi-scale topography. These products are vital for interpreting future Venusian surface data that cannot be resolved from orbit. Key deliverables include highly accurate DEMs covering the entire shield complex at a ~6 cm grid scale (Figure 1), ultra-high-resolution orthomosaics at 3.2 cm/pixel, and detailed surface property evaluations comparing satellite data with ground-truth measurements. We successfully established the precise spatial scales (centimeters to meters) required to discriminate various volcanic features. Furthermore, we demonstrated that fusing derived topography with orthorectified imagery will enable the identification of primary geological processes, directly fulfilling DAVINCI’s Level-1 science requirements for surface analysis.
Implications for Venus Exploration: The analog studies conducted in SW Iceland define the operational detection limits needed to identify specific volcanic surface properties during DAVINCI's descent. By bridging the massive resolution gap between orbital radar (such as the tens-of-meters resolution expected from ESA’s EnVision) and localized lander observations, this multi-scale approach generates essential "training data" for scientific interpretation and automated feature recognition algorithms (e.g., AI/LLM tools). Ultimately, these resulting datasets and methodologies will optimize VenDI's descent imaging strategy while establishing analytical protocols applicable to future comparative planetary studies across both Venus and Mars.
How to cite: Kohler, E., Garvin, J., Scheidt, S., Slayback, D., and Ravine, M.: Preparing for DAVINCI Through Multi-Scale Drone Reconnaissance of Icelandic Lava Shields, Europlanet Science Congress 2026, The Hague, The Netherlands, 7–11 Sep 2026, EPSC2026-65, https://doi.org/10.5194/epsc2026-65, 2026.
As our neighbouring world, Venus stands as a key planet in the study of planetary evolution. Its extreme climate and dense atmosphere composed of mainly carbon dioxide make it a unique environment for understanding atmospheric dynamics, not only within the solar system, but also beyond its boundaries. Among its most remarkable atmospheric features is superrotation, where zonal winds circulate far more rapidly than the planet’s rotation. Understanding the mechanisms that sustain this and other phenomena remains a challenge in planetary science, and atmospheric gravity waves are thought to play a role in shaping a planet’s atmospheric circulation.
Atmospheric gravity waves (AGW) are oscillations that propagate in stably stratified atmospheres, redistributing energy and momentum and influencing large-scale circulation patterns. In this study, we investigate wave activity in the upper cloud layer of Venus using ultraviolet images acquired by the Ultraviolet Imager (UVI) onboard the Akatsuki spacecraft. By applying contrast enhancement techniques and geometric corrections to a subset of the publicly available dataset, we identify and analyse wave packets across the dayside cloud tops. We then derive their morphological characteristics, including horizontal wavelength, packet length, width, and orientation, alongside dynamical parameters such as intrinsic phase velocity and vertical wavelength [2, 4]. These measurements are complemented by comparisons with independent measurements from thermal profiles obtained via Akatsuki’s radio occultation experiments [6], as well as earlier observations from Venus Express instruments [1, 3, 5].
Overall, this study provides the first comprehensive characterization of bow wave populations at Venus’s cloud tops using ultraviolet imaging. The findings offer new constraints on the properties and distribution of atmospheric gravity waves and contribute to ongoing efforts to clarify their possible role in maintaining Venusian superrotation.
[1] Peralta et al., Characterization of mesoscale gravity waves in the upper and lower clouds of
venus from vex-virtis images. Journal of Geophysical Research: Planets, 113(E5), 2008.
[2]Peralta, J., Imamura, T., Read, P.L., Luz, D., Piccialli, A., López-Valverde, M.A., 2014. Analytical solution for waves in planets with atmospheric superrotation. i. acoustic and inertia-gravity waves. Astrophys. J. Suppl. Ser. 213, 17.
[3] Piccialli et al., High latitude gravity waves at the venus cloud tops as observed by the venus
monitoring camera on board venus express. Icarus, 227:94 111, 01 2014.
[4] Silva et al., Characterising atmospheric gravity waves on the nightside lower clouds of Venus: a systematic analysis, AA 649 A34, 2021.
[5] Silva et al., Atmospheric gravity waves in Venus dayside clouds from VIRTIS-M images, Icarus, Volume 415, 2024, 116076, ISSN 0019-1035.
[6] Mori, R., Imamura, T., Ando, H., Häusler, B., Pätzold, M., Tellmann, S., 2021. Gravity wave packets in the venusian atmosphere observed by radio occultation experiments: Comparison with saturation theory.Journal of Geophysical Research: Planets 126.
How to cite: Espadinha, D., Machado, P., Peralta, J., Imamura, T., Silva, J., and Brasil, F.: Wave Packets at Venus’ Cloud Tops as seen by Akatsuki, Europlanet Science Congress 2026, The Hague, The Netherlands, 7–11 Sep 2026, EPSC2026-105, https://doi.org/10.5194/epsc2026-105, 2026.
Please decide on your access
Please use the buttons below to download the supplementary material or to visit the external website where the presentation is linked. Regarding the external link, please note that Copernicus Meetings cannot accept any liability for the content and the website you will visit.
Forward to presentation link
You are going to open an external link to the presentation as indicated by the authors. Copernicus Meetings cannot accept any liability for the content and the website you will visit.
We are sorry, but presentations are only available for conference attendees. Please register for the conference first. Thank you.
Atmospheric motions generate clouds and influence planetary climate systems. Venus, permanently shrouded by sulfuric acid clouds, provides a striking example. Unlike the photochemically produced upper clouds, the lower cloud layer is thought to form through condensation driven by poorly understood atmospheric dynamics. Observations by the Akatsuki spacecraft revealed a persistent, planetary-scale massive cloud cover in the lower cloud region, moving westward with a sharply defined leading edge about 6000 km long. This feature, unexpected from existing atmospheric models, raised fundamental questions about Venusian meteorology. Here, we show that the cloud front results from the largest hydraulic jump (bore) in the solar system. A planetary-scale Kelvin wave becomes unstable due to a background static stability structure, generating an updraft along the front that triggers sulfuric acid condensation. Numerical simulations reproduce the observed morphology, including fine undulations. This process is likely the origin of the lower cloud. The westward momentum carried by the Kelvin wave is transferred to the mean flow through the hydraulic jump, thereby contributing to the maintenance of the planet's fast atmospheric superrotation. The resulting clouds modify the static stability, further facilitating a hydraulic jump. This previously unrecognized coupling between clouds and atmospheric dynamics represents a fundamental process likely to operate across planetary atmospheres. (Imamura et al., JGR-Planets 131, e2026JE009672, 2026)
How to cite: Imamura, T., Maejima, Y., Sugiyama, K., Satoh, T., Peralta, J., McGouldrick, K., Horinouchi, T., and Ikeda, K.: A planetary-scale hydraulic jump driving Venus’ cloud front, Europlanet Science Congress 2026, The Hague, The Netherlands, 7–11 Sep 2026, EPSC2026-42, https://doi.org/10.5194/epsc2026-42, 2026.
Thermal tides dominate the dynamics of Venus’ middle atmosphere and are believed to play a major role in maintaining atmospheric superrotation. However, their global three-dimensional structure and associated circulation remain only partially constrained observationally. Previous studies have primarily characterized either temperature variability from radio occultations or horizontal winds near the cloud tops from cloud tracking, leaving the vertical coupling between thermal structure and atmospheric dynamics only partially resolved.
Here we analyze more than 1,000 radio-occultation profiles from Venus Express (2006–2014) and Akatsuki (2016–2024), spanning latitudes from 90°S to 90°N and altitudes between 40 and 95 km. Using the combined dataset, we reconstruct the temperature field as a function of latitude, altitude, and local solar time, and decompose it into diurnal and semidiurnal tidal components.
The reconstructed temperature field reveals a clear latitudinal transition in the dominant tidal regime: semidiurnal tides dominate at low latitudes, while diurnal tides become increasingly important toward mid and high latitudes. Vertical phase tilts indicate vertically propagating modes originating near the cloud region, consistent with thermal excitation within the main solar-heating layer.
Building on the observed thermal structure, we derive the associated three-dimensional tidal circulation using a dynamically consistent inversion based on the linearized momentum, continuity, and thermodynamic equations in the cyclostrophic regime. The diagnosed wind field reveals coherent zonal, meridional, and vertical tidal circulations. Zonal wind perturbations reach amplitudes of ~10–15 m/s, while vertical velocities are of order 0.1 m/s. Comparison with wind measurements near the cloud tops shows good agreement in both magnitude and large-scale structure.
These results provide a unified observational view of Venus thermal tides and new constraints on vertical coupling, wave propagation, and the dynamical structure of the Venusian atmosphere.
How to cite: Galanti, E., Navon, R., Imamura, T., Tellmann, S., Ando, H., and Kaspi, Y.: A three-dimensional view of Venus thermal tides from radio occultations, Europlanet Science Congress 2026, The Hague, The Netherlands, 7–11 Sep 2026, EPSC2026-321, https://doi.org/10.5194/epsc2026-321, 2026.
Waves of varying scales permeate the atmosphere of Venus, spanning a wide range of spatial dimensions and potentially playing a major role in the planet’s energy and momentum balance. Among these phenomena, small-scale temperature fluctuations—commonly attributed to gravity waves—are a ubiquitous feature of planetary atmospheres throughout the Solar System. Gravity waves are particularly important because they redistribute energy and momentum between atmospheric layers. Although such waves have been observed in the mesosphere and upper cloud deck of Venus, their precise contribution to maintaining the planet’s characteristic atmospheric superrotation remains unclear.
Between 2006 and 2014, the Venus Express mission conducted the Radio Science Experiment (VeRa) to investigate Venus’s neutral atmosphere and ionosphere using Earth occultation measurements. During these observations, radio signals transmitted at two coherent frequencies—X-band (8.4 GHz) and S-band (2.3 GHz)—passed behind the planet relative to Earth. The resulting measurements provided radial profiles of neutral particle density over an altitude range of approximately 40–90 km. Assuming hydrostatic equilibrium, these density profiles were subsequently used to derive vertical temperature and pressure profiles. In addition, reprocessed data from the Pioneer Venus Orbiter will be incorporated to extend the dataset.
The atmospheric profiles obtained from VeRa reveal substantial variability in the upper troposphere and mesosphere, reflecting the combined influence of atmospheric waves and turbulence. Importantly, VeRa possesses sufficient vertical resolution to detect fine-scale temperature perturbations associated with internal gravity waves, characterized by vertical wavelengths of only a few kilometers.
The high vertical resolution of the VeRa temperature measurements enables the investigation of subtle atmospheric fluctuations, which are crucial for improving our understanding of Venus’s still poorly constrained energy and momentum budgets.
To better characterize the observed wave structures, we apply standard gravity wave theory to analyze their vertical and horizontal properties as functions of latitude, altitude, and local time. Their relationship with thermal tides is also examined in order to assess the role of gravity waves in sustaining Venusian superrotation.
How to cite: Tellmann, S., Oschlisniok, J., and Pätzold, M.: Small-scale gravity waves in the Venus Atmosphere as seen by Radio Occultation Experiments, Europlanet Science Congress 2026, The Hague, The Netherlands, 7–11 Sep 2026, EPSC2026-845, https://doi.org/10.5194/epsc2026-845, 2026.
1. Introduction
In this study, we analyse Venus zonal winds derived under the cyclostrophic approximation using the complete temperature sounding datasets from the VeRa [1,2] and VIRTIS [3,4,5] instruments onboard Venus Express. We compare winds retrieved from these complementary temperature sounding techniques, using two wind retrieval methods, and cross-validate the results against cloud-tracked and ground-based wind observations.
2. Mesosphere dynamics
As a slowly rotating planet, Venus mesospheric circulation is largely governed by the cyclostrophic regime, in which the zonal winds can be reconstructed from the temperature field through the thermal wind equation [6]. In addition to the zonal super-rotation, which extends from the surface to the lower mesosphere and reaches maximus speeds near the cloud tops (~70 km), the mesosphere is characterized by a strong variability both on day-to-day as well as longer timescales, and the presence of wave motions that are thought to contribute to the maintenance of the atmospheric circulation [7].
3. Temperature retrievals
The thermal structure of Venus mesosphere was investigated by two complementary experiments on board Venus Express: VIRTIS (Visible and Infrared Thermal Imaging Spectrometer) and VeRa (Radio Science Experiment). The VIRTIS-M dataset spans December 2006 to January 2010 (orbits #23 to #843) and includes nightside observations between 65 and 86 km (100 – 1 mbar). Temperatures were retrieved on 67 pressure levels, with hundreds to thousands of profiles per orbit [4,5].
VeRa provided broader temporal and vertical coverage from July 2006 to January 2014, delivering more than 900 temperature profiles on both day- and nightsides between 45 and 90 km with a vertical resolution of 500 m. In addition, VeRa retrieved vertical pressure profiles [1,2]. Both instruments mainly sampled the Southern Hemisphere, with fewer observations in the Northern Hemisphere due to orbital constraints.
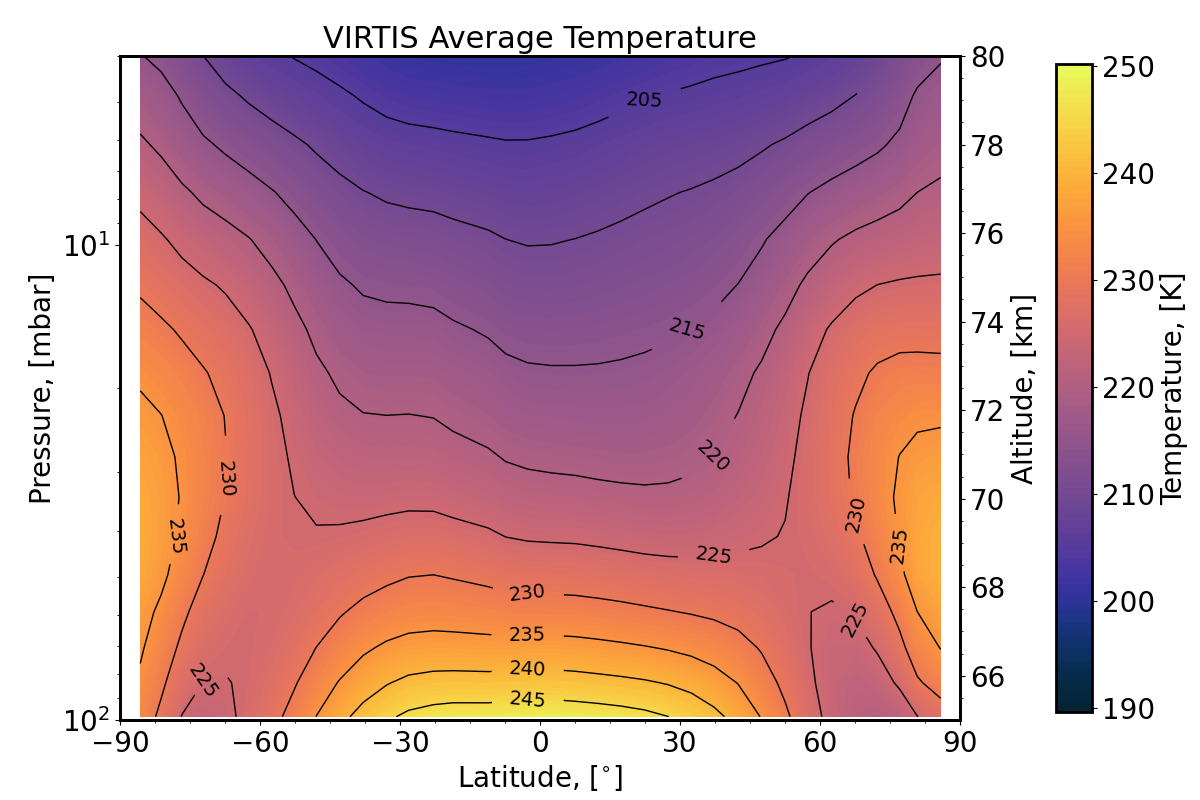
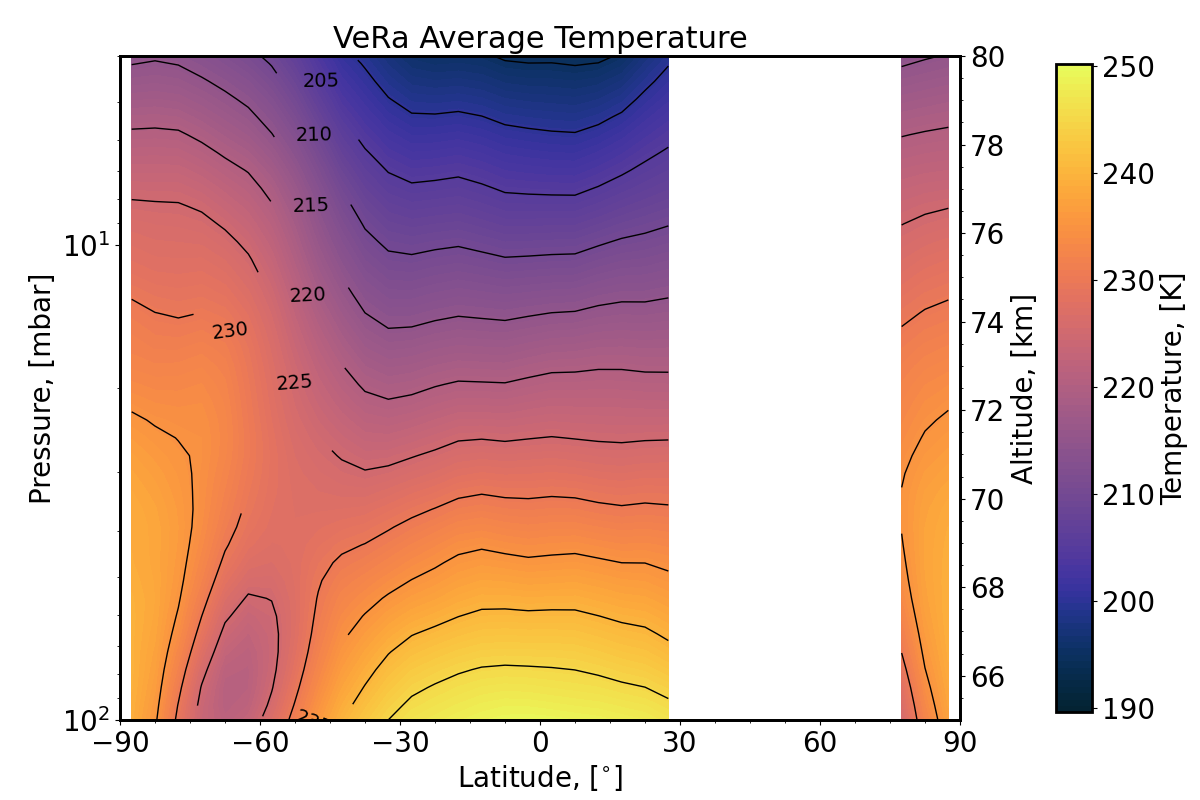
Figure 1 shows the latitude-altitude temperature fields for both datasets. Both experiments reveal a consistent thermal structure, including a pronounced temperature inversion (cold collar) poleward of 60°. Above 75 km (≈20 mbar), temperatures generally increase toward the pole.


Figure 1: (Left) Temperature cross-section obtained combining the whole VIRTIS-M dataset. The data was acquired between 14 May 2006 and 15 August 2008 (orbits 23-843). (Right) Temperature cross-section obtained combining all VeRa observations. The data was acquired between July 2006 and January 2014.
4. Zonal Wind Structure
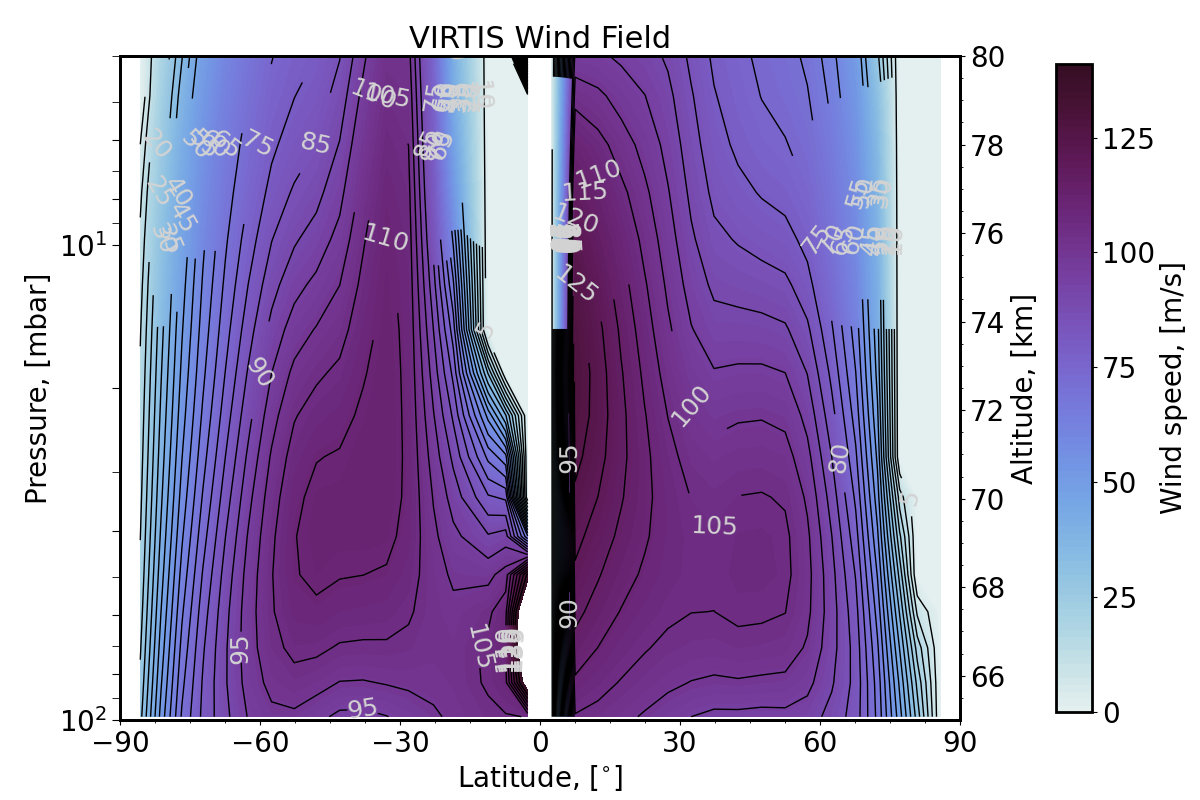
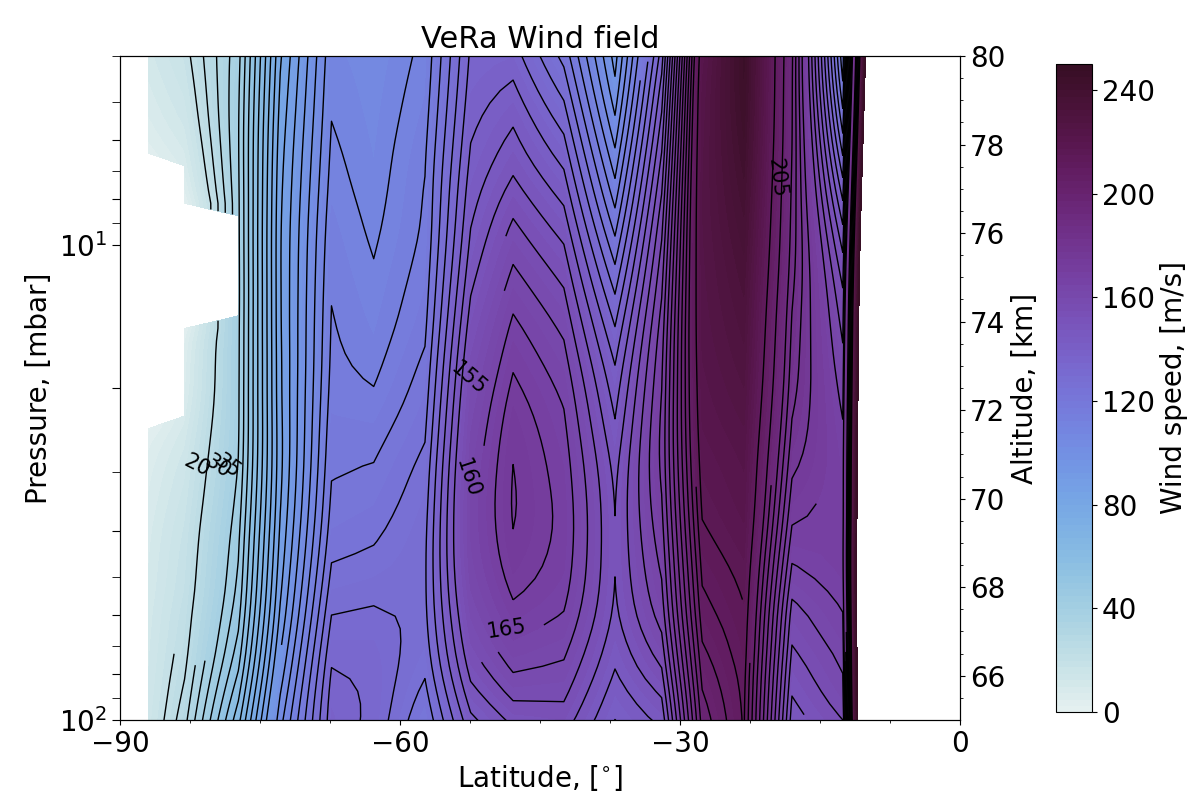
Zonal thermal winds were derived from VIRTIS and VeRa temperature soundings using the thermal wind equation [8,9]. The retrieved circulation shows: (1) a midlatitude jet between 30° and 60° latitude, peaking at 110-160 m/s near 40 mbar; (2) a rapid decrease in wind speed poleward of 60°; and (3) decreasing wind speeds with altitude above the jet.
Figure 2 shows zonal wind cross-sections derived from the VIRTIS (left) and VeRa (right) temperature fields. Both datasets reveal similar circulation patterns, although VeRa derived jet reaches higher velocities (>160 m/s). As discussed in [9], these differences may result from the different temperature sounding techniques.
Future work includes comparisons with cloud-tracked and ground-based winds, and the application to VeRa data of an alternative retrieval method based on the meridional slope of pressure surfaces, which, unlike the VIRTIS wind retrievals, does not require a lower boundary condition.


Figure 2: Zonal wind cross-sections obtained from: (Left) VIRTIS temperature field, and (Right) VeRa temperature field.
References
[1] Tellmann, S., et al., J. Geophys. Res., 114, E00B36, doi:10.1029/2008JE003204.
[2] Tellmann, S. et al., Icarus, doi:10.1016/j.icarus.2012.08.023
[3] Drossart, P. et al. (2007) PSS, 55:1653–1672
[4] Grassi D. et al. (2008) JGR., 113, 2, E00B09.
[5] Migliorini, A. et al. (2012) Icarus 217, 640–647.
[6] Newman, M. et al. (1984) J. Atmos. Sci., 41, 1901-1913.
[7] Sanchez-Lavega, A. et al. (2017) Space Science Reviews, Volume 212, Issue 3-4, pp. 1541-1616.
[8] Piccialli A. et al. (2008) JGR, 113,2, E00B11.
[9] Piccialli A. et al. (2012) Icarus, 217, 669–681
How to cite: Piccialli, A., Tellmann, S., Grassi, D., Migliorini, A., Piccioni, G., Pätzold, M., Robert, S., and Mahieux, A.: Thermal winds in Venus mesosphere derived from the VIRTIS and VeRa temperature soundings, Europlanet Science Congress 2026, The Hague, The Netherlands, 7–11 Sep 2026, EPSC2026-167, https://doi.org/10.5194/epsc2026-167, 2026.
With a period of 243 days, Venus’ rotation is the slowest of all the planets in the solar system and is in the retrograde direction. Such a rotational state results directly from several tidal effects that impact both the atmosphere and the solid part of the planet. Therefore, to fully characterize the rotational dynamic and evolution of Venus, it is mandatory to have a comprehensive understanding of the factors that influence the different tidal effects controlling the rotation (Dobrovolskis et Ingersoll, 1980; Correia et Laskar, 2003; Revol et al., 2023, Musseau et al., 2024), and particularly the atmospheric thermal tides.
Topography is known to play a crucial role in modulating surface pressures and temperatures, as well as influencing atmospheric circulation, and is therefore also expected to influence the amplitude and temporal variability of atmospheric thermal tides. This aspect is particularly relevant for studies of the evolution of Venus' rotation because the topography may have changed significantly over a short geological timescale (< 1 Gyr) through resurfacing events or true polar wander (TPW). Using the Venus Planetary Climate Model (Lebonnois et al., 2016), we investigated how the distribution of the topography affects the atmospheric thermal tides and, consequently, the rotational state of the planet. Because the past topography of Venus is unknown, we focused our study on the effect of a true polar wander acting on the present-day topography. In this framework, the current topography is preserved, but its position relative to the rotation axis is modified. This approach allows us to isolate the effect of large-scale reorientation without introducing speculative topographies.
This work reveals the link between topography and thermal tides, showing that the variations of the atmospheric thermal torque over a solar day are mainly controlled by the near-equatorial large-scale topography. Moreover, we show that changes in the topography not only introduce strong diurnal variations in the torque but also change its daily average value and impact the overall balance between tides. Therefore, these results show that topographic distribution is a key element in the study of the rotational state of the planet. In addition, we update the empirical law that links atmospheric thermal torque to the forcing frequency from Leconte et al. (2015) and show that the presence of topography affects this relationship and may have influenced Venus' rotational evolution.
These results highlight that the present-day rotation of Venus is likely the outcome of a complex interplay between internal and external interactions. A comprehensive understanding of the rotational history of planets and exoplanets therefore requires better constraints on the coupling between internal dynamics, surface properties, and atmospheric processes, as well as their combined influence on tides. Therefore, this study brings out the necessity to precisely model the dynamics of atmospheric thermal tides and to include all the elements that can affect them. In addition, our results highlight the crucial importance of understanding how Venus' topography has evolved throughout the planet's history, which, in turn, is directly related to the planet's resurfacing history, tectonics, and surface rock composition. For this purpose, the upcoming mission EnVision (ESA) aims, in part, to improve our knowledge of the atmosphere, the surface, and the internal properties of Venus and better constrain the different tidal effects.
References:
Correia, A. C. et J. Laskar (2003). “Different Tidal Torques on a Planet with a Dense Atmosphere and Consequences to the Spin Dynamics”. Journal of Geophysical Research: Planets 108(E11), 2003JE002059.
Dobrovolskis, A. R. et A. P. Ingersoll (1980). “Atmospheric Tides and the Rotation of Venus I. Tidal Theory and the Balance of Torques”. Icarus 41(1), 1–17.
Lebonnois, S., N. Sugimoto et G. Gilli (2016). “Wave Analysis in the Atmosphere of Venus below 100-Km Altitude, Simulated by the LMD Venus GCM”. Icarus 278, 38–51.
Leconte, J., H. Wu, K. Menou et N. Murray (2015). “Asynchronous Rotation of Earth-mass Planets in the Habitable Zone of Lower-Mass Stars”. Science 347(6222), 632–635.
Musseau, Y., Tobie, G., Dumoulin, C., Gillmann, Revol, A., Bolmont, E. (2024). “The viscosity of Venus’ mantle inferred from its rotational state”. Icarus, 422, 116245
Revol, A., E. Bolmont, G. Tobie, C. Dumoulin, Y. Musseau, S. Mathis, A. Strugarek et A. Brun (2023). “Spin Evolution of Venus-like Planets Subjected to Gravitational and Thermal Tides”. Astronomy & Astrophysics
How to cite: Musseau, Y., Dumoulin, C., Tobie, G., Bertrand, T., Lebonnois, S., and JP Gülcher, A.: Influence of topography on atmospheric thermal tides and rotational evolution of Venus, Europlanet Science Congress 2026, The Hague, The Netherlands, 7–11 Sep 2026, EPSC2026-195, https://doi.org/10.5194/epsc2026-195, 2026.
Gravity waves play an essential role in planetary atmospheres by transporting momentum and energy far from their source regions. While observed in the Venusian atmosphere, their specific characteristics and generation mechanisms have remained poorly understood. This study investigates the activities of small-scale gravity waves using a Venus general circulation model with ultra-high spatial resolution (horizontal and vertical grid intervals of less than 20 km and 0.25 km, respectively).
Our simulations reveal that gravity waves are spontaneously radiated from nearly balanced flows as the super-rotation evolves. In the low-latitudes, thermal tides within the super-rotation act as the primary sources, whereas baroclinic and barotropic waves are essential sources in the mid- to high-latitudes. To isolate these mechanisms, we conducted experiments excluding the diurnal component of solar heating and performed sensitivity tests on the static stability of the cloud layer. We found that higher static stability weakens gravity wave radiation, indicating that the intensity of baroclinic instability is directly linked to the amount of spontaneous wave generation.
These small- to medium-scale gravity waves significantly affect the three-dimensional structure of the super-rotation and contribute to material mixing through their breaking processes. Notably, we confirmed for the first time that gravity waves in mid- to high-latitudes can transport zonal momentum vertically down to the lower atmosphere (~50–60 km). Furthermore, vertical propagation leads to a dual effect on the super-rotation: a deceleration in the upper cloud layer (~70 km) and an acceleration above ~80 km. These results demonstrate that momentum transport via spontaneous gravity wave radiation is a critical component of the Venusian atmospheric circulation and must be accounted for in our understanding of its global dynamics.
How to cite: Sugimoto, N., Fujisawa, Y., Kashimura, H., Komori, N., Noguchi, K., Kuroda, T., Takagi, M., and Hayashi, Y.-Y.: Spontaneous Gravity Wave Radiation and Its Impact on the Venusian Super-rotation: Insights from Ultra-High Resolution GCM Simulations, Europlanet Science Congress 2026, The Hague, The Netherlands, 7–11 Sep 2026, EPSC2026-22, https://doi.org/10.5194/epsc2026-22, 2026.
Dynamics in Venus’s massive atmosphere drive large-scale mass redistribution, generating measurable perturbations in the planet's external gravitational field. Future high-precision gravity measurements from upcoming missions will provide new constraints on the planet’s internal structure and atmospheric mass redistribution. While the deep atmosphere is difficult to observe with traditional remote sensing, these gravitational signatures offer a direct probe into near-surface dynamics. In this study, we analyze atmospheric fields from the Venus Planetary Climate Model (VPCM) to evaluate time-varying gravitational harmonics and assess the expected magnitude of the signal relative to the sensitivity of future gravity measurements. Our analysis shows that low-degree harmonics (l≤4) may reach amplitudes large enough to be distinguishable from the static internal gravity field. Spectral analysis of the simulated harmonics reveals a signal dominated by the diurnal thermal tide, with additional contributions from the semi-diurnal tide and a 35-day wave signal. This suggests that time-variable gravity measurements may be sensitive not only to thermally forced tides, but also to atmospheric wave activity in Venus’s deep atmosphere. We show that the dominant tidal and wave frequencies may be detectable in future gravity-tracking observations. Furthermore, we present a series of sensitivity experiments to determine how variations in atmospheric parameters influence the gravity signal amplitude and temporal structure. By identifying which atmospheric properties control these signatures, we demonstrate how future gravity data can be used to retrieve specific characteristics of the Venusian atmosphere.
How to cite: Navon, R., Galanti, E., Giuliani, F., Durante, D., and Kaspi, Y.: Gravity Signatures of Atmospheric Thermal Tides and Waves on Venus, Europlanet Science Congress 2026, The Hague, The Netherlands, 7–11 Sep 2026, EPSC2026-835, https://doi.org/10.5194/epsc2026-835, 2026.
Please decide on your access
Please use the buttons below to download the supplementary material or to visit the external website where the presentation is linked. Regarding the external link, please note that Copernicus Meetings cannot accept any liability for the content and the website you will visit.
Forward to presentation link
You are going to open an external link to the presentation as indicated by the authors. Copernicus Meetings cannot accept any liability for the content and the website you will visit.
We are sorry, but presentations are only available for conference attendees. Please register for the conference first. Thank you.
Introduction
The sulfuric acid clouds of Venus located at altitudes of 50–70 km play an important role in the energy budget of Venus. While this cloud layer reflects approximately 80% of the incident solar radiation, it absorbs most of the remaining energy, thereby determining the thermal structure of the whole atmosphere [1]. Sulfur dioxide, the chemical precursor of these clouds, is transported from the lower cloud layer and converted into sulfuric acid through photochemical reactions at the cloud top [2]. Therefore, clarifying the spatial distribution and transport processes of sulfur dioxide is essential for understanding the mechanisms that form and maintain the Venusian clouds. Furthermore, an unidentified UV absorber dominates solar energy absorption in the ultraviolet range and significantly influences dynamical structures, such as superrotation and thermal tides, by varying solar heating rates. There are likely complex feedbacks where atmospheric motions vary the distribution of these materials, which in turn induces changes in absorption and reflectance, modulating the solar energy supply.
These atmospheric motions range hierarchically from planetary-scale waves to local turbulence across various spatio-temporal scales. However, polar-orbiting observations so far have been limited by spatio-temporal continuity, making it difficult to continuously capture short-term fluctuations and global-scale dynamics. In contrast, the Japanese Venus orbiter, Akatsuki, has conducted high-frequency observations of the entire Venusian disk at 2-hour intervals using the Ultraviolet Imager (UVI) from a low-inclination orbit. Our previous research using approximately 15,000 dual-channel image pairs (283 nm and 365 nm) revealed that planetary-scale waves, such as thermal tides and Kelvin waves, excite fluctuations in the distribution of these materials [3]. However, these waves alone primarily induce periodic oscillations. The net transport that effectively carries materials to the cloud top is thought to be driven by the complex combinations of waves, chemical reactions of materials lifted upward, and dynamical processes such as small-scale turbulence and diffusion. In this study, we performed a detailed periodicity analysis and morphological discussions using snapshots to elucidate this material supply mechanism.
Methods
We analyzed over 15,000 pairs of 283- and 365-nm UV images captured by Akatsuki/UVI. These images are Level 3b data products, consisting of radiance maps calibrated on a longitude-latitude grid (0.125-degree resolution). To reduce computational costs and improve the signal-to-noise ratio, the data were spatially binned to a 1-degree resolution. By comparing the observed reflectance distributions at 283 nm and 365 nm with modeled reflectances generated by radiative transfer calculations, we utilized an iterative algorithm to determine the optimal pairs of the sulfur dioxide mixing ratio and the imaginary part of the refractive index of the clouds, a proxy for the unidentified absorber. These retrievals were performed for the entire dataset of 15,000 image pairs.
Results
A longitude-time two-dimensional Lomb-Scargle analysis was conducted on the equatorial distributions of sulfur dioxide and the unidentified absorber (Fig. 1). The results showed that for short-term fluctuations of less than 50 days, a westward-propagating wavenumber-1 structure with a 4-day period was most dominant, likely reflecting vertical atmospheric oscillations associated with equatorial Kelvin waves. Wavenumber-2 components were also identified. On longer timescales of approximately 200 days, signals corresponding to the semi-diurnal thermal tide (58-day period) and eastward-propagating wavenumber-2 components appeared strongly. The signals in the periodogram were not confined to specific peaks but were distributed across a broad frequency band, suggesting that the superposition of various wave components drives effective material transport.
In snapshots taken every two hours, the sulfur dioxide distribution, unlike that of the unidentified absorber, showed dark Y-shape structures [4]. This captures the dynamics where sulfur dioxide upwelling in the equatorial region is photochemically depleted while being transported to mid-to-high latitudes by meridional circulation and latitudinal shear of superrotation, providing evidence for the irreversible supply of sulfur dioxide to the cloud top. Furthermore, we observed the splitting of single concentration regions of sulfur dioxide as they moved with the superrotation (Fig. 2). This phenomenon is difficult to explain by the linear superposition of waves alone, suggesting that such non-linear processes contribute to the net transport of materials.
Finally, we investigated the relationship between the long-term temporal variations of the cloud-tracked zonal wind speed [5] and the abundance of the unidentified absorber, which can influence solar heating rates. The results showed a negative correlation between these two parameters on a decadal scale, while a strong positive correlation was observed on a scale of 2–3 Venusian years. This suggests the existence of a feedback between material distribution and dynamics through radiative heating.
Fig 1. 2D Lomb-Scargle periodograms of equatorial sulfur dioxide and unidentified absorber. The dashed lines indicate the phase velocity of the Kelvin wave.
Fig 2. A sequence of the maps cloud-top sulfur dioxide with 2-hour intervals from 23:01 on April 8, 2018 to 21:01 on April 9. The panel numbers indicate the temporal order.
References
[1] Titov et al., 2007, AGU Geophys. Monogr. Ser., 176, 121-138.
[2] Mills and Allen, 2007, Planet. Space Sci., 55, 1729-1740.
[3] Iwanaka et al., 2025, J. Geophys. Res. Planets, 130, e2024JE008775.
[4] Rossow et al., 1980, J. Geophys. Res., 85, 8107-8128.
[5] Horinouchi et al., 2024, J. Geophys. Res. Planets, 129, e2023JE008221.
How to cite: Iwanaka, T., Imamura, T., Aoki, S., Marcq, E., and Sagawa, H.: How the Venusian Atmospheric Dynamics Shapes Cloud-Top Sulfur Dioxide Derived from Akatsuki/UVI, Europlanet Science Congress 2026, The Hague, The Netherlands, 7–11 Sep 2026, EPSC2026-313, https://doi.org/10.5194/epsc2026-313, 2026.
Venus is often regarded as Earth’s “sister planet”, yet its atmosphere is fundamentally different, being dominated by CO2 (~96%). How such a CO2-rich atmosphere is chemically maintained remains a central unresolved problem in Venus science [1]. In the upper atmosphere, CO2 is dissociated by ultraviolet radiation into CO and O, while the direct recombination reaction, CO + O → CO2, is inefficient because it is spin-forbidden. Therefore, additional chemical pathways are required to explain the observed scarcity of CO and O2 near the cloud-top region. Proposed mechanisms include ClOx catalytic cycles and heterogeneous chemistry on aerosol particles, but these processes remain poorly constrained by observations. In this context, measuring or constraining O2 at the cloud top provides an important test of CO2 recycling chemistry.
Previous searches for O2 near the cloud-top region of Venus have been limited to a small number of high-resolution visible spectroscopic observations conducted in 1974, 1982, and 1995 [2-4]. These studies reported upper limits of 3 ppm for the 1974 and 1995 observations and 0.3 ppm for the 1982 observation. Since then, no dedicated observational update has been reported, despite major improvements in telescope aperture, spectrograph performance, and data analysis techniques.
Here we present a new search for molecular oxygen at the cloud top of Venus using the High Dispersion Spectrograph (HDS) on the Subaru Telescope. Subaru/HDS provides very high spectral resolution, R ~ 160,000, together with broad spectral coverage, allowing us to combine multiple O2 absorption lines and improve sensitivity to the extremely weak Venusian signal. The observation was performed on 17 June 2025 under a favorable Earth-Venus Doppler-shift geometry, which helps separate Venusian O2 features from telluric absorption. Although the total integration time was only a few minutes, the large aperture of Subaru enabled spectra with sufficiently high signal-to-noise ratio for this search.
In the presentation, we compare the observed spectra with radiative transfer calculations including both terrestrial and Venusian absorption components, and report the resulting constraint on the cloud-top O2 abundance.
References: [1] Yung & Demore, 1982, Icarus, 51, 199-247. [2] Traub and Carleton, 1974, in Exploration of the Planetary System, 223-228. [3] Trauger and Lunine, 1983, Icarus, 55, 272-281. [4] Mills, 1999, J. Geophys. Res. 104, 30757–30763.
How to cite: Aoki, S., Sagawa, H., Karyu, H., Yoshida, T., Kagitani, M., Arai, A., Shinnaka, Y., Iwanaka, T., Imai, M., Brines, A., Villanueva, G., Faggi, S., Robert, S., Vandaele, A., and Marcq, E.: A Search for Molecular Oxygen at the Cloud Top of Venus with Subaru/HDS, Europlanet Science Congress 2026, The Hague, The Netherlands, 7–11 Sep 2026, EPSC2026-294, https://doi.org/10.5194/epsc2026-294, 2026.
Introduction
On Venus, 85,000 volcanic edifices have been identified (Hahn and Byrne, 2023), and between 40 and 120 per Earth year could be active (Byrne and Krishnamoorthy, 2022; van Zelst, 2022). The question of volcanism is central to determining the long-term and recent evolution of the atmosphere (Gillmann et al., 2022). The climatic impact of volcanic outgassing on Venus is not known, but the sulphuric acid cloud deck, between 47 and 70 km, could be maintained through a supply of SO2 gas (Bullock and Grinspoon, 2001). Volcanic plume destabilising the cloud chemistry is the main hypothesis for the periodical variations of mesospheric SO2 (Esposito, 1984; Marcq et al., 2013). Recent analysis of Magellan images showed geomorphological variations over a few months (Herrick and Hensley, 2023; Sulcanese et al., 2024), and hot spots have been observed by Venus Express, both suggesting possible present volcanic activity (Smrekar et al., 2010; Shalygin et al., 2015). Nevertheless, the characteristics of volcanic plumes on Venus remain unknown (Wilson et al., 2024).
The study of the exotic, hot, sulphur cycle of Venus is a priority of the European, U.S. and international scientific community, with the observations of active volcanism the primary target. The ESA’s EnVision, and two NASA missions, DAVINCI (Garvin et al., 2022) and VERITAS, were all three selected to launch around 2031. It is therefore important to constrain volcanic plume dynamics on Venus.
Lefèvre et al. (2025) adapted a 1D eruption column for Venus, and showed that explosive volcanism would preferably reach 15 km of altitude, and that the super-rotating winds have a substantial impact by plume-bending of reducing the height of plumes. However, discrepancies between 1D and 3D are known for Earth volcanic plumes (Costa et al., 2016), especially for complex features of strong plumes. We propose to adapt a 3D plume model for the Venusian environment to resolve the vertical propagation of strong plume.
Model
The ASHEE solver (Cerminara et al., 2016) is conceived to numerically simulate the dynamics of compressible multiphase flows, focusing on volcanic plumes and dilute pyroclastic density currents, i.e. gas-particle mixtures with multiple gas components and solid particle classes for pyroclasts modelling. The equations solved are the continuity equations for all the phases, the momentum and energy of the mixture, and the equations for the dynamic LES model. The ASHEE was adapted for Venus, and for the first time in 3D, the vertical propagation of volcanic plumes is resolved.
Results
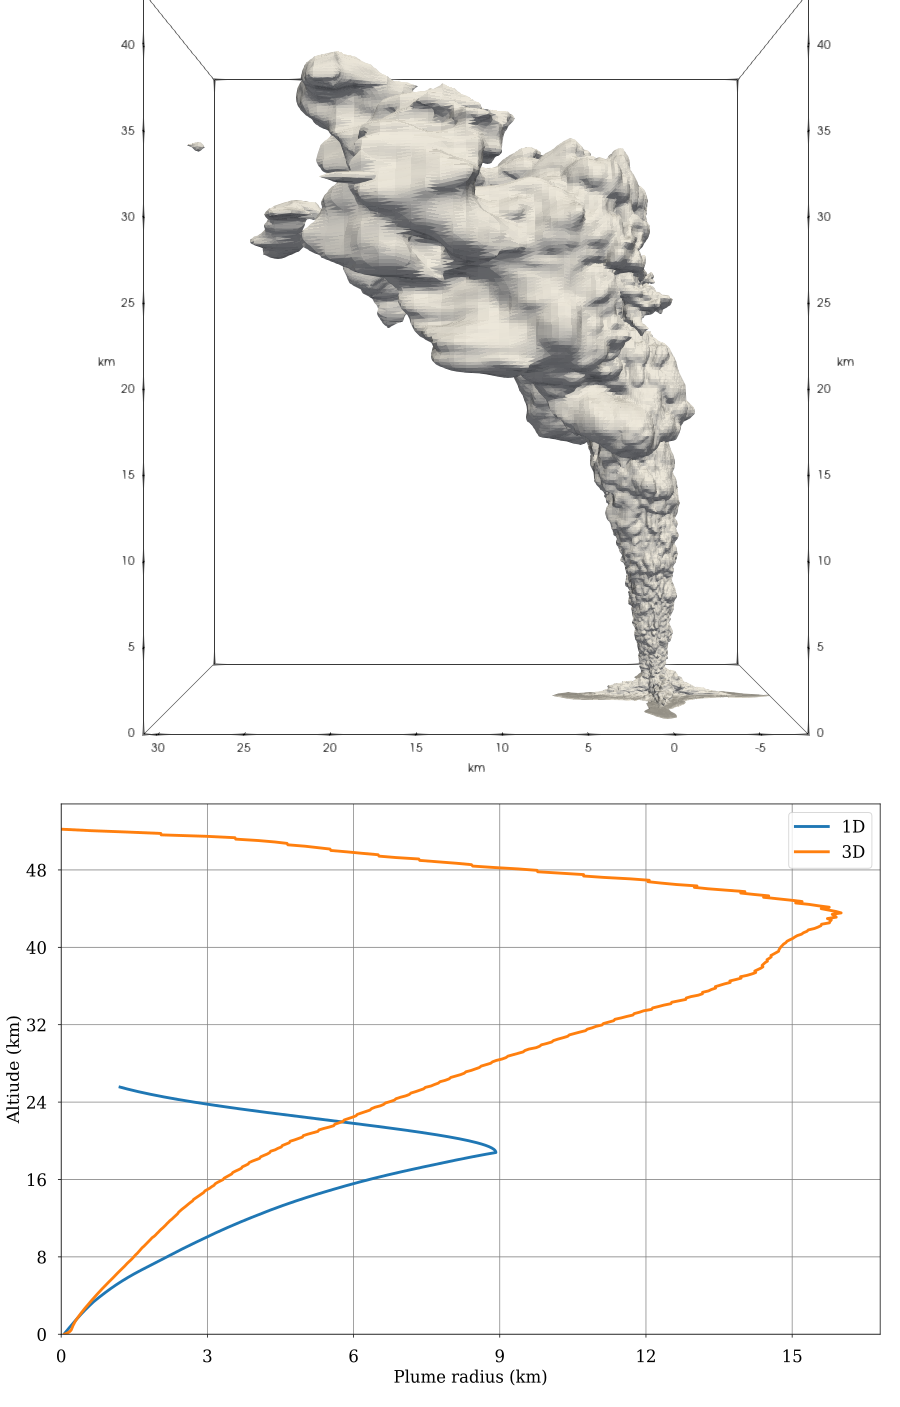
Under extreme vent conditions (mass flow rate, exit temperature and velocity), the 3D plume can reach the clouds (48-70 km), as seen in Fig 1. There are significant discrepancies between the height reached by the plume in 1D versus 3D. The parametrization of entrainment between the plume and ambient air in the 1D is valid for the Earth atmosphere but not valid for the Venus environment. The impact of the wind shear, volatile mass fraction and composition will be assessed. The generation of secondary plumes will be discussed. The volatile flux from the plume into the atmosphere will be presented.

Figure 1: Top: contour for ash. Bottom: Vertical profile of the plume radius. The two panels are for a mass flow rate of 109 kg/s, an exit temperature of 1600 K, an exit velocity of 280 m/s and a 5%wt volatile composed of water with the 1D and 3D model.
Volcanic eruptions generate a spectrum of waves in the atmosphere, from infrasound to gravity waves. The characteristics of those waves were never established for Venus and will be shown. The dispersion of the ash solid particle on the radar reflectivity will be discussed.
References
- Bullock, M. A., & Grinspoon, D. H. (2001). Icarus, 150:19–37.
- Byrne, P. K., & Krishnamoorthy, S. (2022). Journal of Geophysical Research: Planets, 127(1):e2021JE007040.
- Cerminara, M., Esposti Ongaro, T., & Berselli, L. C. (2016). Geoscientific Model Development, 9:697–730.
- Costa, A., Suzuki, Y. J., Cerminara, M., et al. (2016). Journal of Volcanology and Geothermal Research, 326:2–25.
- Esposito, L. W. (1984). Science, 223:1072–1074.
- Garvin, J. B., Getty, S. A., Arney, G. N., et al. (2022). The Planetary Science Journal, 3(5):117.
- Gillmann, C., Way, M. J., Avice, G., et al. (2022). Space Science Reviews, 218(7):56.
- Hahn, R. M., & Byrne, P. K. (2023). Journal of Geophysical Research (Planets), 128:e2023JE007753.
- Herrick, R. R., & Hensley, S. (2023). Science, 379:1205–1208.
- Lefèvre, M., Cerminara, M., & Costa, A. (2025). Journal of Geophysical Research: Planets, 130(10):e2025JE009320.
- Marcq, E., Bertaux, J.-L., Montmessin, F., et al. (2013). Nature Geoscience, 6:25–28.
- Shalygin, E. V., Markiewicz, W. J., Basilevsky, A. T., et al. (2015). Geophysical Research Letters, 42:4762–4769.
- Smrekar, S. E., Stofan, E. R., Mueller, N., et al. (2010). Science, 328:605.
- Sulcanese, D., Mitri, G., & Mastrogiuseppe, M. (2024). Nature Astronomy, 8:973–982.
- van Zelst, I. (2022). Journal of Geophysical Research: Planets, 127(12):e2022JE007448.
- Wilson, C. F., Marcq, E., Gillmann, C., et al. (2024). Space Science Reviews, 220:31
How to cite: Lefevre, M. and Cerminara, M.: 4D modelling volcanic plume on Venus, Europlanet Science Congress 2026, The Hague, The Netherlands, 7–11 Sep 2026, EPSC2026-75, https://doi.org/10.5194/epsc2026-75, 2026.
Is Venus volcanically active today? Resolving the ambiguity surrounding current Venusian volcanism is a primary objective for upcoming missions like EnVision and VERITAS. One potential unambiguous sign of volcanic activity would be the detection of gas plumes from an explosive volcanic eruption. If such plumes exist, their detectability will be limited by dispersion and dilution in the active Venus atmosphere.
To constrain the lifetime of plumes from possible explosive volcanism, we used the Venus Planetary Climate Model to simulate the dispersal of plumes containing water vapour (H2O), hydrogen chloride (HCl), carbon monoxide (CO), and carbonyl sulphide (OCS) within a three-dimensional atmospheric environment. We model localised gas enhancements at altitudes probed by nightside spectral windows (8.62, 20.91, and 35.45 km above surface).
Figure 1: Localised enhancements in trace gas species caused by a simulated volcanic plume
Our results indicate that plumes persist longest in the deep atmosphere (8.62 km) at equatorial latitudes, where H2O enhancements remain distinguishable from low background variability for up to 100 hours, forming distinct downstream streaks. In contrast, at 35 km, high intrinsic variability in chemically active species (CO and OCS) driven by atmospheric dynamics obscures plume signatures. While the impact of trace gas enhancements on measured spectra is larger at this altitude, planetary-scale waves induce travelling maxima in CO and OCS abundances which could easily be mistaken for plumes. Chemically inert species (H2O, HCl) are less intrinsically variable, but disperse within 0.5-2 Earth days due to the relatively high wind speeds at 35 km.
We perform sensitivity tests with trace gas increases of 50%, 40%, 30%, 20%, 10%, and 3% above background levels. Higher enhancements, simulating bigger eruptions, take longer to disperse, but qualitative findings that plume lifetimes are longer at lower latitudes and altitudes and for chemically inert gases are largely consistent across simulations. We conclude that observing inert gases, in particular H2O, at low altitudes and latitudes offers the best opportunity for successful plume detection. Even in the best case scenario, however, plume lifetimes in our study reach a maximum of only a few days. These results should be taken into consideration when planning observation strategies and interpreting potential observations of variability in trace gas species.
Figure 2: Maximum persistence time of water vapour plume enhancements for five different increases (50%, 40%, 30%, 20%, 10%, and 3% above background level) and three altitudes (8.62 km, 20.91 km, 35.45 km).
How to cite: Cohen, M., Holmes, J., Egan, J., Lewis, S., and Patel, M.: How long could volcanic plumes persist in the Venus atmosphere?, Europlanet Science Congress 2026, The Hague, The Netherlands, 7–11 Sep 2026, EPSC2026-521, https://doi.org/10.5194/epsc2026-521, 2026.
The enrichment of Venusian atmospheric D/H ratio is commonly interpreted as evidence for substantial water loss, but its connection to present-day atmospheric escape remains uncertain. Because hydrogen and deuterium can escape through different thermal and non-thermal pathways, quantifying their relative escape rates is essential for assessing the escape fractionation of Venusian water. We present new developments of the LMDZ Venus Planetary Climate Model for the study of H and D escape. Building on the recent thermospheric and ionospheric extension of the model, we have introduced deuterium-bearing species and reactions, allowing the H- and D-bearing species to be followed from the lower atmosphere to the thermosphere. The model is used to compute the thermal escape of H and D and to provide a self-consistent three-dimensional atmospheric and ionospheric background for non-thermal escape calculations. Photochemical escape is investigated with a Monte Carlo test-particle model, while solar-wind-driven ion escape is studied by coupling the Venus PCM outputs to the LatHyS Venus hybrid model. This work provides a unified framework for comparing the main escape channels of H and D at Venus and for estimating the present-day D/H escape fractionation factor. It offers a step toward linking current upper-atmospheric loss processes to the long-term isotopic evolution history of Venusian water.
How to cite: Li, D., Martinez, A., Modolo, R., Chaufray, J.-Y., Aizawa, S., Xu, Q., Montmessin, F., Lefèvre, F., and Lebonnois, S.: Three-dimensional simulations of thermal and non-thermal hydrogen and deuterium escape from Venus , Europlanet Science Congress 2026, The Hague, The Netherlands, 7–11 Sep 2026, EPSC2026-535, https://doi.org/10.5194/epsc2026-535, 2026.
Helium-4 (He) in the Venusian atmosphere has previously been identified through remote spectroscopic observations as well as in-situ plasma and mass spectrometer measurements from earlier spacecraft missions (e.g., Mariner 10, Venera 11 and 12, and PVO).
In this study, we analyze magnetic field and plasma observations from the Venus Express (VEX) mission to investigate ion cyclotron waves (ICWs) generated by the pickup of exospheric He-ions by the solar wind. Through the detection and analysis of these wave signatures, we identify for the first time a nonthermal exospheric He population extending from approximately 1 Venus radius up to 11 Venus radii. Average kinetic temperatures of around 2700 K and an inferred exobase density of about 200 cm-3, characterize the derived population.
Our results indicate that there are likely two energization mechanisms for this nonthermal helium component. The first mechanism is related to collisions between thermal He atoms and suprathermal oxygen atoms near or slightly above the exobase. This process produces a hotter nonthermal helium population, consistent with mechanisms previously proposed for both Venus and Mars. The second possible mechanism is the dissociation of HeH+ in the exobase region.
Using the helium escape flux derived in this study, approximately 4 × 104 cm-2 s-1, we further investigate the long-term evolution of helium in the Venusian atmosphere. The comparatively low escape rate suggests that the present atmospheric He abundance could have accumulated since the last major resurfacing event, or potentially over even longer geological timescales
How to cite: Weichbold, F., Lammer, H., Scherf, M., Carberry Mogan, S., Simon-Wedlund, C., Schmid, D., and Volwerk, M.: Magnetic Evidence for a Nonthermal He Population in the Venusian Exosphere, Europlanet Science Congress 2026, The Hague, The Netherlands, 7–11 Sep 2026, EPSC2026-1017, https://doi.org/10.5194/epsc2026-1017, 2026.
Introduction: On Venus, variations in SO2 content in the cloud tops have been suggested as evidence of recent volcanism [1]. The Pioneer orbiter observed a steep decline in SO2 content in the cloud tops between 1978 and 1983 which may have been caused by a recent injection of volcanic SO2 into the mesosphere [2]. [1] found a similar decline in the SO2 content in the Venus Express data between 2006 and 2014, although they suggest that temporal variations are caused by episodic variations in atmospheric mixing of SO2 rich troposphere and SO2 poor mesosphere. [3] found high degrees of temporal and spatial variations in SO, SO2, (SO+SO2) and SO/SO2 ratio across all available datasets. No mechanism was suggested to explain these variations. It is debated whether these variations are caused by either volcanic SO2 influx, by atmospheric processes or by a combination.
Atmospheric SO2 is consumed by weathering of surface rocks, where Ca-bearing minerals react with SO2 to create anhydrite (CaSO4). Atmospheric SO2 may or may not be buffered by interactions with anhydrite and plagioclase [4]. It is therefore unclear whether recent volcanic SO2 degassing is required to maintain the current SO2 abundance in the atmosphere or if it the current SO2 content is in equilibrium with this mineral assemblage [5].
The goal of this study is to experimentally derive SO2 degassing kinematics and their dependence on magma temperature at Venus’ current atmospheric surface pressure (92 bar). This is done by conducting experiments in a gas-mixing furnace at relevant magma temperatures (1250–1400 °C) and two different pressures; a ~0,005 bar vacuum and a 1 bar CO2 atmosphere. From this, the pressure and temperature dependance of degassing kinematics is extrapolated to Venus’s surface conditions.
Methods: SO2-rich starting materials are made in accordance with composition PPG07 from [6]. This a haplobasaltic composition based on the anorthite (CaAl2Si2O8) + diopside (CaMg2Si2O6) eutectic (An36Di64). CaSO4 is added as the volatile component. Boron is added to reduce the system liquidus temperature. The lower temperature at glass synthesis stage mitigates the evaporative loss of SO2 during the synthesis of the starting material, as well as lowering the melting temperature of samples. The mixture is vitrivied in a crucible for a short duration.
This material is ground to a powder. Small amounts of this powder are mixed with polyvinyl alcohol glue to create a viscous slurry. Around 20 mm length of thin (0.1mm) Pt wire is bent around rod for 1–2 rotations to create a loop (r ~ 1.5 mm) with a straight piece of wire extending from the loop. The loop is used to scoop up the slurry. The slurry is dried and hardened with a lighter. The Pt wire attached to a carousel of thicker Pt wire attached to an alumina rod. The rod with samples attached is lowered to the hot spot of the gas-mixing furnace at which point the experiment time starts.
The 1 bar experiments were performed in a CO2 atmosphere by flowing 200 cm3/min CO2 through the furnace with a flow controller in a temperature range of 1250–1400 °C. The vacuum experiments are all done at 1250 °C. Low pressures (~0,005 bar) are achieved by attaching an Alcatel vacuum pump to the furnace.
After the experiment time elapsed, the molten beads are taken out of the furnace and quenched. The dimensions of the resulting glass beads are measured before mounting them in epoxy and analyzing their major oxide composition as well as SO2 content, divided by the original SO2 content (Xt/X0) with an EPMA.
Experiments are done with various experiment times for each combination of P and T. As the loops with starter material reach the hot spot of the furnace, the outside heats up first and starts degassing while the inside is not yet hot enough for diffusion to replenish the outside with SO2. This causes zoning at the beginning of the experiment. As the center of the bead reaches a high enough temperature to start efficient diffusion, the concentration of SO2 throughout the bead equilibrates. From this point, the beads follow a degassing curve (figure 1). This curve is extrapolated to where Xt/X0 = 1. The corresponding time is t0, the apparent lag time, and is subtracted from the experiment time.

Figure 1: Xt/X0 of all beads from experiments done at 1350 °C under a 1 bar CO2 atmosphere. 1 minute experiments are within the lag time (t0) of 3.5 minutes, constrained from the degassing curve.
From the bead dimensions, the SO2 fraction and the experiment time (minus t0), a reaction rate constant K* is calculated using the thermodynamic framework outlined in [7]. Values for K* from all beads with same P and T are averaged. The effect of temperature on K* is constrained by regression through all data at 1 bar. This effect is assumed to be the same at all pressures. The effect of pressure is constrained at 1250 °C.
These effects are extrapolated to predict the reaction rate constants under Venus surface pressure and relevant magma temperatures. These are used to calculate absolute SO2 fluxes evaporating from silicate lavas in different magmatic settings; a putative global resurfacing event, a collection of large lava lakes and a collection of lava flow channels, in order to see constrain what scale of events can provide a volcanic signature from SO2 degassing.
Results: Experiments have been done and analysis is ongoing, results will be presented at the meeting.
Acknowledgements: This study was supported by ERC StG VenusVolAtmos awarded to ESS. We want to thank Maik Trogisch at Münster University for his diligent preparation of our samples.
References: [1] Marcq et al. (2013), Nature Geoscience [2] Esposito (1984), Science [3] Vandaele et al. (2017), Icarus [4] Zolotov (2018), Reviews in Mineralogy and Geochemistry [5] Wilson et al. (2024), Space Science Reviews [6] Pangritz et al. (2022), ACS Earth and Space Chemistry [7] Sossi et al. (2019), GCA
How to cite: Jorritsma, J., Aerts, G., Berndt, J., Klemme, S., and Steenstra, E.: Experimental quantification of the evaporative loss of SO2 from silicate melt: implications for the Venusian sulfur flux, Europlanet Science Congress 2026, The Hague, The Netherlands, 7–11 Sep 2026, EPSC2026-456, https://doi.org/10.5194/epsc2026-456, 2026.
Please decide on your access
Please use the buttons below to download the supplementary material or to visit the external website where the presentation is linked. Regarding the external link, please note that Copernicus Meetings cannot accept any liability for the content and the website you will visit.
Forward to presentation link
You are going to open an external link to the presentation as indicated by the authors. Copernicus Meetings cannot accept any liability for the content and the website you will visit.
We are sorry, but presentations are only available for conference attendees. Please register for the conference first. Thank you.
Introduction
The Venus Planetary Climate Model (Venus PCM) is a full-physics atmospheric model designed to simulate the thermal structure and circulation of Venus from the surface to the upper atmosphere. The model couples the dynamical core with a radiative transfer scheme that allows the temperature field to be computed self-consistently[1]. The solar radiation module of the Venus PCM was updated using a two-stream scheme from the Generic PCM, allowing a full coupling between solar heating rates, cloud particles and atmospheric composition. The thermal infrared transfer is treated using a Net Exchange Rate matrix formalism[2]. This infrared scheme computes radiative exchanges between atmospheric layers, the surface, and space over the 1.7–250 μm spectral range, allowing radiative heating and cooling rates to be evaluated consistently within the Venus PCM[3]. The opacity calculation includes molecular absorption, cloud opacity, and continuum/CIA contributions, with cloud optical properties commonly based on the Haus cloud model retrieved from Venus Express and Venera observations[4]. For this framework, studying the Venus lower atmosphere is particularly important because uncertainties on opacity and continuum absorption in several windows strongly affect the radiative exchange between the deep atmosphere and the cloud layer.
Control parameters of cloud layer and deeper atmosphere
Particular attention was given to the opacity in the infrared windows between 2 and 10 μm, as well as in the 18-30 μm region, in the far wing of the 15-μm band of CO₂, since these spectral intervals regulate the radiative exchanges between the deep atmosphere, the cloud base, and the overlying cloud layer, and therefore strongly influence the simulated temperature profile from the cloud convective region to the surface. However, after updating the CO₂–CO₂ CIA and CO₂ line-shape treatments[5,6], the modeled opacity in these windows remains insufficient to reproduce the observed thermal structure, leading to excessive radiative cooling and underestimated temperatures in the lower atmosphere.
Temperature structure in the cloud
The temperature at the cloud base mostly depends on the amount of solar energy absorbed in the middle cloud and below, as this energy is balanced by thermal emission mostly to space in the 10-30 μm spectral region at the top of the convective layer (interface between upper and middle cloud, as shown in the Figure 1).

Figure 1. This figure compares the spectral contributions of different opacity sources at the level 1x10⁴ pa and 250k (nearly the top pf the convective layer), including the 2016 reference dataset, the updated HR2024 dataset, individual gas absorptions, cloud extinction, and CIA/continuum terms. Gas lines dominate the strong absorption regions, while clouds and continuum absorption provide smoother background opacity. The shading color on the background represents the narrowbands used in the radiative transfer modules.
Figure 2. Net infrared flux per narrowband (positive upward),which illustrates the energy exchange from layer to layer in every narrowbands. Left plot: corresponding to the Figure1 SO2 curve (green line) Right plot: Figure 1 SO2 former curve (pink line)
To evaluate the sensitivity of radiative transfer in the 18-30 μm spectral window, we performed a series of sensitivity experiments in which the SO₂ abundance, cloud optical thickness, and H₂O mixing ratio were adjusted within observationally constrained ranges. These tests were designed to isolate the relative influence of key opacity sources on the thermal structure of the Venus atmosphere, with particular emphasis on the potential temperature response within the cloud layer and near the cloud base.

Figure 3. Potential temperature of different SO2 concentration cases
Stability in the stable layer below the cloud
With the obtained shape of the opacity in the 2-10 micron spectral region, energy exchanges between lower layers and the cloud base are too efficient in the stable layer (30-50 km), leading to under-estimated temperatures in the deep atmosphere. To further investigate the origin of this excessive radiative coupling, we tested the sensitivity of the model to the H₂O–CO₂ continuum absorption and to different vertical distributions of H₂O volume mixing ratio below the clouds. The results indicate that H₂O plays a major role in controlling the radiative stability of the deep atmosphere. In particular, doubling the H₂O continuum reduces the transparency of the 5–10 μm window and increases the potential temperature under the cloud base by approximately 30K. Similarly, increasing the H₂O abundance in the sub-cloud region modifies the net infrared flux and weakens the excessive energy exchange between the deep atmosphere and the cloud layer. These experiments suggest that even moderate changes in H₂O opacity can produce a significant response in the thermal structure below the clouds.
The influence of other relevant sources of opacity and comparison with latest reasearch have been explored: HCl and CO2 dimer CIA in 3-4 micron window, CO in 2.3 micron window[7][8]. These three spectral regions are key to control the radiative exchanges between the deep atmosphere and the cloud base and therefore represent critical targets for improving the representation of lower-atmosphere stability in the model.
References
[1] Garate-Lopez, I., & Lebonnois, S. (2018). Icarus, 314, 1-11, doi : 10.1016/j.icarus.2018.05.011
[2] Eymet, V.,et al. (2009). Journal of Geophysical Research: Planets, 114(E11), doi : 10.1029/2008JE003276
[3] Lebonnois, S.,et al. (2015). Journal of Geophysical Research: Planets, 120(6), 1186-1200, doi : 10.1002/2015JE004794
[4] Haus R, Kappel D, Arnold G.(2015). Planetary and Space Science, 117:262-294. doi:10.1016/j.pss.2015.06.024
[5] Tran, H et al. (2011). Journal of Quantitative Spectroscopy and Radiative Transfer, 112(6), 925-936, doi : 10.1016/j.jqsrt.2010.11.021
[6] Tran, H et al. (2024). Icarus 422, 116265, doi: 10.1016/j.icarus.2024.116265
[7] Takahashi et al. (2023). Journal of the Meteorological Society of Japan 101, 39–66, doi: 10.2151/jmsj.2023-003.
[8] Takahashi et al. (2024). Journal of the Meteorological Society of Japan, 102, 469–483, doi: 10.2151/jmsj.2024-025.
How to cite: Han, P., Lebonnois, S., Kang, H., and Lee, Y. J.: Radiative control of Venus atmosphere temperature structure, Europlanet Science Congress 2026, The Hague, The Netherlands, 7–11 Sep 2026, EPSC2026-806, https://doi.org/10.5194/epsc2026-806, 2026.
Introduction
Despite similarities between Earth and Venus in size and bulk composition, Venus is currently one of the most enigmatic planets in the Solar System, with its surface shrouded by a dense CO2-rich atmosphere. Obtaining data from Venus’ lower atmosphere below the planetary boundary layer (PBL) has been a challenge. In the coming decade, several missions to Venus are planned (e.g. [1]) that aim to image Venus nightside thermal emission in the NIR spectral windows [2] from orbit and in addition to future descent probes (e.g. [3]) that will measure lower atmospheric properties including species abundance, temperature, pressure, and wind speed. Until such data becomes available in the next decade, we have to rely on Atmosphere Radiative Transfer Modelling (ARTM) and existing measurements to expand our understanding and prepare for future data processing.
Venus’ high pressure and temperature conditions require us to consider absorption line broadening effects. Since these effects are poorly understood for such environments, they are usually accounted for by implementing a modified molecular absorption line profile (CO2 and H2O). An additional continuum opacity is often required to match observations (NIR ARTM) which we assume is due to collision induced bands and far wing contributions of allowed CO2 transitions, seemingly varying with square of number density (e.g., [4-8]). Calculation of such a term depends on the temperature – pressure relationship used in the ARTM. The temperature structure of the lower atmosphere is contested – the failure of thermal sensors on Pioneer Venus probes resulted in no details of the PBL making their way to the Venus International Reference Atmosphere (VIRA [9]) which is widely used in the community as a standard temperature- pressure profile. Contrary to this, the VeGa-2 [10] descent probe’s higher resolved observations are often considered impractical as they point to a temperature lapse rate exceeding the adiabatic lapse rate. However, Lebonnois and Schubert (2017) have shown that such a structure is plausible through a vertical gradient of N2, resulting in an almost pure CO2 atmosphere close to the surface [11].
In this work we apply our ARTM to different temperature-pressure profiles (VIRA and VeGa-2) and study their effect on the of continuum opacity required to match the model with data from Venus Express.
SPICAV dataset from Venus Express:
The Spectroscopy for the Investigation of the Characteristics of the Atmosphere of Venus (SPICAV) suite on board Venus Express (VEX) made spectrally relatively high-resolution observations of Venus’ nightside in the spectral range of 0.65–1.7 µm. The synthetic radiance generated by our ARTM is compared to SPICAV IR night-side observations on VEX orbit 34 [12] and additional processing by [13].
Radiative Transfer Model
Our ARTM is a combination of several open-source tools – Helios-k [14] to compute line by line absorption cross sections ofCO2 using HITEMP 2025 [15] with a sub-Lorentzian line shape identical to [16], the HITEMP 2010 database for H2O with a super-Lorentzian lineshape, Python for Computational ATmospheric Spectroscopy (Py4CATS) [17] to calculate Rayleigh contributions according to [18], and DISORT [19] implementation [20] to solve the radiative transfer equation. Our cloud model follows that detailed in [21]. Continuum coefficients are free parameters and are adjusted until modeled radiance matches that of the SPICAV observation.
Preliminary results
The figure below shows modeled Venus’ night-side radiances for near nadir geometry using VIRA and VeGa-2 temperature profiles. The continuum opacities have been fitted at each spectral window (consistent with future spectrometers observing in NIR) and the particle density of the lowest cloud layer [21] has been scaled by a suitable factor in order to reproduce radiances found in the SPICAV IR dataset. The assumed emissivity is consistent with that of a basalt sample measured in the laboratory [22].

Figure 1: Venus’ night-side NIR radiances produced by our ARTM compared with SPICAV radiances for VIRA and VeGa-2 temperature profiles, assuming isoprofiles of gas abundances. Shaded ranges indicate wavelengths corresponding to planned future observations.
Our current ARTM produces a good fit to the SPICAV spectrum for both assumptions of temperature structures. We note that the continuum opacity required to fit the model is significantly lowerin the VeGa-2 case (notice the logarithmic representation in Fig. 1). As part of this work, we aim to implement varying CO2 abundances as hypothesized by [11] and investigate the continuum coefficient necessary to fit the data.
The order of magnitude difference in derived continuum at 1.31 µm between the VIRA and VeGa-2 profiles suggests that it would be possible to confirm the existence of a VeGa-2 like lapse rate globally with instruments on the Venus missions in development, if both the surface emissivity and the CO2 opacity were constrained with sufficient accuracy.
Bibliography
[1] Smrekar S. + (2022) IEEE Aerospace Conference (AERO) pp. 1-20
[2] Allen D. A. + (1984) Nature, 307, 222–224
[3] Garvin J. B. + (2022) PSJ, 3(5), 117
[4] Pollack J. B. + (1993) Icarus, 103, 1–42
[5] Bézard B. + (2011) Icarus, 216(1), 173–83
[6] Arney G. + (2014) Journal of Geophys. Res.: Planets, 119 (8), 1860-1891
[7] Fedorova A. + (2014) Planetary and Space Science, 113-115, 66-77
[8] Mueller N. T. + (2020) Icarus, 335, 113400
[9] Seiff A. + (1985) Advances in Space Research, 5(11):3–58
[10] Seiff A. + (1987) Advances in Space Research, 7(12), 323–328
[11] Lebonnois S. and Schubert, G. (2017) Nature Geoscience, 10(7):473–477
[12] Korablev O. + (2006) J. Geophys. Res. 111(E9)
[13] Kappel D. + (2016) EGU General Assembly Vol. 18, EGU2016-7578-1
[14] Grimm J. S. and Heng, K. (2015) ApJ 808 182
[15] Hargreaves R. J + (2025) J. Quant. Spectrosc. Radiat. Transfer 333
[16] Bezard B. + (2009) Journal of Geophysical Research 114
[17] Schreier F. + (2019) Atmosphere, 10(5), 262
[18] Sneep M. & Ubachs W. (2005) Journal of Quantitative Spectroscopy and Radiative Transfer, 92(3), 293–310
[19] Stamnes K.+ (1988) Applied Optics, 27(12), 2502-2509
[20] Buras R. + (2011) Journal of Quantitative Spectroscopy & Radiative Transfer, 112(12), 2028–2034
[21] Haus R. + (2013) Planetary and Space Science, 89, 77-101
[22] Helbert, J. + (2021). Science Advances, 7(3).
How to cite: Das, A., Müller, N., Kappel, D., Rauer, H., Plesa, A.-C., Alemanno, G., and Grenfell, J. L.: Impact of Venus lower atmosphere temperature profile on derived atmospheric continuum in the near infrared, Europlanet Science Congress 2026, The Hague, The Netherlands, 7–11 Sep 2026, EPSC2026-1124, https://doi.org/10.5194/epsc2026-1124, 2026.
The depletion of SO2 in Venus's middle atmosphere, observed from below and above the cloud deck, remains unexplained. SO2 abundance decreases from 130 ppmv below the clouds [1] to a few hundred ppbv at the cloud top [2,3,4,5]. The VenSpec suite onboard EnVision aims to provide new observations of key gas species (SO2, H2O, CO, etc.) in the middle atmosphere to help constrain its chemical landscape.
Modeling efforts have explored different approaches to Venusian sulfur chemistry. [6] proposed that increased SO2 dissolution, facilitated by salts in cloud droplets, may account for the observed depletion. However, most chemical models instead simplify the issue by reducing the bulk SO2 reservoir [7, 8, 9, 10, among others]. Despite this simplification, sulfur photochemistry remains intricate, governed by a balance between SO2 photolysis and the condensation of sulfuric acid against vertical transport. To further investigate the modeled sulfur chemistry in the Venusian middle atmosphere, we employed the chemical pathways analysis tool PaPy [11], which builds on [12]. PaPy has been successfully applied to Early Mars simulations [13] and has now been adapted for use with the Venus Planetary Climate Model (Venus PCM) results.
We will detail the key chemical pathways governing SO2 behavior in the Venusian cloud deck using 3D outputs from the Venus PCM. We will examine how sulfur chemistry varies with local time and latitude throughout the Venusian day. On the dayside, photolysis dominates SO2 chemistry and the production of H2SO4 is crucial. Nonetheles, we will present how the SO2 chemistry remains more complicated. On the nightside, the SO2 chemistry involves significant contributions from NOx, ClOx, and Sx species while keeping interesting and unexpected behavior as some altitude ranges still are being dominated by a NET chemical loss of SO2. At the morning and evening terminators, we will identify the specific chemical pathways responsible for observed variations in SO2 abundances. These pathways will be analyzed within their local transport context, considering both advective and diffusive dynamics as evaluated by the Venus PCM.
Acknowledgements: Authors FDS, AS, LML and AM acknowledges financial support from the Severo Ochoa grant CEX2021-001131-S funded by MCIN/AEI/ 10.13039/501100011033. Author AS acknowledges financial support from project PID2021-126365NB-C21 funded by MCIN/AEI/10.13039/501100011033/ and FEDER.
[1] Marcq, E., et al. JGR: Planets 113.E5 (2008).
[2] Marcq, E., et al. Icarus 335 (2020): 113368.
[3] Encrenaz, T., et al. A & A 639 (2020): A69.
[4] Encrenaz, T., et al. A & A 703 (2025): A219.
[5] Iwanaka, T., et al. JGR: Planets 130.7 (2025): e2024JE008775.
[6] Rimmer, P., et al. The Planetary Science Journal 2.4 (2021): 133.
[7] Stolzenbach, A., et al. Icarus 395 (2023): 115447.
[8] Shao, W. D., et al. JGR: Planets 125.8 (2020): e2019JE006195.
[9] Shao, W. D., et al. The Planetary Science Journal 3.1 (2022): 3.
[10] Bierson, C. J., and Zhang, X. JGR: Planets 125.7 (2020): e2019JE006159.
[11] Stolzenbach, A., PaPy (Pathway analysis for Python) (1.0.0). Zenodo. (2025)
[12] Lehmann, R. Journal of atmospheric chemistry 47.1 (2004): 45-78.
[13] Maurice, M., et al. Icarus (2025): 116914.
How to cite: Díaz Segado, F., Stolzenbach, A., Lara, L. M., Martinez, A., Lefèvre, M., Lefèvre, F., and Lebonnois, S.: Sulfur dioxide in Venus’ middle atmosphere: determining its chemical pathways., Europlanet Science Congress 2026, The Hague, The Netherlands, 7–11 Sep 2026, EPSC2026-597, https://doi.org/10.5194/epsc2026-597, 2026.
Introduction
Unlike the other terrestrial bodies in the Solar System, Venus is shrouded in a thick, multi-layered cloud at an altitude ranging from 48 to 70 kilometers[1]. These clouds consist of droplets of liquid SO₂ (70–95% by mass) and H₂O, divided into three modes with radii of approximately 0.3, 1, and 2 micrometers, respectively[2].
The lack of in situ observations (only one in-situ profil of the cloud droplets characteristics[2]) means we have to actively try to model these clouds to understand them. The models developed so far are primarily 1D[3-7], and the few 2D and 3D models are restricted to simplified equilibrium schemes[8-11]. Here, we present the first 3D simulation of Venus's clouds using the Venus PCM[12-13], a global climate that includes chemistry, radiative transfer and dynamics, coupled with the microphysical scheme MAD-VenLA[14-16]. We use this opportunity to make comparison with Akatsuki UV observations.
Method
We coupled the MAD-VenLA model, developed by Guilbon[14], Määttänen[15] and Streel[16], with the Venus PCM. MAD-VenLA is a modal model that describes two particle modes with a lognormal shape and fixed standard deviation. It includes a homogeneous nucleation scheme[17], a simplified parametrization of heterogeneous nucleation, and Brownian coagulation, condensation, and evaporation[14-15]. Additionally, MAD-VenLA incorporates mode merging[18], which allows particles to be transferred from one mode to another. In its latest version, a sedimentation scheme has also been added[16].
Results
We will present the first 3D comparisons between and observations from previous missions.
For example, an ongoing study[19] of the Japanese Akatsuki mission's ultraviolet (UV) observations revealed different reflectivity patterns between sulfur dioxide (SO₂) at 283 nm and the unknown UV absorber at 365 nm at low latitudes. The averaged minimum reflectivity at 365 nm occurred ~2 hours earlier in local time than at 283 nm. Our simulations using the Venus PCM (Fig. 1) reveal the presence of a droplet layer situated in the afternoon at low latitude at 70 km, which could mask the unknown UV absorber below and alter the afternoon albedo, explaining the observations made. These droplets are the result of homogeneous nucleation episodes, which are allowed by the chemistry and vertical transport.
This highlights the need for 3D simulations in order to understand such processes.

Figure 1: Horizontral map of the integrated number of droplets from the top of the atmosphere to a specific altitude (resp. 80,75,70 and 65 km) after 2 venusian days.
References
- P. Mills, L. W. Esposito, Y. L. Yung, Geophys. Monogr. Ser. 176, 73–100 (2007).
- R. G. Knollenberg, D. M. Hunten, J. Geophys. Res. 85, 8039–8058 (1980).
- P. James, O. B. Toon, G. Schubert, Icarus. 129, 147–171 (1997).
- Imamura, G. L. Hashimoto, J. Geophys. Res. 103, 31349–31366 (1998).
- Yamamoto, M. Takahashi, J. Geophys. Res. 111, 2006JE002688 (2006).
- McGouldrick, E. L. Barth, Planet. Sci. J. 4, 50 (2023).
- Karyu et al., Planet. Sci. J. 5, 57 (2024).
- Lee, S. R. Lewis, P. L. Read, Icarus. 206, 662–668 (2010).
- Ando, M. Takagi, N. Sugimoto, H. Sagawa, Y. Matsuda, Journal of Geophysical Research: Planets, in press, doi:10.1029/2019JE006208.
- Karyu et al., Journal of Geophysical Research: Planets, in press, doi:10.1029/2022JE007595.
- Stolzenbach, F. Lefèvre, S. Lebonnois, A. Määttänen, Icarus. 395, 115447 (2023).
- Lebonnois, N. Sugimoto, G. Gilli, Icarus. 278, 38–51 (2016).
- Gilli et al., Icarus. 281, 55–72 (2017).
- Guilbon, thesis, Université Paris Saclay (COmUE) (2018).
- Määttänen, S. Guilbon, J. Burgalat, F. Montmessin, Advances in Space Research. 71,1116–1136 (2023).
- Streel, thesis, Sorbonne-Université (2025).
- Määttänen et al., JGR Atmospheres. 123, 1269–1296 (2018).
- Whitby, F. Stratmann, M. Wilck, Journal of Aerosol Science. 33, 623–645 (2002).
- R. L. S. E. Aliste Castillo et al., BACO-25 conference abstract (2025).
How to cite: Streel, N., Määttänen, A., Lefèvre, F., Stolzenbach, A., Aliste Castillo, R. L. S. E., and Lee, Y. J.: 3D Venus Cloud Modelling: the Venus Planetary Climate Model coupled with a microphysical model, first comparisons, Europlanet Science Congress 2026, The Hague, The Netherlands, 7–11 Sep 2026, EPSC2026-306, https://doi.org/10.5194/epsc2026-306, 2026.
Imaging of Venus in the ultraviolet-blue spectral range became a powerful tool to study the cloud top morphology, distribution of absorbing species and atmospheric dynamics (Titov et al. 2018). Recent imaging by the UVI instrument onboard JAXA Akatsuki mission significantly extended the gallery of the planet UV images (Yamazaki et al. 2018). The mission monitored the Venus cloud tops from equatorial orbit thus complementing earlier Venus Express observations from the polar orbit (Titov et al. 2011). Most importantly Akatsuki UVI camera had two narrow-band filters at 283 nm and 365 nm. The former was centred on the SO2 absorption feature with some contribution from the unknown UV absorber, while the latter sounded the spectral feature of the unknown UV absorber solely. Iwanaka et al. (2025) used these images to constrain the spatial and local time distribution of both absorbers at the cloud tops. In this talk we will present preliminary qualitative analysis of the UVI/ Akatsuki images in two areas. Firstly, we will compare the global cloud top morphology seen by UVI/Akatsuki and VMC/Venus Express at 365 nm. The views of Venus captured by the two spacecraft are highly complementary due to different orbits. Secondly, we will present preliminary comparative analysis of 283nm/ 365nm image pairs simultaneously captured by Akatsuki. This would allow constrain relative vertical distribution of sulfuric acid clouds, unknown UV absorber, and SO2 gas.
References
Titov et al. Clouds and hazes of Venus. Space Sci Rev (2018) 214:126. doi:10.1007/s11214-018-0552-z.
Yamazaki et al. Ultraviolet imager on Venus orbiter Akatsuki and its initial results. Earth Planets and Space (2018), 70(1), 23. doi:10.1186/s40623‐017‐0772‐6
Titov et al. Morphology of the cloud tops as observed by the Venus Express Monitoring Camera. Icarus (2011). doi:10.1016/j.icarus.2011.06.020
Iwanaka et al. Sulfur dioxide distribution at the Venusian cloud top retrieved from Akatsuki UV images. JGR: Planets (2025), 130, e2024JE008775. doi: 10.1029/2024JE008775
How to cite: Titov, D., Wang, Z., and Iwanaka, T.: Venus cloud top morphology: from VMC/Venus Express to UVI/Akatsuki, Europlanet Science Congress 2026, The Hague, The Netherlands, 7–11 Sep 2026, EPSC2026-774, https://doi.org/10.5194/epsc2026-774, 2026.
The atmosphere of Venus is entirely shrouded in a global, dense cloud deck with a vertical optical depth of 20–40 at visible wavelengths. This cloud system is the primary regulator of the planet’s radiative energy budget, a key driver of its extreme atmospheric super-rotation, and hosts an as-yet unknown ultraviolet (UV) absorber in its upper layer. While numerous studies by early mission characterized the morphology of Venus’s cloud tops, the structural properties of deep cloud layers, their vertical coupling with the upper cloud system, and their connection to large-scale atmospheric dynamics remain poorly constrained. This critical knowledge gap limits a holistic understanding of the Venusian atmospheric system.
In this work we present a preliminary analysis of Venus cloud morphology using multi-band observations by the European Space Agency (ESA) Venus Express mission. We employ a complementary dual-sounding approach to probe the vertical cloud structure.Daytime 0.35 μm UV images from the Venus Monitoring Camera (VMC) are used to map the spatial distribution of the unknown UV absorber at the cloud top (~65–70 km altitude), while nighttime observations in the 1.74 μm near-infrared (NIR) transparency window from the Visible and Infrared Thermal Imaging Spectrometer (VIRTIS) are used to characterize large scale morphology of the deep cloud (48-55 km altitude) and retrieve the total cloud opacity. Our analysis leverages full-orbit observations from the mission’s 24-hour polar orbit.
This work aims at revealing spatial coupling between morphology of the cloud-top UV features and deep cloud, clarify the polar vortex’s full-column vertical coherence, resolve the evolution of the global cloud morphology, and establish relation of the cloud morphology to the atmospheric circulation to further quantify cloud regulation of radiative energy balance and constrain the properties of the unknown UV absorber.
How to cite: Zhao, J. and Titov, D.: Venus Cloud Morphology: Vertical Coupling and Temporal Evolution from Venus Express Multispectral Imaging, Europlanet Science Congress 2026, The Hague, The Netherlands, 7–11 Sep 2026, EPSC2026-739, https://doi.org/10.5194/epsc2026-739, 2026.
Venus is shrouded in thick sulfuric acid clouds at altitudes of 47–70 km. Below the cloud base (~47 km), high temperatures cause sulfuric acid to evaporate completely, preventing liquid particles from persisting in the lower atmosphere. However, probes from multiple missions—including VeGa, Venera, and Pioneer Venus—have consistently detected a persistent aerosol layer below the cloud layer, known as the lower haze (e.g., Knollenberg & Hunten, 1980; Titov et al., 2018). These particles are critical to cloud formation, acting as condensation nuclei for the main cloud decks (e.g., James et al., 1997). Yet, for nearly five decades, their origin and composition have remained unknown, as previous models treated the haze as sulfur allotropes with fixed boundary conditions rather than simulating its formation.
In this study, we employ the Simulator of Particle Evolution, Composition, and Kinetics (SPECK) (Karyu et al., 2025) to model the lifecycle of Venusian clouds and aerosols, focusing on the role of meteoric smoke particles (MSPs) as an involatile core component. Our approach simulates the nucleation and condensation of sulfuric acid (H2SO4), water (H2O), and elemental sulfur (S8) without prescribing particle distributions at the lower boundary. The meteoric smoke particles with olivine composition are injected at the model top at 100 km as particles with a 1-nm radius. Given the large uncertainty in the meteoric influx at Venus, we performed a sensitivity analysis varying the MSP influx from 0 to 1000 tons day-1 around our 10 tons day-1 baseline derived by Carrillo-Sánchez et al. (2020).
Our results demonstrate that the lower haze layer is a direct consequence of the cosmic dust input. First, MSPs are scavenged by sulfuric acid droplets at high altitudes and transported downward via sedimentation. As these droplets cross the cloud base, H2SO4 evaporates, leaving behind residual MSP cores. Then, these involatile particles coagulate to form the observed lower haze. We find that an MSP influx of 3 to 300 tons day-1 accurately reproduces the effective radii (0.08–0.21 µm) reported by PV and Venera probes. This flux range encompasses terrestrial MSP injection flux between 5 and 60 tons day-1.
Furthermore, these MSP-derived aerosols may be a source of iron for the unknown UV absorber. Iron species, such as FeSO4 (Jiang et al., 2024) and FeCl3 (Egan et al., 2025), potentially formed in H2SO4 droplets, have been shown to have a similar UV absorption feature as the Venus cloud top. The MSP influx delivers metal species, including iron, to the atmosphere, which accumulate as the lower haze. A fraction of these iron-bearing particles can be transported upward by diffusion, where they are incorporated into the cloud droplets to form the UV-absorbing compounds. The EnVision mission will be an ideal opportunity to check this hypothesis by monitoring the behavior and distribution of the UV-absorbing materials.
The detail of this research can be found in Karyu et al. (2026) (https://doi.org/10.1038/s41550-026-02843-4).
References: Knollenberg & Hunten, 1980, J. Geophys. Res.; Titov et al., 2018, Space Sci. Rev.; James et al., 1997, Icarus; Karyu et al., 2025, Earth Space Sci; Carrillo-Sánchez et al., 2020, Icarus; Jiang et al., 2024, Sci. Adv.; Egan et al., 2025, ACS Earth Space Chem.; Karyu et al., 2026, Nat. Astron.
How to cite: Karyu, H., Kuroda, T., Määttänen, A., Mahieux, A., Viscardy, S., Terada, N., Robert, S., Vandaele, A. C., and Crucifix, M.: Cosmic Dust as a Source for the Venusian Lower Haze, Europlanet Science Congress 2026, The Hague, The Netherlands, 7–11 Sep 2026, EPSC2026-198, https://doi.org/10.5194/epsc2026-198, 2026.
Please decide on your access
Please use the buttons below to download the supplementary material or to visit the external website where the presentation is linked. Regarding the external link, please note that Copernicus Meetings cannot accept any liability for the content and the website you will visit.
Forward to presentation link
You are going to open an external link to the presentation as indicated by the authors. Copernicus Meetings cannot accept any liability for the content and the website you will visit.
We are sorry, but presentations are only available for conference attendees. Please register for the conference first. Thank you.
Introduction
Forthcoming missions to Venus are designed to provide new chemical data that will enhance our knowledge of Venus’ middle atmosphere chemistry. Central to this effort is ESA’s EnVision mission, which aims, among other objectives, to characterize sulphur-bearing trace species. Particularly SO2, which serves as the primary photochemical precursors for the formation of the Venusian clouds, predominantly composed of a H2O-H2SO4 binary solution.
Atmospheric modelling is essential to contextualize both past and future observations. The Venus Planetary Climate Model (Venus PCM) is a state-of-the-art 3D General Circulation Model (GCM) developed over the last 15 years that is capable of self-consistently simulating key dynamical and chemical features of Venus’ atmosphere, from the ground to the thermosphere [1,2,3,4]. Nonetheless, modelling the observed mesospheric SO2 vertical profile remains a significant challenge [4]. We investigate the mechanisms proposed by [5] driving the observed three order of magnitude depletion within the cloud layer, from 130 ppmv below the clouds to only 0.1 ppmv above the clouds.
Methods and results
We have implemented an in-droplet chemical set of reactions within the Venus PCM following [5]. This approach analyses how SO2dissolution into the cloud droplets and subsequent dissociation into ionic species successfully account for the steep vertical depletion of SO2. The dissolution of SO2 into the droplets is driven under the assumption of the presence of salts (e.g. NaOH, which is used as a proxy) in the clouds. The salts act as a pH buffer and enhance SO2 dissolution into the droplets. SO2 depletion is then governed by the cloud’s uptake capacity, itself determined by the salt concentration. While a reduced set of reactions was previously tested in the Venus PCM as an initial approach [6], this work implements the complete chemical processing following Henry’s Law and in-droplets’ ionic chemical reactions. Furthermore, we also evaluate the droplet sedimentation and the thermal evaporation of species at the cloud base.
We will show preliminary results from the first-time implementation of the full in-droplet chemistry model in the Venus PCM. We will analyse not only 1D vertical profiles, but also latitude-local time maps at different altitudes, discussing day and night differences and the well-known anticorrelation of SO2 and H2O. Finally, we will evaluate the implications of these results in the interpretation of future observations by the EnVision mission.
Acknowledgments: grant PRE2022-104364, funded by MCIN/AEI/10.13039/501100011033 and by FSE+; Severo Ochoa grant CEX2021-001131-S funded by MICIU/AEI/ 10.13039/501100011033; Program EMERGIA 2021 (EMC21 00249); Spanish MCIU, the AEI and EC-FEDER funds under project PID2021-126365NB-C21.
References:
[1] Lebonnois et al. 2010, JGR, Vol.115, Issue E6
[2] Gilli et al. 2021, Icarus, Vol. 366, 114432
[3] Martinez et al. 2024, Icarus, Vol. 415, 116035
[4] Stolzenbach et al. 2023, Icarus, Vol. 395, 115447
[5] Rimmer et al. 2021, Planet. Sci. J., Vol. 2, 133
[6] Mendi-Martos et al., Vol. 18, EPSC-DPS2025-1368, 2025
How to cite: Mendi-Martos, A., Stolzenbach, A., Gilli, G., Martinez, A., Lefèvre, F., Rimmer, P., Lebonnois, S., and Lara, L.: In-droplet sulphur chemistry in the Venus clouds with the Venus Planetary Climate Model, Europlanet Science Congress 2026, The Hague, The Netherlands, 7–11 Sep 2026, EPSC2026-821, https://doi.org/10.5194/epsc2026-821, 2026.
The Venera and Vega landers (active during the 1960’s-80’s) provided the first compositional data from the surface of Venus. These landers showed that the volcanic plains on Venus are comprised of alkaline and tholeiitic basalts, very similar in composition to terrestrial rocks (e.g., Kargel et al., 1993; Surkov et al., 1984, 1986) and it is believed that much of Venus’ surface (approximately 80%) constitutes similar material. However, emissivity measurements in the near-infrared (NIR) from the Galileo flyby of Venus and the Venus Express mission showed two distinct regions where emissivity changed significantly (Gilmore et al., 2015; Hashimoto et al., 2008). Hashimoto et al. (2008) proposed that the lower-emissivity regions must be from a low Fe felsic material, potentially a granite, given that the NIR is sensitive to Fe content. Laboratory emissivity measurements in the NIR performed by Helbert et al. (2021) confirmed that lower Fe rocks do indeed have a significantly lower emissivity at Venus temperatures (~460°C) compared to higher Fe basalts, though the cause of the differences is as-yet unconfirmed. Either the lower-emissivity rocks are a different igneous rock type, or the change results from the presence of alteration minerals from gas-rock interactions affecting the emissivity spectra of a basalt.
Numerous alteration experiments and thermodynamic modelling studies have been completed under a variety of Venus surface conditions (~460°C, 90 bars, CO2 and SO2 gas atmosphere) on basaltic rocks, glasses, and mafic minerals. These studies have shown that basalt mainly alters to carbonates, sulphates and Fe-oxides (e.g., Reid et al., 2024). Two of the more common minerals among these experiments are calcite (CaCO3) and anhydrite (CaSO4). The growth of these alteration minerals and layer thickness is dependent on cation diffusion rates, such that coatings on the basalt could help indicate relative age/freshness of a lava flow. The emissivity of these two minerals at room temperature is significantly lower than that of a basalt, therefore, a basalt with alteration minerals should result in a lower emissivity than a fresh basalt. This has been shown using radiative transfer models and mixing equations for basalt and anhydrite/hematite (Dyar et al., 2021), however, there is currently a lack of laboratory emissivity data for this process at Venus temperatures. Hence, as a first step toward understanding the spectroscopic characteristics of this alteration process, this study presents emissivity spectra of intimate mixtures of basalt and its alteration phases, calcite and anhydrite, when observed under Venus temperature conditions and compares them to spectra of unaltered basalt and felsic rocks.
Natural samples of an alkaline basalt, anhydrite and calcite, and a glass synthesised from the basalt were prepared with grain sizes of 250-300 μm and 300–350 μm, and mixed with either 50 wt% or 10 wt% basalt/basalt glass, with the remainder comprising anhydrite and/or calcite. All mixtures were prepared to weigh ~10 g and dried for ~24 hours at 110 °C to remove excess H2O. Additionally, a disc from the alkaline basalt was cut to produce a slab with a 5 cm diameter. Hemispherical reflectance and emissivity measurements were completed at the Planetary Spectroscopy Laboratory (PSL) at DLR, Berlin, in the VNIR range. Emissivity measurements were collected under vacuum (~0.7 mbar) with samples heated to temperatures ranging ~380 – 500°C using an induction system. Hemispherical reflectance measurements in a gold-coated hemispherical unit were also collected under vacuum and were completed prior to and after heating. The emissivity of a graphite slab was also collected at temperatures above and below those measured for the samples. The emissivity was then calibrated using the hemispherical reflectance measurements for corrections and the graphite slab as a black body.
The results of this work show that mixtures of basalt with calcite and/or anhydrite have a lower emissivity than basalt. Additionally, the emissivity values of these mixtures are distinct from felsic rocks which have a lower emissivity (~0.6-0.7; cf. Helbert et al., 2021) than the 50 wt% basalt mixtures. The basalt glass samples have a higher emissivity than their basalt counterpart; this may be due to the presence of phenocrysts in the basalt, scattering differences, or oxidation of the glass. The emissivity of the mixtures shows similar patterns and values, which may make it difficult to distinguish proportions of calcite versus anhydrite.
The upcoming missions to Venus, including VERITAS (NASA) and EnVision (ESA), will be equipped with NIR spectrometers to measure the surface. The results of this work highlight the need for emissivity to be collected at Venus temperature on a variety of minerals and mineral mixtures such that the measurements from these missions can be accurately interpreted.
References:
Dyar, M.D., et al. (2021) Icarus 358, 114139.
Gilmore, M.S., et al. (2015) Icarus 254, 350–361.
Hashimoto, G.L., et al. (2008) JGR Planets 113, 2008JE003134.
Helbert, J., et al. (2021) Science Advances 7, eaba9428.
Kargel, J.S., et al. (1993) Icarus 103, 253–275.
Reid, R.B., et al. (2024) JGR Planets 129, e2024JE008485. h
Surkov, Y.A., et al. (1984). JGR Solid Earth 89, B393-B402.
Surkov, Y.A., (1986) JGR Solid Earth 91, E215–E218.
How to cite: Jennings, L. A., Alemanno, G., Maturilli, A., Plesa, A.-C., Adeli, S., Renggli, C., Dyar, M. D., and Klemme, S.: Emissivity from the surface of Venus: the effects of alteration products calcite and anhydrite, Europlanet Science Congress 2026, The Hague, The Netherlands, 7–11 Sep 2026, EPSC2026-847, https://doi.org/10.5194/epsc2026-847, 2026.
Introduction: Venus’s surface composition remains fundamentally unknown, and it is a missing piece about the planet’s evolution. Venus’s permanent cloud cover prevents remote sensing of the surface in visible wavelengths. Nonetheless, surface thermal emission from Venus’s nightside becomes detectable in the CO2 atmospheric windows, notably at 1.02, 1.11, and 1.18 µm [1 – 3]. Atmospheric gaseous absorption/emission attenuates this surface emission, but the surface component dominates the 1.02 and 1.11 µm windows, accounting for 95% and 60% of the total observation, respectively, and 40% in the stronger 1.18 µm window [1]. Surface observations can only be performed on the nightside because reflected direct sunlight from Venus’s dayside dampens the surface contribution [4]. Using IRTF/SpeX observations of the nightside of Venus, we analyse the contribution from the surface emission to investigate potential trends in surface emissivity and surface composition.
Previous ground-based observations: Low-to-moderate resolution spectral image cubes of Venus’s nightside were obtained using the Anglo-Australian Telescope’s infrared imaging spectrometer IRIS to resolve surface thermal emission [1]. Data were affected by limited longitudinal coverage, instrumental issues in treating scattered light, and daytime observations, which partially limited the interpretation of windows shortward of 1.18 µm due to scattered sunlight by Earth’s atmosphere. However, [1] demonstrated that it is possible to create synthetic radiance maps by using the correct topographic elevation and observing angle.
Method: The SpeX instrument acquired Venus observations in the period from 2001 to 2025. The observed nightside radiation is corrected for stray light from Venus’s dayside, thermal emission from the lower atmosphere of Venus, sky background, wavelength calibration, telluric absorption, limb darkening, intrinsic variability in cloud opacity, cloud reflection and atmospheric absorption/emission [1, 5 – 7] and surface temperature [8]. The horizontally uniform thermal structure means that topography controls emission. By using an adiabatic lapse rate, thermal emission can be corrected using NASA/Magellan topography [1, 4, 6, 7, 9 – 11]. The atmospheric contribution can be successfully estimated using dedicated radiative transfer codes, e.g., SMART, which has been extensively used by [1, 5, 12]. By scanning the SpeX slit multiple times across Venus’s disk, we obtained the necessary spatial coverage to map the surface with a spatial resolution ranging from 250 to 400 km (under conservative seeing of 1 arcsec). Geometric correction is applied to retrieve latitude and longitude coordinates for each pixel within the disk and to reconstruct an accurate representation of the Venus disk as seen in each CO2 atmospheric window. We present here a subset of this SpeX dataset obtained for Venus, using a series of observing geometries. The dataset uses the high-throughput low-resolution PRISM mode of the IRTF/SpeX instrument, covering wavelengths from 0.8 to 2.5 µm, with a 60 arcsec slit (as seen in Figure 1), with a nominal resolving power of R ~200 (or R~140 at 1.18 µm).
Comparison with laboratory emissivity data: Measurements of Venus analogue materials have been performed at the Planetary Spectroscopy Laboratory (DLR, Germany) under Venus-like surface conditions [13]. Spectral shifts are dominated by temperature, while pressure and grain size have negligible impacts [14]. Mafic (basalts) and felsic (granitic) rocks have very distinct emissivity values under Venus-like conditions (see Figure 2). Mafic rocks have much higher emissivity than felsic counterparts across Venus’s CO2 atmospheric windows. The emissivity difference between these two families is larger than the ±4% uncertainties due to instrumental and atmospheric effects (shaded in Figure 2), making them distinguishable in ground-based observations [5, 15]. These works establish that it is possible to relate Venus’s surface thermal emission to mineralogy.
Results: Analysis of the IRTF/SpeX data shows that, even under daytime conditions, the 1.02 and 1.11 µm windows are observable (see Figure 1), enabling radiative transfer corrections. These require the aforementioned corrections before they can be translated into radiance maps according to the method in [1]. The resolving power is sufficient to disentangle the contributions from mafic and felsic rocks, while the spatial resolution is sufficient to resolve the highlands signal from that of the plains, allowing us to explore large-scale trends in surface composition. These will be explored by comparing radiance maps from the different CO2 atmospheric windows.

Fig. 1. Observing data from Venus IRTF/SpeX (60 arcsec slit) daytime spectra with Venus’s CO2 atmospheric windows in red. Other atmospheric effects are shown in the figure. The image is obtained by subtracting two positions of the slit acquisition over Venus’s disk.

Fig. 2. Synthetic emissivity [14] under Venus-like conditions for mafic (blues) and felsic (reds) minerals. The black lines depict Venus’s CO2 atmospheric windows. Data kindly provided by DLR (private communication).
References: [1] Meadows, V. S. & Crisp, D. (1996). J Geophys Res Planets 101, E2, 4595; [2] Allen, D. A. & Crawford, J. W. (1984). Nature 307, 222; [3] Pollack, J. B., et al. (1993). Icarus 103, 1; [4] Helbert, J., et al. (2008). Geophys Res Lett 35, 11; [5] Hashimoto, G. L. & Sugita, S. (2003). J Geophys Res Planets108, E9, 5109; [6] Mueller, N., et al. (2008). Geophys Res Planets 113, E00B17; [7] Kappel, D., et al. (2016). Icarus 265, 42-62; [8] Seiff, A., et al. (1985). Adv. Space Res 5, 11, 3-58; [9] Hashimoto, G. L. (2008). Geophys Res Planets 113, E00B24; [10] Smrekar, S. E., et al. (2010). Science 328, 605; [11] Basilevsky, A. T., et al. (2012). Icarus 217, 434; [12] Arney, G., et al. (2014). J. Geophys Res Planets 119, 8, 1860-1891; [13] Helbert, J., et al. (2017). In Venus Modeling Workshop 2022, 8023; [14] Helbert, J., et al. (2021). Sci Adv 7; [15] Treiman, A. H., et al. (2021). Planet Sci J 2, 2, 43.
Funding: DQ acknowledges this work to be supported by FCT - Fundação para a Ciência e Tecnologia, I.P. by project reference and DOI identifier 10.54499/2023.05220.BD
How to cite: Quirino, D., Machado, P., Young, E. F., Bullock, M., Dias, J., Brasil, F., Duarte, J. C., and Green, J. M.: Surface emissivity from the CO2 atmospheric windows at Venus using the NASA Infrared Telescope Facility (IRTF) SpeX spectrograph, Europlanet Science Congress 2026, The Hague, The Netherlands, 7–11 Sep 2026, EPSC2026-1069, https://doi.org/10.5194/epsc2026-1069, 2026.
The Magellan radar space mission [1] produced the largest, highest-resolution, most accurate survey of the surface of Venus to date. During the first cycle of the mission, its unique latitude-varying radar observation geometry allowed for the revisit of morphologically-equivalent terrains with a wide array of incidence angles, both in synthetic aperture radar (SAR) mode and in altimetry mode [2,3,4,5]. With the appropriate constraints and processing steps, this enables the reconstruction of the full scattering behaviour (a scattering curve) of distinct rock units [6] across approx. 0-50 degrees of local incidence, offering a unique opportunity to measure the mean radiometric signature of different terrain formations on Venus and, for the first time, map and characterise wavelength-scale surface roughness across the entire planet. Additionally, the derived scattering curves represent the reference scenarios that will enable radiometric comparison of Magellan SAR images with SAR data from upcoming Venus orbiters, even if the acquisition geometry between sensors for a specific target differs significantly [7,8].
To perform this study, we have built a comprehensive method that blends SAR and altimetry backscatter, postprocessed Magellan topography, Magellan radiometry, and geological data from Venus; the method incorporates a physically-constrained stochastic model of uncertainty for each individual backscatter measurement, and provides the framework for scattering models and constraints to appropriately fit the data. Our scattering curve results have been extensively tested against different cycle 1 and cycle 2 SAR and altimetry data to investigate the heterogeneity and/or isotropy of the measured surfaces, and to internally validate the radiometric consistency (absolute and relative) of the observed backscatter estimates.
In this work, we present insights into our findings regarding surface roughness properties for each terrain formation. We discuss the geological interpretation of the results, linking the scale of the retrieved mean roughness with the most-likely surface modification processes. In particular, we demonstrate the separability of the scattering characteristics of rift zones and Tessera terrain from the several plain units across the planet. Additionally, we globally constrain the predicted backscatter values for the forthcoming SAR missions to Venus. This is a critical step towards robust mission-to-mission SAR image intercomparison, enabling inter-mission SAR change detection from a radiometric perspective [9,10], and a key input to consolidate the on-going radar design, operation and data processing for these missions.

Figure 1. Example summary of diffuse scattering results from Magellan SAR backscatter data of Bell Formation (lava flow) units and Tessera terrain.
[1]. Saunders, R. S., et al. "Magellan mission summary." Journal of Geophysical Research: Planets 97.E8 (1992): 13067-13090.
[2]. Ford, John P. Guide to Magellan image interpretation. National Aeronautics and Space Administration, Jet Propulsion Laboratory, California Institute of Technology, 1993.
[3]. Campbell, Bruce A. Use and presentation of Magellan quantitative data in Venus mapping. No. 95-519. US Geological Survey,, 1995.
[4]. Ford, Peter G., and Gordon H. Pettengill. "Venus topography and kilometer‐scale slopes." Journal of Geophysical Research: Planets 97.E8 (1992): 13103-13114.
[5]. Tyler, G. Leonard, et al. "Scattering properties of the Venusian surface: Preliminary results from Magellan." Journal of Geophysical Research: Planets 97.E8 (1992): 13115-13139.
[6]. Ivanov, Mikhail A., and James W. Head. "Global geological map of Venus." Planetary and Space Science 59.13 (2011): 1559-1600.
[7]. Gallardo i Peres, G., P. J. Mason, and R. Ghail. "An End-To-End Inter-Mission Change Detection Algorithm: Between Magellan and Future VenSAR and VISAR Radar Imagery on Venus." 55th Lunar and Planetary Science Conference. Vol. 3040. 2024.
[8]. Gallardo i Peres, Gerard, et al. "A generalized beta prime distribution as the ratio probability density function for change detection between two SAR intensity images with different number of looks." IEEE Transactions on Geoscience and Remote Sensing 62 (2024): 1-14.
[9]. Gallardo i Peres, G., 2022. A proposed change detection method in the framework of the VERITAS & EnVision radar missions to Venus. MSc Thesis. Denmark Technical University.
[10]. Campbell, Bruce A., and Scott Hensley. "Detecting surface change on Venus from Magellan and VERITAS radar images." Icarus 407 (2024): 115773.
How to cite: Gallardo i Peres, G., Mason, P., Ghail, R., Wilson, C., Straume-Lindner, A. G., Granados, A., and Roca i Aparici, M.: Radar Scattering of Venus Terrains: Characterising Surface Roughness in Preparation for the Decade of Venus, Europlanet Science Congress 2026, The Hague, The Netherlands, 7–11 Sep 2026, EPSC2026-691, https://doi.org/10.5194/epsc2026-691, 2026.
Introduction
Tessera terrains represent the oldest preserved units on the Venusian surface, covering approximately 8% of the planet [1]. The largest tessera occurrences correspond to crustal plateaus, which are elevated, quasi-circular regions with steep edges and flat tops [2]. Geophysical observations, including small gravity anomalies, low gravity-to-topography ratios, and shallow apparent compensation depths (ADC), suggest that these plateaus are supported by a thickened crust [3]. However, topographic elevations vary across regions; for instance, Ovda Regio exceeds 4 km above the planetary datum, while Alpha Regio rises to ~2 km [4]. Tessera terrain is defined by complex structural patterns, resulting in high radar brightness due to surface roughness [5]. The most penetrative fabric consists of ribbons, which are sets of long, narrow grabens typically spaced 1-5 km apart [6,7]. Deciphering ribbon evolution is essential for understanding the first recorded tectonic deformations of the Venusian lithosphere. This study presents a structural analysis of the morphology of individual ribbon-bounding faults and uses the results to estimate regional extensional strain caused by ribbons across Ovda and Alpha Regio.
Morphological Constraints on Fault Geometry
This study surveyed 130 normal fault scarps across eight tessera regions using NASA Magellan SAR data from Cycle 1 imagery. Analyzing apparent scarp width against radar incidence angle revealed a critical inflection point where scarp widths reach a minimum within an incidence angle range of 33º to 36º. This inflection point is significant because theoretical radar geometry indicates that it can be explained by the transition from radar layover, where the topographic slope is greater than the incidence angle, to radar foreshortening, where the slope is less than the incidence angle [8]. This provides a robust constraint indicating that the current slope of ribbon scarps globally lies within the range of 33º to 36º. This finding was independently validated using Cycle 1 and 3 images to measure radar distortions on 29 scarps in Ovda Regio, yielding fault scarp slopes of 33.9º ± 1.4º via radar parallax. These values are consistent with the 36.4º ± 1.2º slopes reported for normal faults developed on Venusian volcanic plains [9]. We also estimated a representative average height for these ribbon-bounding faults of 396.2 m, representing the graben depth. Assuming a standard fault dip of ~60º the calculated average horizontal extension, or heave, is approximately 228.7 m per fault. Because these consistently shallow slopes (roughly 35°) are much lower than the 60º dip expected for fresh Andersonian normal faults, they provide clear evidence of extensive post-formation scarp degradation.
Ribbon Regional Strain and Geodynamic Implications
Ovda Regio and Alpha Regio were subdivided into a 200x200 km grid where strain calculations were performed. Within each cell, we targeted the zones with highest density of normal faults to estimate the maximum tectonic extension accommodated by ribbons. We used the representative average fault throw and heave derived from our structural analysis, assuming pure dip-slip kinematics and initial fault dip of 60º. Total extension was computed along transects perpendicular to each fault set and, in regions where two distinct graben orientations intersected, calculating the cumulative strain from both sets. These regional strain values were visualized using deformation ellipses, where the size and color intensity represent the magnitude of stretching (Fig. 1). This regional structural analysis revealed fundamentally different extensional regimes. Ovda Regio exhibits a highly heterogeneous structural pattern with radial and concentric ribbon sets, characterized by strong spatial variability and central elevated regions largely devoid of extensional structures. In contrast, the smaller Alpha Regio displays a pervasive fabric of mutually orthogonal ribbons accommodating more homogeneous extension across the entire plateau.

Figure 1: Finite strain distribution across (a) Ovda Regio and (b) Alpha Regio. The orientation of the major axis indicates the principal direction of strain, while ellipse size and color intensity scale with the magnitude of the stretching value (s). (c) Normalized frequency distribution of the areal stretch (s) for Ovda Regio (red bars) and Alpha Regio (blue bars). Overlapping areas are shown in purple. The x-axis represents the magnitude of the stretch (s), and the y-axis represents the normalized frequency of occurrence within the study areas.
We have compared the areal stretch with crustal thickness at each point of the grid (Fig. 2). The data revealed high dispersion, particularly in Ovda Regio, where the greater scatter reflects a heterogeneous transition from areas with no extension to highly stretched zones. Alpha Regio displays a more homogeneous strain pattern, possibly reflecting more uniform lithospheric properties associated with a small crustal plateau. Various tectonic and magmatic processes that contribute to crustal thickening or thinning explains this scattered distribution, which precludes a simple statistical correlation between these parameters. This study establishes ribbons as quantitative markers of the divergent tectonic evolution of Venusian crustal plateaus by using fault-scale geometries to quantify plateau-scale strain.

Figure 2: Correlation between crustal thickness (Tc) and areal stretch (s) calculated for each 200x200 km grid cell. Red circles represent Ovda Regio and blue circles represent Alpha Regio. Tc values are based on the global gravity-topography inversion model from (a) [10] and (b) [11].
Bibliography
[1] Ivanov, M.A., Head, J.W. (1996). JGR, 101, 14861-14908.
[2] Hansen, V.L., Banks, B.K., Ghent, R.R., (1999). Geology 27, 1071-1074.
[3] Grimm, R.E. (1994). Icarus, 112, 89-103.
[4] Bindschadler, D.L., Schubert, G., Kaula, W.M. (1992). JGR, 97, 13495-13532.
[5] Barsukov, V.L., et al. (1986). JGR, 91, D378-D398.
[6] Hansen, V.L., Willis, J.J. (1996). Icarus, 123, 296-312.
[7] Hansen, V.L., Willis, J.J. (1998). Icarus, 132, 321-343.
[8] Connors, C. (1995). JGR, 100, 14361-14381.
[9] Connors, C.D., Suppe, J. (2001). JGR, 106, 3237-3260.
[10] Maia, J., Wieczorek, M.A. (2022). JGR: Planets, 127, e2021JE007028.
[11] Jiménez-Díaz, A., et al. (2015). Icarus, 260, 215-231.
How to cite: Álvarez-Lozano, J., Romeo, I., Jiménez-Díaz, A., Uzkeda, H., Byrne, P. K., and Ruiz, J.: Quantifying Tectonic Extension in Venusian Tesserae: From Fault Scarp Geometry to Regional Strain Analysis, Europlanet Science Congress 2026, The Hague, The Netherlands, 7–11 Sep 2026, EPSC2026-48, https://doi.org/10.5194/epsc2026-48, 2026.
We analyzed the relative emissivity of several distinct and extensive surface units portrayed in the global geological map of Venus using the new release of the relative emissivity map derived from the VMC/ Venus Express night side imaging at 1 micron. Specifically, we analyzed the emissivity of tessera and the most widespread unit of regional plains. There is some circumstantial evidence that tesserae may represent massifs of non-basaltic, granite-like materials while regional plains are undoubtfully composed of basaltic lava flows. To characterized these units, we have selected massifs of tessera and fields of regional plains in two longitudinal zones: 60-120W and 120-150E. These include tesserae at the eastern flank of Beta Regio, in Thetis Regio and north of it. We analyzed 16 tesserae massifs that comprise ~5% of the total tessera population. The tesserae relative emissivity values vary from 0.25 to 0.63. This range is almost completely overlapping with the emissivity values range for regional plains, from ~0.31 to ~0.64. The emissivity values of tessera appear to form three clusters. The lowest values, 0.25-0.27, characterize tessera in Thetis Regio and its immediate surroundings (2 massifs). The intermediate values, 0.30-0.50, are typical almost for all other massifs. The highest value of ~0.63 occurred in one tessera northward of Thetis at the edge of reliable emissivity data coverage. The low-emissivity tesserae are topographically high (mean elevation is 3.92±0.08 km), whereas all other massifs are at significantly lower elevations (1.95±0.44 km). The low surface emissivity on tesserae might indicate their non-basaltic (granite) composition. However, since the studied tesserae are elevated terrains, the retrieved low emissivity could also result from uncertainties in the model of the lower atmosphere. The emissivity values for the rest of the analyzed tesserae do not provide any supporting evidence for their non-basaltic composition.
How to cite: Ivanov, M., Titov, D., and Basilevsky, A.: Relative 1 micron emissivity of tesserae and regional plains from the Venus Monitoring Camera observations, Europlanet Science Congress 2026, The Hague, The Netherlands, 7–11 Sep 2026, EPSC2026-1041, https://doi.org/10.5194/epsc2026-1041, 2026.
ESA's EnVision mission will deliver some of the first new high-resolution radar maps of Venus since Magellan, with the VenSAR instrument operating in HH/HV dual-polarisation S-band at 30 m and 10 m resolutions [1]. Venus' surface is dominated by volcanic terrain [3], so understanding what the new missions may 'see' requires analysis of radar signatures at barren, volcanic terrains on Earth. The Askja volcanic system in Iceland is well-suited to isolating surface-roughness effects on radar backscatter [2]: basaltic composition, minimal topography and vegetation cover, and accessibility for ground-truth validation [6,7]. We address whether radar can be used to differentiate, provide age constraint, and characterise the emplacement and modification of volcanic surfaces, and whether these signatures are preserved at VenSAR specifications.
Seven lava flow age units erupted from the Askja volcano, ranging in age from the 1961 Vikrahraun to >7,000 BP, were characterised using fully polarimetric Synthetic Aperture Radar (SAR) data acquired using the DLR’s F-SAR system for NASA JPL and the VERITAS team in August 2023 [4,5]. These datasets include X-band (3.1 cm), S-band (9.2 cm), and L-band (22.6 cm) at 2 m spatial resolution. Flow units have been mapped using S-band HH radar imagery, stratigraphic relationships, and field data; absolute ages are from the ÍSOR digital geological database [9] and Sæmundsson et al. [10,11] (Figure 1).
Figure 1. Geological map of the Askja volcanic system showing the seven flow units examined in this study [9-11].
Across the Askja flow sequence, mean S-band HH γ0 decreases systematically with flow age. The 1961 Vikrahraun flow has a mean γ0 of -7.0 dB; the >7,000 BP Shield Lavas reach -14.0 dB (Figure 3). This backscatter decrease is driven by post-emplacement weathering, smoothing, and mantling (Figure 2). The 5th percentile of the per-pixel distribution drops 8.7 dB across the age sequence; the 95th percentile drops only 4.6 dB. Weathering therefore smooths the smoothest regions preferentially. Backscatter also decreases with increasing incidence angle (10-15 dB decrease from 10° to 80°), consistent with typical radar scattering behaviour from rough surfaces.
Figure 2. Three end-members of the Askja chronosequence (1961 Vikrahraun, 2900-4500 BP, and >6100 BP) shown as paired Sentinel-2 optical (left) and F-SAR S-band γ0 HH at 2 m (right).

Figure 3. S-band HH γ0 versus flow age at three resolutions: F-SAR 2 m (blue), VenSAR 10 m (orange), VenSAR 30 m (red). Power-law fits with 95% Monte Carlo confidence intervals; inset gives dynamic range and retention per cell.
Wavelength comparison reveals progressive increase in age-discrimination dynamic range with wavelength. X-band, available only at VV polarisation, shows the smallest dynamic range (5.64 dB). S-band HH gives 6.07 dB versus 9.59 dB at L-band HH (8.49 vs 11.60 dB at HV). Polarimetric analysis differentiates surface scattering mechanisms and flow morphologies. Smooth pāhoehoe and mantled surfaces produce high HH and HH/HV ratios, reflecting predominantly single-bounce surface scattering. Rough a'ā flows produce high HV backscatter and large volume-scattering decomposition components: the clinker layer of angular rubble clasts acts as a randomly oriented scattering volume, generating multiple-bounce returns that decompose as volume power.
Differentiation between pāhoehoe and a'ā facies within a single flow appears in the decomposition, not in the raw intensity. Following the facies-separability protocol of Tolometti et al. [12], dual-pol Mascolo-Cloude m·v [8] matches or slightly exceeds quad-pol Freeman-Durden P_v [13] in discriminating Event 2 a'ā from pāhoehoe within Vikrahraun 1961 (Figure 4). Polarimetric facies discrimination is most powerful on young, well-preserved flow surfaces.

Figure 4. Dual-pol decomposition [8] (R = ms, G = mv, B = ms/mv) of Vikrahraun 1961 at 2 m, 10 m, and 30 m. Coloured polygons mark a'ā and pāhoehoe facies, classified following Blasizzo et al. [14]. Per-flow facies separability following Tolometti et al. [12]: MC m·v: O = 0.84, H = 2.6×10⁴; FD P_v: O = 0.89, H = 2.0×10⁴.
To address whether these signatures will be mappable in images captured by VenSAR, the 2 m F-SAR S- and L-band covariance was degraded via a slant-range pipeline: incoherent multilook, Gaussian filtering to the target resolution, Gamma speckle at the specified looks (16 at 30 m, 8 at 10 m), and exponentially-distributed thermal noise at the -20 dB NESZ specification. S-band HH retains 79% of the age-discrimination dynamic range at VenSAR 30 m (1.30 dB loss out of 6.07 dB) and 86% at 10 m (0.87 dB loss); regression slope flattens by 16% and 13% respectively. The HV channel is NESZ-limited: only 49% retention at 30 m and 51% at 10 m, with cross-pol signal on flows older than c.5,000 BP sitting within a few dB of the -20 dB floor. The 10 m mode does not rescue HV because NESZ is per-pixel rather than ensemble-averaged. The same asymmetry holds at L-band (74% HH, 44% HV retention at 30 m), indicating the mechanism is wavelength-robust. Quad-pol and dual-pol products at 30 m agree to within ±0.015 dB on per-flow γ0 statistics; VenSAR's HH/HV mode therefore preserves both the age-discrimination signal and the within-flow facies differentiation accessible to fully polarimetric F-SAR.
Age-backscatter correlations provide a quantitative dating framework, while polarimetric analysis enables morphological and textural discrimination. For VenSAR specifically, HH at 30 m and 10 m is optimal for age discrimination across the 60–7,000-year range, while HV is optimal for morphology discrimination.
References: [1] EnVision Red Book, ESA-SCI-DIR-RP-003, 2023; [2] Adeli et al., 2023; [3] Brossier et al., 2020; [4] Horn et al., 2017; [5] Keller et al., 2024; [6] Mason et al., 2024; [7] Raguso et al., 2025; [8] Mascolo, Cloude & Lopez-Sanchez, 2021, IEEE TGRS; [9] ÍSOR, 2024, Digital Geological Database of Iceland; [10] Sæmundsson et al., 2012, Geol. Map N. Volcanic Zone (N. Part), 1:100,000, ÍSOR; [11] Sæmundsson et al., 2015, Geol. Map N. Volcanic Zone (S. Part), 1:100,000, ÍSOR; [12] Tolometti et al., 2022, JGR Planets 127(6); [13] Freeman & Durden, 1998, IEEE TGRS 36(3); [14] Blasizzo et al., 2022, Earth Planets Space 74:168.
How to cite: Davidova, N., Gallardo i Peres, G., Ghail, R., Moreira, A., Jaeger, M., Benedikter, A., and Mason, P.: Scattering Properties of Lava Flows: Insights from Askja, Iceland, in support of EnVision mission science development, Europlanet Science Congress 2026, The Hague, The Netherlands, 7–11 Sep 2026, EPSC2026-918, https://doi.org/10.5194/epsc2026-918, 2026.
Please decide on your access
Please use the buttons below to download the supplementary material or to visit the external website where the presentation is linked. Regarding the external link, please note that Copernicus Meetings cannot accept any liability for the content and the website you will visit.
Forward to presentation link
You are going to open an external link to the presentation as indicated by the authors. Copernicus Meetings cannot accept any liability for the content and the website you will visit.
We are sorry, but presentations are only available for conference attendees. Please register for the conference first. Thank you.
Introduction and motivation
The surface of Venus, our closest yet strikingly different planetary neighbor, has not been observed from orbit for 30+ years, since the Magellan mission, whose radar operated at 2.4 GHz (12.6 cm wavelength). This long observational gap will soon end thanks to the selection, in 2021, of two new radar missions : NASA’s VERITAS mission with VISAR (7.9 GHz, 3.8 cm) and ESA’s Envision mission with VenSAR/EuroSAR (3.2 GHz, 9.5 cm).
VenSAR/EuroSAR, contrary to VISAR, includes a passive radiometry mode designed to measure the microwave thermal emission from the surface of Venus. In its radiometry mode, as a baseline, it will operate in a nadir or near-nadir viewing geometry but opportunistic off-nadir horizontal and vertical (H&V) polarized measurements will be performed in specific regions of interest (RoIs).
Among these RoIs are several regions, primarily located at high elevations, that exhibit anomalously low emissivity in Magellan observations. These values have been interpreted as evidence for extremely high dielectric permittivity (up to ~80) [e.g., 1,2] linked to the presence of very unusual minerals (e.g., ferroelectric substances [e.g., 3,4]), due to the cold trapping of exotic volatile species, or yet unidentified weathering reactions. Alternatively, low emissivity may result from strong small-scale roughness or from a low-loss substrate of moderate permittivity where volume scattering dominates [1]. Off-nadir polarized radiometry from EnVision will help discriminate between these scenarios by constraining effective permittivity and separating volume scattering from roughness effects.
In this work, we analyze the limited polarized radiometry data from the Magellan mission to prepare for the scientific exploitation of the Envision VenSAR/EuroSAR polarimetric radiometry experiments. We focus on observations over Ovda and Beta Regios, two prominent examples yet completely different of highland regions characterized by anomalously low emissivity, with Ovda being tessera-dominated and Beta being volcano-dominated.
Magellan radiometry data and method
The Magellan radar mapped the surface of Venus at 12.6 cm over three cycles from September 1990 to September 1992. Data were acquired from a near-polar elliptical orbit, primarily in H-polarization, at incidence angles of 15°-45°, using a left-looking geometry during cycles 1 and 3 and a right-looking geometry during cycle 2. By mission end, ~98% of the surface had been mapped in both active and passive modes.
In its passive operating mode, the Magellan radar functioned as a microwave radiometer, recording the surface brightness temperature, which can be directly converted into emissivity. To first order, emissivity is controlled by the permittivity of the surface, itself primarily related to the bulk composition and density of the surface material. It can therefore be used to discriminate between different surface units.
Planetary surface materials typically exhibit permittivities between 3 and 10. On Venus, Magellan H-polarized emissivity data suggest that the lower end of this range corresponds to low-density rock powders [5], while the extensive plains show values of 4.0–4.5, consistent with moderately dense basaltic material. As previously mentioned, Magellan also identified several high-elevation regions with anomalously low emissivity, generally interpreted as evidence for unusually high permittivity.
Though the Magellan data were collected primarily in H-polarization, a small number of orbits were collected with V polarization. Co-located H and V data can be used to derive the Degree of Polarization (DoP), defined as
where and denote the horizontally and vertically polarized emissivities, respectively. The DoP is generally less sensitive to surface roughness than either individual emissivity component and can be used to provide an independent estimate of the permittivity through comparison with emissivity models (Fig. 1).
For this work, (i) we identified all available co-located H- and V-polarized radiometry observations, (ii) rasterized these data onto a common spatial grid with a resolution of 0.1° in latitude and longitude (about 10 km at the equator), (iii) constructed maps of the DoP (Fig. 2a), and (iv) estimated the surface permittivity for each pixel by inverting the White and Cogdell (1973) model [6] (Fig. 2b). This model relates the DoP to permittivity and large-scale surface roughness (expressed as rms slope) for rough planetary surfaces, more specifically Kirchhoff-like surfaces without small-scale roughness or volume scattering effects. The retrieved permittivity values can then be compared with the H-polarized emissivity measurements to quantify the extent to which the Venusian surface departs from an ideal Kirchhoff surface.
Results and future work
Fig. 1 shows that the measured DoP follows the expected trend with local incidence angle for permittivities of approximately 3-4, while also revealing regions of high permittivity. Fig. 2a displays the DoP map obtained from co-located polarized measurements acquired over Ovda Regio. Elevated DoP values are clearly associated with Ovda Regio, indicating higher local permittivity and confirming the expected correlation between low H-polarized emissivity and high DoP. Fig. 2b presents the retrieved permittivity values as a function of altitude in Ovda Regio. It confirms the presence of exceptionally high permittivity values in this region as well as the decrease of the permittivity at the highest elevations. Similar results will be shown and discussed for Beta Regio and compared to the backscatter values measured in the active mode of the radar.

Fig. 1: Measured DoP (black dots) as a function of the incidence angle compared to predictions from the White and Cogdell (1973) model for different values of permittivity ε and a rms slope of 15°.

Fig. 2: (a) Map of the DoP around Ovda Regio overlaid on the Magellan H-polarized emissivity mosaic. (b) Estimated permittivity as a function of the altitude in the Ovda Regio (for an assumed rms slope of 15°).
1. Arvidson et al., 1991, New Series 252, 270- 275
2. Pettengill et al, 1992 J. Geophys. Res. 97(E8):13067–13090
3. Shepard et al., 1994, Geophys. Res. Lett. 21-6, 469-472
4. Treiman et al., 2016, Icarus 280, 172-182
5. Campbell and Campbell, 1992, J. Geophys. , 97, 16293-16314
6. White and Cogdell, 1973, Moon 6, 235–249
How to cite: Le Gall, A., Menard, R., Lanoix, L., Ganesh, I., Byrne, P., Herrick, R., Margot, J.-L., and Jessup, K.: Polarized microwave radiometry observations of Ovda and Beta Regios : Insights into Venus’ surface composition and texture, Europlanet Science Congress 2026, The Hague, The Netherlands, 7–11 Sep 2026, EPSC2026-799, https://doi.org/10.5194/epsc2026-799, 2026.
How to cite: Ascensão, J., Maia, J., Cascioli, G., and Plesa, A.-C.: Investigating the Viscosity Structure of Venus, Europlanet Science Congress 2026, The Hague, The Netherlands, 7–11 Sep 2026, EPSC2026-400, https://doi.org/10.5194/epsc2026-400, 2026.
INTRODUCTION
Despite its similarities to Earth in mass, radius and distance to the Sun, Venus stands out by its high surface temperatures, dense CO2-dominated atmosphere, and the lack of clear evidence of large-scale plate tectonics. Its young surface, covered by more than 85,000 volcanic features (Hahn & Byrne, 2023), indicates that volcanism has played and possibly still plays a major role on Venus. Additionally, Venus possesses a variety of tectonic features (e.g., Ghail et al. 2024, for a review). Venus’ young surface and the large number and the diversity of volcanic and tectonic features observed support the growing evidence for a geologically active planet with a high potential for seismic activity.
Studying Venus’ geodynamics is crucial to understand the level of geological activity of our sister planet. Detecting Venusquakes would be a particularly efficient way to study the composition and structure of the planet’s interior, as demonstrated by the InSight mission on Mars. With the upcoming launch of NASA’s VERITAS and ESA’s EnVision in the 2030s—the first missions to investigate Venus’ interior since NASA’s Magellan mission concluded in 1994—the planet is a key topic to study. Even if neither mission possesses dedicated equipment for seismic studies, surface deformation studies with Repeat Pass Interferometry planned for VERITAS will pave the way for future missions. Several proposals are being developed to study the planet's seismicity, either through ground sensors, pressure sensors on balloons, or orbital imagers (Garcia et al., 2024). The study of the impact of geodynamical regimes on present-day surface velocities and seismicity of Venus can thus help us anticipate those future missions and link the data gained to possible geodynamic regimes for the planet.
METHOD
In this study, we aim to provide an estimation of the present-day seismic activity of Venus through the exploration of the different possible geodynamic regimes of the planet. To achieve this goal, we are using the GAIA geodynamical code (Hüttig et al, 2013) with a spherical annulus geometry (Fleury et al., 2024). Our model includes partial melting, a pseudo-plastic rheology, and pressure- and temperature-dependent viscosity, thermal expansivity and conductivity. We vary the fraction of extracted melt between 0% (i.e. fully intrusive cases) to 100% (i.e. fully extrusive cases). In our models, we use a pseudo-plastic rheology to allow for plastic deformation and surface mobilisation when the convective stresses exceed an imposed yield stress, which we vary at the surface from 5 MPa to 200 MPa.
To determine the nature of the geodynamic regime for each simulation, we extract the surface velocities and use several criteria (Tackley, 2000; Lourenço et al, 2020), namely: (1) the mobility to distinguish between mobile-lid, episodic-lid and stagnant-lid regimes, (2) the plateness to detect the presence of plates, and (3) the quiescent plateness to distinguish the plutonic squishy lid regime from the mobile lid regime.
For all our models that lie in different geodynamic regimes, we compute the volcanic flux in km3/year and compare our results to literature values for present-day Venus, in order to determine which combinations of yield stress and magmatic style best represent our current understanding of volcanic activity on Venus.
We compute the mechanical lithosphere thickness based on the present-day thermal state of the lithosphere obtained in our geodynamic models. The values that we obtained are compared to literature estimates that indicate a thin mechanical thickness at least locally, compatible with high lithospheric thermal gradients.
Using the 873 K isotherm, we calculate the seismogenic layer thickness, the layer in which Venusquakes could nucleate. Moreover, we compute the present-day seismic velocities based on the mantle temperature values at present day and lithostatic pressure from our geodynamic models, as well as the present-day seismicity, providing a moment-frequency relation. To calculate the moment-frequency-relation, we use the total seismic moment budget, which considers the contribution of both stresses from planetary contraction and convective stresses, similar to Plesa et al. (2018).
RESULTS
Our parameter space presents four geodynamic regimes: mobile-lid (yield stress < 10 MPa), stagnant-lid (> 20 MPa), plutonic squishy-lid (10–20 MPa, highly intrusive), and episodic-lid (10–20 MPa, intermediate extrusive magmatism efficiency). Characteristics from the episodic lid regime simulations, such as the dimensions of the subduction zones and the initiation of subduction by the plume-lithosphere interaction, are consistent with the work of Davaille et al. (2017), who suggest that Quetzalpetlatl and Artemis coronae could be potential sites of plume-induced subduction.
Comparisons with literature values (see van Zelst, 2022 for an overview) indicate that low to intermediate extrusive-intrusive ratios (from 0.1 to 0.6) best reproduce the expected order of magnitude for Venus' present-day volcanic rates. As the present-day surface of Venus does not show signs of large-scale surface mobilization, we also exclude simulations with very low yield stresses (< 10 MPa).
Average profiles of present-day shear and compressional wave velocities are similar among simulations with different geodynamic styles or assuming different mantle compositions. However, substantial spatial variations in seismic velocities are expected for models where surface mobilization occurs, at least locally, at present day.
Our results will provide critical constraints to anticipate future missions designed to study the seismicity of Venus, helping to distinguish, based on the number of earthquakes, the geodynamic regime that predominantly defines the planet.
REFERENCES
Davaille et al. (2017). Nat. Geosci. https://doi.org/10.1038/ngeo2928
Fleury et al. (2024). G3. https://doi.org/10.1029/2023GC011114
Garcia et al. (2024). ESS. https://doi.org/10.1029/2024ea003670
Ghail et al. (2024). Space Sci Rev. https://doi.org/10.1007/s11214-024-01065-2
Hüttig et al. (2013). PEPI. https://doi.org/10.1016/j.pepi.2013.04.002
Hahn & Byrne (2023). JGR: Planets. https://doi.org/10.1029/2023JE007753
Lourenço et al. (2020). G3. https://doi.org/10.1029/2019GC008756
Plesa et al. (2018). GRL. https://doi.org/10.1002/2017GL076124
Tackley (2000). G3. https://doi.org/10.1029/2000GC000036
van Zelst, I. (2022). JGR: Planets. https://doi.org/10.1029/2022JE007448
How to cite: Pallois, C., Herrera, C., and Plesa, A.-C.: Venus' present-day interior dynamics and seismicity from geodynamical modelling, Europlanet Science Congress 2026, The Hague, The Netherlands, 7–11 Sep 2026, EPSC2026-683, https://doi.org/10.5194/epsc2026-683, 2026.
Venus is similar to Earth in size, mass, and bulk density. However, its thermal, tectonic, and atmospheric evolution has been very different. Its hot, dense CO₂-rich atmosphere, surface dominated by volcanic features [Hahn & Byrne, 2023], and potentially ongoing volcanic activity [Herrick and Hensley, 2023] make Venus a key target for understanding magmatic processes and their role in shaping the surfaces of terrestrial planets.
The composition of Venus’ surface is poorly known because in situ surface investigations are difficult to conduct in such a harsh surface environment, and orbital measurements of Venus’ surface can only be performed for narrow near-infrared spectral windows, as the opaque and thick atmosphere of Venus restricts direct surface observations. These atmospheric windows are central to upcoming Venus missions such as EnVision and VERITAS [Smrekar et al., 2022; Straume-Lindner et al., 2025], which aim to constrain surface composition, volcanic activity, and geodynamic evolution through orbital observations. Since surface emissivity measurements are sensitive to rock composition, including the FeO content of these rocks [Dyar et al. 2020; Helbert et al. 2021], they provide a potential link between observable surface materials and the interior processes that generated them. In turn, the FeO content influences mantle density, melting behaviour, and melt composition, and variations in bulk mantle FeO can affect the thermal evolution and magmatic history of Venus. Some of the only direct compositional constraints on Venus’ surface rocks come from the Venera and Vega landers [Surkov et al., 1984, 1986], which measured basaltic compositions at the surface.
Jennings et al. [2026] used Perple_X thermodynamic modelling to investigate Venus mantle compositions and proposed candidate compositions, including M80, capable of producing Venera- and Vega-like melts. Building on this work, we combine geodynamical modelling with GAIA and Perple_X-derived melting curves to investigate how variations in bulk mantle FeO content influence melting behaviour, melt production, and melt properties under Venus-like mantle conditions. These results are linked to high-temperature emissivity measurements of Venus analogue materials, with the broader goal of supporting the interpretation of future observations from EnVision and VERITAS.
We use the mantle convection code GAIA in a 2D spherical annulus geometry [Hüttig et al., 2013; Fleury et al., 2024] to model the long-term thermal and magmatic evolution of Venus’ mantle with the different bulk mantle FeO generated by Perple_X. The simulations include temperature- and pressure-dependent viscosity, thermal conductivity, and thermal expansivity, and account for internal radiogenic heating [Breuer et al., 2009; Moroz et al., 1980] and core cooling [Steinbach & Yuen, 1994].
The different FeO content between the simulations is reflected in the mantle solidus and liquidus temperature, whose parameterisation is based on Perple_X thermodynamic calculations. We use M80 composition from Jennings et al. [2026] as the reference composition and compare it with the FeO-variable suite M301–M306, generated by varying bulk FeO relative to M80 in steps of approximately ΔFeO ≈ 3 wt%. The Perple_X-derived solidus and liquidus curves were smoothed, segmented, and fitted with piecewise polynomial functions before being implemented in GAIA.
We compare two magmatic emplacement regimes: a fully extrusive case and a mixed case with 20% intrusive and 80% extrusive melt emplacement, with intrusions placed at 50 km depth. Simulation outputs are post-processed to analyse thermal evolution, melt production, cumulative melt volume, melt depth, melt temperature, and lithospheric thickness.
The simulations show that the effect of bulk mantle FeO content depends strongly on the magmatic emplacement regime. In fully extrusive cases, melt production rates, cumulative melt volumes, melt depths, and melt temperatures converge across FeO compositions, suggesting limited compositional sensitivity when melt is efficiently extracted to the surface. In contrast, the mixed intrusive–extrusive regime shows clearer FeO-dependent behaviour, with higher-FeO cases producing larger melt volumes and stronger variations in melt-related quantities.

The temperature and depth of melting also vary with composition. Low-, reference-, and high-FeO cases occupy different regions in melt temperature–melt depth space, indicating that FeO content affects the range of depths and temperatures at which melt is generated. In the mixed intrusive–extrusive regime, higher-FeO cases show a broader spread of melt-generation conditions, suggesting that FeO influences not only the amount of melt produced, but also where and under which thermal conditions melting occurs.

Laboratory emissivity measurements provide the observational link to the geodynamic results. We compare the model outputs with high-temperature emissivity spectra of two FeO-variable Venus analogue glasses synthesised at the University of Münster. These glasses represent partial melt compositions calculated with Perple_X from the M80 and M302 mantle compositions. The spectra were measured at Venus surface temperature in the Planetary Spectroscopy Laboratory and calibrated using hemispherical reflectance and blackbody measurements.
The two glasses show systematic emissivity differences within the near-infrared atmospheric windows targeted by VEM/VenSpec-M. Together, the geodynamic and laboratory results suggest that bulk mantle FeO content affects Venus’ melting history and may produce surface materials with distinguishable emissivity signatures relevant to future Venus missions. The combined approach presented here provides a framework for linking modelled mantle melting, melt properties, and surface spectral observations.
How to cite: Mohamed, Y., Herrera, C., Jennings, L., Alemanno, G., Plesa, A.-C., and Klemme, S.: On the role of bulk FeO content in Venus’ mantle thermal evolution, melt production, and surface emissivity, Europlanet Science Congress 2026, The Hague, The Netherlands, 7–11 Sep 2026, EPSC2026-595, https://doi.org/10.5194/epsc2026-595, 2026.
Similar to the Earth in size, mass, and potentially composition, Venus is often referred to as our sister planet. However, today’s Venus represents one of the most extreme places in the Solar System. It possesses a dense CO2 atmosphere with a surface pressure 90 times higher than the Earth and surface temperatures able to melt lead. Its young surface is dominated by volcanic features at all spatial scales (Hahn & Byrne, 2023), and recent reanalysis of Magellan radar data suggests that Venus might be volcanically active today (Herrick & Hensley, 2023; Sulcanese et al., 2024).
The large variety of tectonic features at Venus’ surface range from rift zones of thousands of kilometers in length (Foster and Nimmo, 1996), to wide-spread distribution of wrinkle ridges (Billoti and Suppe, 1999), and a substantial number of round formations consisting of a ring wall and radial cracks and fractures in the interior (the so-called coronae), some of which have been associated with regional subduction processes (Davaille et al., 2017). These tectonic structures bear witness of geological processes that have shaped Venus’ surface.
Limited constraints for the deep interior of Venus are available from measurements of the tidal Love number k2 = 0.295±0.066 (Konopliv & Yoder, 1996), which is sensitive to the size and state of the core, and from the moment of inertia factor (MoIF), which describes the distribution of mass in the interior suggesting a core radius of 3500±500 km (Margot et al., 2021). The phase lag of the deformation, whose value is particularly sensitive to the thermal state of the interior, has not yet been measured but will be constrained by future missions.
Venus has a higher correlation of gravity and topography for long wavelengths and a globally large apparent depth of compensation (Sjogren et al., 1980). Recently, Maia et al. (2023) showed that a viscosity jump at 700 km depth (corresponding to ringwoodite-bridgmanite phase transition) is inconsistent with the observations, while a 250-km-thick low-viscosity layer at the base of the lithosphere is favored by the data.
In this study, we run global scale thermal evolution models in a 3D spherical geometry to investigate the full thermal evolution and the spatial distribution of the temperature field in the interior of Venus at present day. We use the geodynamical convection code GAIA-v2 (Hüttig et al., 2013) and solve numerically the conservation equations of mass, linear momentum. Our models use a pressure- and temperature-dependent viscosity following Arrhenius law, and include pressure- and temperature-dependent thermal expansivity and conductivity adopting the parametrizations described in Tosi et al., (2013). We consider partial melting and the effects of magmatic intrusions that can considerably affect the thermal state of the lithosphere (Herrera et al., 2026), leading to the so-called plutonic squishy lid geodynamic regime (Lourenço et al., 2020). In this regime, regional scale surface mobilization and lithospheric foundering can occur.
Our models consider the effects of core cooling and radioactive decay as appropriate for thermal evolution modeling. We include the effect of solid-solid phase transitions and vary the size of the core and the viscosity of the mantle. For the viscosity we test reference values of 1e20, 1e21, and 1e22 Pa s, and vary its increase with depth over several orders of magnitude. As the interior structure of Venus is poorly constrained, we investigate models with a core radius between 3025 km and 4000 km (Margot et al., 2021).
We find that only models with a core radius between 3025 km and 3750 km are compatible with current estimates of the tidal Love number k2. Our models also show a lower tidal quality factor for Venus compared to solid Earth, which suggests a hotter interior. The increase of viscosity with depth needs to be lower than two orders of magnitude to avoid a significant decrease of the spectral correlation and admittance, at odds with observations. Models compatible with high thermal gradients, as inferred from elastic lithosphere thickness studies (see Maia et al. 2025, for a summary), suggest that a substantial fraction of melt produced in the interior remains trapped in the lithosphere as magmatic intrusions. In such cases, we observe a strong interaction between plumes and the lithosphere, amplified by the presence of magmatic intrusions.
Future measurements of the NASA VERITAS (Smrekar et al., 2022) and ESA EnVision (Straume-Lindner et al., 2025) missions will provide unprecedented information to address the interior structure and thermal history of Venus, and will help refine models of the interior evolution.
References:
Billoti & Suppe (1999). “The Global Distribution of Wrinkle Ridges on Venus”. Icarus.
Davaille et al. (2017). “Gravity anomalies on Venus”. Nat. Geosci.
Foster & Nimmo (1996). “Comparisons between the rift systems of East Africa, Earth and Beta Regio, Venus”. EPSL.
Hahn & Byrne (2023). “A Morphological and Spatial Analysis of Volcanoes on Venus”. JGR: Planets.
Herrick & Hensley (2023). “Surface changes observed on a Venusian volcano during the Magellan mission”. Science.
Herrera et al. (in review). “The Role of Magmatic Styles in Planetary Thermal Evolution Models”. Submitted to JGR:Planets.
Hüttig et al. (2013). “An improved formulation of the incompressible Navier–Stokes equations with variable viscosity”. PEPI.
Konopliv & Yoder (1996). “Venusian k2 tidal Love number from Magellan and PVO tracking data”. GRL.
Lourenço et al. (2020). “Plutonic-Squishy Lid: A New Global Tectonic Regime Generated by Intrusive Magmatism on Earth-Like Planets”. G3.
Maia et al. (2023). “The Mantle Viscosity Structure of Venus”. GRL.
Maia et al. (2025). “The Seismogenic Thickness of Venus”. JGR:Planets.
Margot et al. (2021). “Spin state and moment of inertia of Venus”. Nat. Astron.
Sjogren et al. (1980). “Gravity anomalies on Venus”. JGR:Space Physics.
Smrekar et al. (2022). “VERITAS (Venus Emissivity, Radio Science, InSAR, Topography, and Spectroscopy): A Discovery Mission”. IEEE Aerospace Conference (AERO)
Straume-Lindner et al. (2025). “The EnVision Mission to Venus – mission overview and science preparations”. EPSC 2025
Sulcanese et al. (2024). “Evidence of ongoing volcanic activity on Venus revealed by Magellan radar”. Nat. Astron.
Tosi et al. (2013). “Mantle dynamics with pressure- and temperature-dependent thermal expansivity and conductivity”. PEPI.
How to cite: Plesa, A.-C., Maia, J., Walterová, M., and Breuer, D.: The Thermal State and Interior Structure of Venus: Insights from Global Geodynamic Models, Europlanet Science Congress 2026, The Hague, The Netherlands, 7–11 Sep 2026, EPSC2026-679, https://doi.org/10.5194/epsc2026-679, 2026.
INTRODUCTION
Venus is a terrestrial planet similar to Earth in size and mass, but its geological evolution followed a very different path leading to a dense CO2 atmosphere and the absence of plate tectonics at present day. Radar data collected by NASA’s Magellan mission revealed a surface characterized by a wide variety of tectonic and volcanic features, including large extensional systems known as chasmata (Ivanov and Head, 2011), whose origin is still debated (Stofan et al., 1992, Phillips and Hansen, 1998; Hansen and Phillips, 1993).
One of the largest rift systems on Venus is Parga Chasma, which extends for about 10,000 km from Atla Regio to Themis Regio (Chapman and Kirk, 1996; Stofan et al., 1992) and contains several discontinuous rift segments associated with coronae and large volcanic centers (Graff et al., 2018). Coronae are circular to elongated structures surrounded by concentric fractures and are thought to form through the rise and collapse of mantle plumes (Basilevsky & Head, 2003). Since they are widespread along the rift, analyzing these features provides hints on the tectonic evolution and lithospheric structure of Venus.
Distinct spatial clustering of coronae along the rift and estimated thermal anomaly depths between ~110 and 130 km (De Toffoli et al., 2024) suggest that Parga Chasma is dominated by magmatic intrusions rather than volcanism. Building on these results, we extended this study to further constrain the rheological properties of the Venusian mantle beneath the Parga region varying the reference mantle viscosity and magmatic parameters related to the magmatic style and intrusions depth.
METHODS
We perform geodynamical simulations using the mantle convection code Gaia-v2 (Huttig et al., 2013). Our models are built with a 2D spherical annulus geometry (Fleury et al., 2024). While our model size spans a larger area than Parga Chasma, this choice was made to include the geodynamic processes of Parga Chasma in a more global geodynamic context, and avoid any effects that might be associated with model boundaries.
Our geodynamic models have a non-Newtonian rheology Assuming a depth- and temperature-dependent viscosity (Hirth & Kohlstedt, 2003), and dry dislocation creep (Karato et al., 1986; Karato & Jung, 2003). We also assume depth- and temperature-dependent thermal conductivity and expansivity (Tosi et al., 2013). We account for radiogenic heat decay (Moroz et al. 1980), core cooling (Steinbach & Yuen, 1994), and melting curves based on thermodynamic models for an Earth-like mantle composition (Stixrude et al., 2009).
We consider that the melt generated when the temperature exceeds the solidus melting curve can partially reach the surface (extrusive magmatism), but also part of this melt can remain trapped in the interior (intrusive magmatism). Extrusive melts instantaneously cool to surface temperature, while magmatic intrusions cool adiabatically according to the intrusive melt depth assumed. Magmatic intrusions also evolve according to the rheological critical melt fraction (Arzi, 1978), distinguishing between solid- and melt-dominated regimes that respectively reduce the viscosity as a function of the melt fraction or increases the thermal conductivity to capture the effect of small-scale convection in the melt.
The intrusive to extrusive ratio in the Parga chasma region is unknown, and thus we vary the amount of extrusive melt between 0% (fully intrusive) and 100% (fully extrusive) in steps of 10%. Since the depth at which the melt remains trapped below the surface is poorly constrained, we also vary this parameter among cases between 10 km and 90 km in steps of 10 km, and the value is kept fixed within each case. We analyze this parameter space for two sets varying the reference mantle viscosity: one assuming 1020 Pa s and 1021 Pa s, that could be attributed to differences in the mantle composition of Venus.
RESULTS
Models assuming a higher mantle viscosity predict melting regions located at depths significantly greater than the observed range in De Toffoli et al., (2024) and are therefore inconsistent with the inferred thermal structure. In contrast, several models with a mantle reference viscosity of 1020 Pa s are compatible with the estimated depths. This lower viscosity is reasonable for a hot mantle domain beneath an active rift system, especially if partial melting and elevated temperatures reduce mantle strength. This reference viscosity value is consistent, although it lies at the lower end of the reference viscosity range inferred from tidal deformation studies of the interior of Venus (Walterová et al., 2024; Musseau et al., 2024).
Our best fitting scenarios also require a dominant contribution from magmatic intrusions rather than surface volcanism, supporting the interpretation that intrusive magmatism plays a major role in the evolution of the Parga rift system. Although our findings do not distinguish between suggested forming mechanisms of rift systems that point to diapiric upwelling (Stofan et al., 1992) or lithospheric extension over heated mantle (Phillips and Hansen, 1998; Hansen and Phillips, 1993), they help to narrow the parameter space of both hypotheses, suggesting the presence of a relatively weak and thermally active mantle beneath the rift, consistent with plume-related, tectono-magmatic activity and localized lithospheric weakening on Venus.
SUMMARY
Our analysis indicates that geodynamic models compatible with previous depth estimations are scenarios dominated by magmatic intrusions and lower mantle viscosities, further supporting the interpretation that intrusive magmatism plays a major role in the evolution of the Parga rift system.
How to cite: Herrera, C., De Toffoli, B., Plesa, A.-C., Mazzarini, F., and Breuer, D.: Low viscosity and highly intrusive magmatism beneath Venusian coronae in Parga Chasma, Europlanet Science Congress 2026, The Hague, The Netherlands, 7–11 Sep 2026, EPSC2026-1196, https://doi.org/10.5194/epsc2026-1196, 2026.
A global-scale network of tectonic plates like on Earth is currently absent on Venus [1]. However, a rich inventory of tectonic features, including rift systems (chasmata) [2] and mountain belts [3], along with volcanic edifices [4] and coronae [5], indicates diverse modes of past and likely also present localized deformation and associated magmatism. Radar-smooth crustal blocks spanning several hundreds of kilometers have also been identified [6] and were suggested to have rotated and laterally moved relative to one another in the recent past. Geodynamic concepts of a static lid with possible episodic overturning or a plutonic squishy lid are currently favored to describe Venus’ recent evolution [7].
The Venusian surface is dominated by lowland volcanic plains mapped as lower and upper regional plains, shield plains and groove belts [8] that cover approximately 75% of the planet. These plains are in parts very smooth, likely basaltic in composition, and among the youngest landforms on Venus. They may play a key role in understanding geodynamic processes on Venus. Here, we study these lowlands plains and find that they comprise polygonal domains bounded by fractured ridges, which may provide a window into Venus' mantle dynamics.
Remote sensing combined with geostatistical analysis reveals that the entity of the lowlands forms a network of aligned ridges delimiting polygonal lowlands, occurring in four specific patterns: 1) symmetric and 2) asymmetric ridges, 3) flat, strongly fractured belts, and 4) double-ridge-furrow belts. The polygon diameters show a skewed distribution with dominant modes at 800 km and 1,300 km. The polygon centers correlate with Bouguer gravity highs and low inferred crustal thicknesses. Many Venusian coronae occur within the interiors of these polygons.
These observations are consistent with a convective pattern in which broad mantle upwellings define the polygonal domains and their margins. In contrast, the fractured ridges and furrows represent mobile compressive structures that may coincide with sheets of sinking, cooler lithosphere. The polygons of the Venusian lowlands are thus interpreted as surface expressions of mantle convection and can help to constrain rheological and geodynamic parameters of Venus. Recent 2D geodynamic models predicting a bimodal distribution of plume sizes in Veus’ mantle [9] show a good match to the dominant dimensions of the mapped polygons and are therefore consistent with our geodynamic interpretation. Morever, recent 3D geodynamic models of Venus’ mantle convection with GAIA [10] show the development of convection cells that produce a polygonal surface deformation pattern, where mantle upwellings coincide with the polygon interiors and sheets of donwelling lithosphere coincide with their boundaries.
References
[1] Solomon, S. C., Smrekar, S. E., Bindschadler, D. L., Grimm, R. E., Kaula, W. M., McGill, G. E., Phillips, R. J., Saunders, R. S., Schubert, G., Squyres, S. W., Stofan, E. R. (1992). Venus tectonics: An overview of Magellan observations. Journal of Geophysical Research, 97, 13199–13255.
[2] Stofan, E. R., Head, J. W., Campbell, D. B., Zisk, S. H., Bogomolov, A. F., Rzhiga, O. N., Basilevsky, A. T., Armand, N. (1989). Geology of a rift zone on Venus: Beta Regio and Devana Chasma. GSA Bulletin 101 (1): 143–156.
[3] Romeo, I. and Capote, R. (2011) Tectonic evolution of Ovda Regio: An example of highly deformed Continental crust on Venus? Planetary and Space Science 59:1428–1445.
[4] Ivanov, M. A. and Head, J. W. (2013) The history of volcanism on Venus. Planetary and Space Science 84: 66–92.
[5] Gülcher, A. J. P., Gurnis, M., and Smrekar, S. E. (2025), Dynamics of Venusian rifts and their interactions with plumes and intrusions, Earth and Planetary Science Letters, vol. 667, 119514
[6] Byrne, P.K., Ghail, R.C., Gilmore, M.S., Şengör, A.M.C., Klimczak, C., Senske, D.A., Whitten, J.L., Khawja, S., Ernst, R.E., Solomon, S.C. (2021). A globally fragmented and mobile lithosphere on Venus. Proceedings of the National Academy of Sciences, 118, e2025919118.
[7] Rolf, T., Weller, M., Gülcher, A., Tackley, P., King, S. (2022). Dynamics and evolution of Venus' mantle and its coupled surface. Space Science Reviews, 218, 70.
[8] Ivanov, M.A., Head, J.W. (2011). Global geological map of Venus. Planetary and Space Science, 59, 1559–1600.
[9] Kerr, M. C., Stegman, D. R., Smrekar, S. E., and Adams, A. C., (2025) The glass-ceiling convective regime and the origin and diversity of coronae on Venus, Proceedings of the National Academy of Sciences, 122 No. 38 e2504491122
[10] Hüttig, C., Tosi, N., & Moore, W. B. (2013). An improved formulation of the incompressible Navier–Stokes equations with variable viscosity. Physics of the Earth and Planetary Interiors, 220, 11-18.
How to cite: Kenkmann, T., Karagoz, O., Rotzoll, L., Carboni, F., Gülcher, A., and Plesa, A.-C.: The Venusian lowlands: key to unravel mantle dynamics, Europlanet Science Congress 2026, The Hague, The Netherlands, 7–11 Sep 2026, EPSC2026-373, https://doi.org/10.5194/epsc2026-373, 2026.
Please decide on your access
Please use the buttons below to download the supplementary material or to visit the external website where the presentation is linked. Regarding the external link, please note that Copernicus Meetings cannot accept any liability for the content and the website you will visit.
Forward to presentation link
You are going to open an external link to the presentation as indicated by the authors. Copernicus Meetings cannot accept any liability for the content and the website you will visit.
We are sorry, but presentations are only available for conference attendees. Please register for the conference first. Thank you.
Most of the current knowledge regarding the interior of Venus is derived from Magellan gravity and topography datasets collected three decades ago. While this mission provided the first high-resolution global gravity field, the computational limitations of the 1990s necessitated compromises that impacted the accuracy of the gravity solutions (Konopliv et al., 1999). We report on a reanalysis of the Magellan Doppler tracking data, leveraging modern computational capabilities to improve the Venus gravity field, orientation, and rotational dynamics.
Most significantly, modern computing power allows us to achieve a spherical harmonic degree-and-order 180 solution via a single inversion, eliminating the need for the multi-step approach that previously affected the solution. The single-step solution, removes the discontinuities in the uncertainty estimates of the gravity field coefficients, enabling more coherent and robust uncertainty quantification on derived products.
Differently from previous works we do not apply surface acceleration constraints but rather a smooth, global, Kaula regularization. As a consequence of this approach we observe a reduction in high-frequency noise (ringing) in the solution, leading to more coherent spatial structures in the solution which is beneficial for localized analyses of near-subsurface features
Another limitation of previous works, consisted in a strong de-weighting of the tracking data around the poles, which strongly affected the gravity solution in those regions. We adopted a different approach, based on the actual data weight coupled with a Variance Component Estimator (VCE) to properly derive data weights. The spatial resolution of the resulting gravity field is substantially improved over the poles, where we retrieve higher power, and more coherent spatial structures.
Using this new field, we investigate the global elastic properties of the lithosphere taking advantage of improved polar resolution and robust uncertainty quantification. Notably we apply the RM-1 constrained inversion technique (e.g., Goossens et al., 2017) which improves the estimate of the short-wavelength gravity by prescribing it to follow the signal associated to the topography. Rather than prescribing gravity to follow uncompensated topography as in previous work, here we account for loading of the lithosphere (e.g., Turcotte et al., 1981). This proves to be a powerful technique enabling improved sensitivity to the global elastic properties of the lithosphere.
Additionally, we assess the sensitivity of the dataset to length-of-day variations which were previously not explicitly estimated, but whose magnitudes as observed from Earth (Margot et al., 2021) would have had a measurable influence on the probe.
References
Konopliv, A. S., Banerdt, W. B. & Sjogren, W. L. Venus Gravity: 180th Degree and Order Model. Icarus 139, 3–18 (1999).
Goossens, S. et al. Evidence for a low bulk crustal density for Mars from gravity and topography. Geophysical Research Letters 44, 7686–7694 (2017).
Turcotte, D. L., Willemann, R. J., Haxby, W. F. & Norberry, J. Role of membrane stresses in the support of planetary topography. J. Geophys. Res. 86, 3951 (1981).
Margot, J.-L. et al. Spin state and moment of inertia of Venus. Nature Astronomy 5, 676–683 (2021).
How to cite: Cascioli, G., Goossens, S., Mazarico, E., and Gülcher, A.: A new look at Venus gravity and rotation from a reanalysis of Magellan data, Europlanet Science Congress 2026, The Hague, The Netherlands, 7–11 Sep 2026, EPSC2026-584, https://doi.org/10.5194/epsc2026-584, 2026.
Introduction
Coronae are among the most characteristic tectonic features on Venus, with more than 740 examples catalogued from Magellan data [1,2]. Their formation has been attributed to plume-induced uplift, Rayleigh–Taylor dripping, coupled upwelling and delamination, and plume-induced subduction [1–4]. Recent analyses combining Magellan free-air gravity, Bouguer gravity, and topography show that coronae record a spectrum of formation regimes, including a subset whose gravity signatures cannot be reproduced by plume-based models [5]. Demeter Corona, located at 295.2°E and 54.2°N, is the clearest example. It combines a −18.5 mGal free-air anomaly with a positive Bouguer anomaly and an elongated asymmetric trough. The mechanical process that produces this signal remains unresolved.
Here, using dynamically scaled three-dimensional laboratory analogue experiments performed at the Planetary Analogue Laboratory, University of Freiburg, Germany, we investigate whether dense lithospheric downwelling can evolve into lateral peeling beneath Venus coronae. The experiments reproduce an upper crust made of sand overlying four polydimethylsiloxane (PDMS) layers that represent the Venus lower crust, mantle lithosphere, asthenosphere, and a hemispherical eclogitic density anomaly at the crust–mantle boundary. The viscosity ratio across the simulated Moho, η_lc / η_lith = 0.93, and the buoyancy number, B = 0.094, are scaled to Venus conditions. Internal deformation is tracked with synchronous side-view and top-view particle image velocimetry, while surface topography is reconstructed at each time step by multi-view stereo photogrammetry. Side-view neck width is extracted automatically from 1.4 × 10⁵ continuously recorded frames.
Results
The experiment evolves continuously from drip nucleation to fully developed lateral peeling. The viscous neck connecting the drip head to the overlying plate thins from a scaled width of about 163 km to about 45 km, corresponding to a 72% reduction over a scaled time of about 12 Myr. The ratio of drip-head diameter to neck width increases monotonically and reaches about 3.5 at the onset of lateral peeling. This provides a geometry-based criterion for the drip-to-peeling transition under Venus-relevant scaling.
As the neck narrows, stress transmission across the weak lower-crustal Moho decreases. The overlying plate progressively decouples from the drip head, and removal migrates laterally as a peeling front along the lower crust. The resulting evolution is compared with two Venus coronae. Eithinoha Corona represents an intermediate stage of the analogue model, expressed by a dual-wavelength swath topographic profile. However, Magellan gravity at this latitude cannot distinguish between plume-driven and plume-independent downwelling. Demeter Corona shows the full peeling signature. It combines an elongated planform, an asymmetric trough annulus, a −18.5 mGal free-air anomaly, and a positive Bouguer anomaly. This combination is not reproduced by any plume model in [5].
A morphological screening of 179 elongated coronae from the updated Gülcher et al. [2] catalogue places 44 candidates within the peeling-stage region of elongation–asymmetry space. These candidates have the deepest trench depths in the catalogue systematically and are broadly distributed across the Venus surface rather than clustered near known tectono-magmatic provinces.
Implications
Our results suggest that coronae with Demeter-like signatures can form by progressive neck thinning and lateral peeling of a dense lower lithosphere. This mechanism requires only a thermally decoupled Moho and a dense lower lithosphere, both consistent with the Venus geotherm and the crustal metamorphism framework of Semprich et al. [6]. EnVision and VERITAS will provide gravity and SAR data at the resolution needed to test the 44 screened candidates against the Demeter benchmark. These observations will determine whether lithospheric downwelling represents a major class of corona formation on Venus. Because comparable rheological conditions may also apply to the Archaean Earth, progressive neck thinning provides a candidate geometric mechanism linking eclogitic dripping to large-scale delamination during early terrestrial lithospheric evolution.
References [1] Stofan E.R. et al., 1991, JGR 96, 20933. [2] Gülcher A.J.P. et al., 2025, JGR Planets 130, e2024JE008749. [3] Smrekar S.E. & Stofan E.R., 1997, Science 277, 1289. [4] Davaille A. et al., 2017, Nature Geoscience 10, 349. [5] Cascioli G. et al., 2025, Science Advances 11, eadt5932. [6] Semprich J. et al., 2025, Nature Communications 16, 2905.
How to cite: Karagoz, O. and Kenkmann, T.: Lithospheric Decoupling Links Dripping to Delamination Beneath Venusian Coronae: Dynamically Scaled Laboratory Experiments, Europlanet Science Congress 2026, The Hague, The Netherlands, 7–11 Sep 2026, EPSC2026-451, https://doi.org/10.5194/epsc2026-451, 2026.
INTRODUCTION
Venus’ magmatic history remains unconstrained since its geologically young surface causes major uncertainties in the planet’s mantle rheology, volatile content, and long-term cooling history. Recent evidence of ongoing volcanic activity on Venus (Herrick & Hensley, 2023) suggests magmatism still plays a key role, but reconstructing the past to understand why Venus and Earth evolved differently despite their similarities is a key challenge in planetary sciences. Global climate models suggest Venus could have had mild temperatures and liquid water until <1 Ga (Way et al., 2016, 2020), but other studies suggest that a hot surface, possibly hotter than today (Noack et al.,2012), persisted for most of its history (Figure 1). Surface temperature is linked to the magmatic and outgassing history, but the mantle volatile content is unclear. While some studies suggest that Venus’ interior may be intrinsically dry (Constantinou et al., 2024), others propose that volatiles could persist in the lower mantle (Smrekar & Sotin, 2012), affecting mantle dynamics.
Venus’s geodynamic regime and surface tectonics are poorly constrained. Several scenarios including catastrophic resurfacing, episodic plate tectonics, and stagnant lid regime were proposed. Early geodynamic models considering magmatism mostly assumed eruption-dominated (extrusive) magmatism known as the heat-pipe regime (Moore & Webb, 2013), but more recent studies explored intrusion-dominated (intrusive) magmatism known as the plutonic-squishy regime (Lourenco et al., 2020).
A global perspective of the intrusive-to-extrusive ratio is still unclear. The >85,000 volcanoes (Hans & Byrne, 2023) reflect Venus’ volcanic nature, however, ~740 coronae (Gülcher et al., 2025), features related to plume-mantle interactions, and interpretations from gravity-topography data (Maia et al., 2023) reveal that intrusions also take place. Geodynamic models constrained from observational data point to a highly intrusive magmatism (Herrera et al., 2024; Maia et al., 2025); however, how this could have differed in the past if the planet had different surface and lithospheric conditions is poorly understood. Therefore, we analyze the effect of the end-member magmatic styles (i.e. ‘fully intrusive’ vs. ‘fully extrusive’ magmatism).
We explore the relative roles of these magmatic styles for the planetary evolution under varying surface temperatures and mantle viscosities, aiming to understand how surface and mantle conditions influence the melt production rate and the pressure and temperature conditions at which melts are first generated on Venus.
METHODS
We use the geodynamic code GAIA in 2D spherical annulus geometry (Hüttig et al.,2013; Fleury et al.,2024). We assume a temperature- and depth-dependent viscosity (Hirth & Kohlstedt,2003), pressure- and temperature-dependent thermal conductivity and expansivity (Tosi et al.,2013), radiogenic heat decay (Moroz et al., 1980), core cooling (Steinbach & Yuen, 1994), and melting curves from thermodynamic models (Stixrude et al.,2009; Jennings et al., 2025). Figure 1 illustrates our melting modeling. Melt extraction occurs instantaneously (Condomines et al., 1988). Extrusive melts instantaneously cool to surface temperature while intrusive melts, placed at 30 km depth, cool adiabatically. Magmatic intrusions also evolve according to the rheological critical melt fraction (Arzi, 1978) depending if they are in a solid- or melt-dominated regime, which respectively reduce the viscosity as a function of the melt fraction or increases the thermal conductivity to capture the effect of small-scale convection in the melt.
RESULTS
Our results highlight surface-mantle feedbacks as a key control on magmatic and cooling history, which may be reflected in the surface composition as well as shape the inner mantle structure: hot surfaces favor a more efficient mantle cooling if intrusive magmatism dominates, and vice versa; while the mantle viscosity modulates this effect (Figure 2). Intrusive magmatism efficiently cools the mantle when an efficient lithospheric recycling occurs, and such process influences crustal and lithospheric conditions, affects volatile redistribution in the mantle, and boosts melt production that, consequently, increases outgassing and impacts atmospheric composition.
Constraining the surface temperature evolution depends on interior-surface-atmosphere feedback that remains to be studied. As a first-order approximation that allows us to analyze the effects of a surface temperature variation on the magmatism, we impose an abrupt temperature increase until today’s surface temperature (737 K) to mimic a catastrophic event that ended a phase with milder conditions. Similarly, we model the other end-member scenario in which an initially hotter surface temperature decreases until the modern-day temperature is reached. We analyze the implications of such changes in temperature in terms of the melt generation on Venus, and how this affects mantle and lithospheric properties for both magmatic styles.
For all our cases, we compare the depth and temperature of the melt sources with thermodynamical models that explain the surface composition measured by Venera 14 and Vega 2 (Jennings et al., 2026) to study the link between our melt sources and present-day surface compositions, potentially helping to constrain the magmatic evolution on Venus.
SUMMARY
Surface temperature and mantle viscosity are key factors in determining the efficiency of planetary cooling for different magmatic styles (intrusive or extrusive), as well as have a direct influence on when, where, and how much melt is produced in the mantle. Changes in the region (pressure and temperature) of the melt sources through time could be linked to the evolution of melt composition, that could be connected to present-day observations of surface composition. Our findings could provide insights on the differences in the cooling pathways of early Earth vs. Venus, and give perspectives for potential habitability of exo-Venuses.
How to cite: Herrera, C., Plesa, A.-C., Jennings, L. A., Maia, J., Breuer, D., and Klemme, S.: Evolution of melt production and melting region on Venus influenced by surface-mantle feedbacks, Europlanet Science Congress 2026, The Hague, The Netherlands, 7–11 Sep 2026, EPSC2026-1108, https://doi.org/10.5194/epsc2026-1108, 2026.
Venus hosts hundreds of enigmatic circular tectono-magmatic features known as coronae, whose origins, activity state, and role in planetary heat loss remain among the most persistent open questions in Earth and planetary sciences. Coronae display extraordinary diversity in size, morphology, topography, gravity signatures, and tectonic setting, indicating that they do not represent a single formation mechanism, but instead reflect a spectrum of dynamic processes. Understanding these structures is critical for deciphering Venus’ geodynamic evolution and present-day state. In particular, several coronae are among the prime candidates for ongoing tectonic and volcanic activity on Venus and therefore represent key targets for detecting active deformation, magmatism, and surface change with forthcoming missions such as ESA’s EnVision and NASA’s VERITAS.
Here, we first present results from a newly compiled global corona database [1] that systematically reassesses Venusian coronae using Magellan radar and topography datasets. The updated database contains 740 coronae (Figure 1), substantially more than previously catalogued, and defines coronae purely based on the original morphological definition using three identification criteria: (1) the presence of a partial or complete annulus of closely spaced concentric fractures, (2) with or without associated quasi-circular topographic relief, and (3) a minimum diameter of 60 km. Importantly, the term “corona” is descriptive rather than genetic and does not imply a specific formation mechanism. The expanded database reveals that coronae span a broad continuum of morphologies, geological settings, and can overlap with other surface feature nomenclature, such as volcanoes, paterae, novae, and arachnoids. The database further identifies numerous previously unrecognized corona-like structures, including ambiguous features embedded within tessera terrain. These observations demonstrate that coronae cannot always be treated as a uniform class of features and highlight that studies invoking specific formation scenarios may in practice investigate only subsets of the global corona population rather than the full morphological spectrum observed on Venus.
Figure 1. Global distribution centered at 130 degrees East of Venusian coronae according to our new database [1]. All 740 coronae are plotted as circles using their central coordinates and average radii. Type 1 coronae are shown in white and Type 2 in red. (b) Bar graph showing the number of Type 1 and Type 2 coronae. (c) Diameter-count distribution shown as a stacked histogram for Type 1 (gray) and Type 2 (red) coronae, together with a normalized lognormal fit (solid black line).
With the assumption that the largest coronae on Venus are formed by different types of plume-lithosphere interactions, we investigate their topography and gravity signatures in comparison with geodynamic models. We use recent three-dimensional thermo-chemical geodynamic models of plume-lithosphere interaction on Venus [2] that define four geodynamic end-member scenarios for plume-induced corona formation: (1) lithospheric dripping, (2) short-lived subduction, (3) embedded plume, and (4) underplated plume, reflecting different relationships between plume buoyancy and lithospheric strength. To enable direct comparison with observations, the modeled gravity signatures are rescaled to the spatial resolution of the Magellan gravity field, which has a typical spherical harmonic degree strength of ~75–90, corresponding to spatial resolutions of ~210–315 km. This relatively coarse gravity resolution severely limits detailed comparisons between observed and modeled corona gravity signatures, particularly for smaller-scale anomalies and narrow features. For example, only 75 out of all 740 coronae on Venus are considered “broadly resolved” in the Magellan gravity data. Nevertheless, by comparing predicted and observed free-air gravity anomalies together with topography, we identify distinct classes of coronae consistent with different styles and evolutionary stages of plume-lithosphere interaction, including scenarios in which crust is recycled back into the mantle through lithospheric delamination or subduction-like processes [3]. Of the 75 resolved coronae, 52 best match a mantle-lithosphere interaction scenario involving underlying buoyant mantle material and potentially ongoing tectono-magmatic activity.
Figure 2. Global map centered at 130 degrees East showing the geoid and the 75 coronae considered resolved in the Magellan gravity data, coloured according to their topographic and gravity signatures [3]. Circle fill and outline indicate the associated free-air gravity anomaly type, while colors represent topographic classification. Coronae with positive free-air gravity anomalies are interpreted as active sites of ongoing plume–lithosphere interaction. Of these, coronae with topographic trenches (blue, red) match modeled crustal or lithospheric recycling at plume margins, whereas those with raised rims and elevated interiors (purple) best match modeled embedded or underplated plumes [3].
Importantly, our analysis further reveals that the limited spatial resolution of the Magellan gravity field could obscure or suppress positive gravity anomalies beneath some coronae, particularly where deep annular troughs surround an uplifted interior. This suggests that a subset of potentially active coronae could be effectively “hidden” in current geophysical datasets [3]. These coronae therefore represent key observables for forthcoming missions such as ESA’s EnVision and NASA’s VERITAS. Moreover, the improved gravity resolution of these missions is expected to resolve more coronae and substantially enhance our ability to distinguish between different tectonic and magmatic regimes on Venus.
References:
[1] Gülcher, A. J. P., Sabbeth, L., E. Stofan, and Smrekar, S. E. (2025), Coronae on Venus: an updated global database and insights into morphological, geologic, and lithospheric properties. Journal of Geophysical Research: Planets, vol. 130 (5), e2024JE008749. https://doi.org/10.1029/2024JE008749
[2] Gülcher, A. J. P., Gerya, T.V., Montési, L.G.J. and Munch, J. (2020) Corona structures driven by plume- lithosphere interactions and evidence for ongoing plume activity on Venus. Nature Geoscience, vol. 13, pp. 547-554, 10.1038/s41561-020-0606-1
[3] Cascioli, G., Gülcher, A. J. P., Marzarico, E., and Smrekar, S. E., (2025), A spectrum of tectonic processes at coronae on Venus revealed by gravity and topography. Science Advances, vol. 11 (20), eadt5932, https://doi.org/10.1126/sciadv.adt5932
Acknowledgements: This research was partially conducted at the Jet Propulsion Laboratory, California Institute of Technology, under contract (80NM0018D0004) with the National Aeronautics and Space Administration.
How to cite: Gülcher, A., Cascioli, G., and Smrekar, S.: Venus' coronae enigma: Insights and limitations from geodynamic models, topography, and gravity, Europlanet Science Congress 2026, The Hague, The Netherlands, 7–11 Sep 2026, EPSC2026-837, https://doi.org/10.5194/epsc2026-837, 2026.
How to cite: Dizov, A., Dumoulin, C., Choblet, G., Tobie, G., and Čadek, O.: Geophysical characterization of Venus' large topographic rises, Europlanet Science Congress 2026, The Hague, The Netherlands, 7–11 Sep 2026, EPSC2026-1184, https://doi.org/10.5194/epsc2026-1184, 2026.
Giant impacts were common in the early evolution of the Solar System. Such an impact has been suggested to have affected the rotation of Venus and possibly its thermal evolution, causing long-lived volcanic activity.
Here, we explore a range of possible giant impacts using smoothed particle hydrodynamics (SPH). We analyse the post-impact rotation and debris disc masses to identify scenarios that can reproduce Venus’ present-day characteristics. We model post-impact interior dynamics evolution using the StagYY convection code, by transferring the thermal field obtained through SPH simulations into a 2D spherical annulus geometry. We account for the low viscosity of molten volumes of the mantle above 35% melt fraction by using an effective "eddy" thermal conductivity of 10ˆ10 W/(m.K) following Lourenço et al. (2020), and the heat flux is parametrized following Abe (1993, 1997). The evolution of the core uses a 1D parameterized model to track the temperature profile and the growth of the inner core.
We observe that a wide range of impact scenarios are consistent with Venus’ current rotation for both head-on collisions on a non-rotating Venus and oblique, hit-and-run impacts on a rotating Venus. Collisions that match consistent rotation rates typically produce minimal debris discs residing within Venus’ synchronous orbit (Bussmann et al., 2025). We select these favourable scenarios to model their long-term interior evolution.
In the simulations, giant impacts expectedly produce surface magma oceans. Their relative depths vary between different simulations depending on impact properties: from a shallow melt layer in the order of 100 km thick to a fully molten mantle from surface to core-mantle boundary for the most energetic impacts (high impactor mass and velocity). If the surface is able to radiate heat to space efficiently, the magma ocean cools down quickly and first reaches the rheological transition (35% melt fraction) in a few 100-1000 yrs. Full solidification (0% melt fraction) can take longer because of the effects of the impact on the deep interior.
Indeed, as highlighted by Marchi et al. (2023), giant impacts also deposit a considerable amount of energy in the upper layers of the core, which translates into temperatures reaching up to 104 K. This causes the base of the mantle to fully melt. The resulting liquid layers (in the core and the mantle) convect vigorously and cool the core rapidly (~104 years). The very hot mantle melt is buoyant and rises toward the surface through the solid mantle on timescales of 104-105 yrs. Plumes formed in such a way persist until the excess of heat is extracted from the core and the lower mantle reaches the rheological transition. Solidification of the surface can be delayed by plumes, but models indicate that a fully solid state is reached in a few 1-10 Myr.
After a few hundred million years, the thermal evolution of a Venus-like planet that experienced a giant impact becomes similar to that of cases devoid of impacts. The characteristics of the convection regime in both cases do not substantially differ at present-day (after 4.5 Gyr).
Abe, Y. (1993). Thermal evolution and chemical differentiation of the terrestrial magma ocean. Evolution of the Earth and Planets, 74, 41-54.
Abe, Y. (1997). Thermal and chemical evolution of the terrestrial magma ocean. Physics of the Earth and Planetary Interiors, 100(1-4), 27-39.
Bussmann, M., Reinhardt, C., Gillmann, C., Meier, T., Stadel, J., Tackley, P., & Helled, R. (2025). The possibility of a giant impact on Venus. Astronomy & Astrophysics, 702, A106.
Lourenço, D. L., Rozel, A. B., Ballmer, M. D., & Tackley, P. J. (2020). Plutonic‐squishy lid: A new global tectonic regime generated by intrusive magmatism on Earth‐like planets. Geochemistry, Geophysics, Geosystems, 21(4), e2019GC008756.
Marchi, S., Rufu, R., & Korenaga, J. (2023). Long-lived volcanic resurfacing of Venus driven by early collisions. Nature Astronomy, 7(10), 1180-1187.
How to cite: Gillmann, C., Tackley, P., Bussmann, M., Lourenco, D., Reinhardt, C., Meier, T., Stadel, J., and Helled, R.: Did giant impacts have long-term consequences on the interior evolution of Venus?, Europlanet Science Congress 2026, The Hague, The Netherlands, 7–11 Sep 2026, EPSC2026-28, https://doi.org/10.5194/epsc2026-28, 2026.
Today Venus is a dry planet with an atmosphere that contains very little water. The bulk D/H ratio in its atmosphere is further enriched by a factor of approximately 120 compared to the Earth. This suggests that more of the lighter hydrogen escaped into space over time compared to the heavier deuterium, leading to the conclusion that the planet once hosted a much larger water reservoir than today. Recent climate studies even suggest that Venus could have hosted a temperate period with a liquid water ocean and habitable conditions up to ~0.7 Gyr ago (Way & del Genio 2020). If so, (i) the ocean must have evaporated afterwards with H and D being lost into space and O being either lost into space or sequestered into the surface, and (ii) the D/H ratio likely needed to fractionate from its initially low, Earth-like value toward its present bulk value since the time of ocean evaporation. Recent analysis of Venus Express data, however, suggest that the D/H ratio in Venus’ atmosphere increases with altitude, reaching values of D/H~0.2 in the mesosphere (Mahieux et al. 2024) and even ~0.4 in the exosphere (Weichbold et al. 2025). Photochemical escape rates for D and H based on the analysis of exospheric ion cyclotron waves further suggest lower loss rates for H but higher ones for D as expected before Venus’ unexpectedly high upper atmosphere D/H ratio was revealed (e.g., Chaffin et al. 2024). Based on these novel results, we re-evaluate the evolution of Venus’ water inventory and D/H ratio over time. Our study indicates that only a comparatively small amount of H and D could have been lost since the last resurfacing event (contributing to less than 1 m global equivalent layer of water) and that the D/H ratio likely has been fractionated toward high values already relatively early in Venus’ history, potentially during an early phase when the atmospheric escape of H transitioned from hydrodynamic toward Jeans escape indicating an early loss of most of Venus’ water reservoir. A habitable ocean, as late as 0.7 Gyr ago, can therefore hardly compatible with the new findings on Venus’ upper atmosphere D/H ratio and the therewith connected escape rates of H and D. This supports recent findings that Venus has never been liquid-water habitable (Constantinou et al. 2025).
References:
Chaffin, M. S., Cangi, E. M., Gregory, B. S. et al., Venus water loss is dominated by HCO+ dissociative recombination, Nature, 629, 8011, 307, 2024, doi:10.1038/s41586-024-07261-y.
Constantinou, T., Shorttle, O., and Rimmer, P. B., A dry Venusian interior constrained by atmospheric chemistry, Nature Astronomy, 9, 189, 2025, doi:10.1038/s41550-024-02414-5.
Mahieux, A., Viscardy, S., Yelle, R.V. et al., Unexpected increase of the deuterium to hydrogen ratio in the Venus mesosphere, Proceedings of the National Academy of Science, 121, 34, e2401638121, 2024, doi:10.1073/pnas.2401638121.
Way, M. J. and Del Genio, Anthony D., Venusian Habitable Climate Scenarios: Modeling Venus Through Time and Applications to Slowly Rotating Venus-Like Exoplanets, Journal of Geophysical Research (Planets), 125, 5, e06276, 2020, doi:10.1029/2019JE00627610.1002/essoar.10501118.3.
Weichbold, F., Lammer, H., Scherf, M. et al., First Detection of Deuterium in Venus's Extended Exosphere, 2025, preprint (Version 1) available at Research Square [https://doi.org/10.21203/rs.3.rs-7720153/v1]
How to cite: Scherf, M., Weichbold, F., Erkaev, N., Lammer, H., Constantinou, T., Woitke, P., Simon-Wedlund, C., Ferus, M., Eminger, P., Rimmer, P., Kačina, J., and Němečková, K.: What does the unexpectedly high D/H ratio in Venus’ upper atmosphere imply for the existence of a late ocean?, Europlanet Science Congress 2026, The Hague, The Netherlands, 7–11 Sep 2026, EPSC2026-447, https://doi.org/10.5194/epsc2026-447, 2026.
Please decide on your access
Please use the buttons below to download the supplementary material or to visit the external website where the presentation is linked. Regarding the external link, please note that Copernicus Meetings cannot accept any liability for the content and the website you will visit.
Forward to presentation link
You are going to open an external link to the presentation as indicated by the authors. Copernicus Meetings cannot accept any liability for the content and the website you will visit.
We are sorry, but presentations are only available for conference attendees. Please register for the conference first. Thank you.
Venus is the only other Earth-sized planet in our Solar System, volcanically active and rich in volatiles, but extremely hot, dry, and hostile to life. Models suggest either that Venus was always thus [1], or that in principle it could support oceans even today [2]. While the long history of the planet may be recorded in its ancient highlands, the lowland plains host a range of features suggestive of past water. Some canali are clearly lava channels [3], but others appear similar to fluvial [4] or submarine [5] channels, and our mapping of polygonal terrain implies a submarine sedimentary origin of them. The evidence is compelling that Venus once supported oceans and lost them.
Possibly the closest terrestrial analogue for these conditions is the Messinian Salinity Crisis (MSC), 5·97 to 5·33 Ma ago, during which the Mediterranean Sea became repeatedly restricted, and evaporated in part or whole [6,7]. Nearly 10⁶ km³ of gypsum and halite, in places several kilometres thick, were precipitated [8], with exposed salt flats covering most of the Mediterranean. With sea level lowered by 2 km or more, the major rivers—notably the Nile, Rhone, Ebron and Po—carved deep canyons into the continental margins, helping to maintain brine pools within the deepest basins. Remarkably, faunal exchanges took place across this inhospitable landscape [9].
Conditions on Venus were even more extreme. In the earliest stages of the runaway greenhouse, photochemical sulphur cycling in a hot steam‑rich atmosphere would have resulted in transient, intense episodes of sulphuric acid rainfall. Under these conditions, the subaerial uplands would have experienced extreme chemical weathering and flash flood erosion [10], rapidly depositing smectite-rich clays into saturated brine ocean basins, generating thick piles of salt-rich sediments. Extensive erosion of the Venus uplands and infilling of the plains basins with sediment and salt may in part explain the subdued topography of Venus and the distribution of certain features in the plains.
Polygonal terrains are usually located towards the margins of the lowlands, and nearly all the longer canali appear within these areas and terminate in the deeper basins, consistent with an origin as submarine density currents [5] or hypersaline channels [11]. Once the oceans were finally gone, desiccation of these salt-sediment piles under a superheated steam atmosphere [12] resulted in the smaller-scale polygonal fractures superposed on them. Continued heating first lithified and then metamorphosed these sediments.
Ignoring the effects of later topographic changes, and the likelihood of repeated cycles of flooding and evaporation, a lower bound for the mass of salt precipitated on Venus can be obtained by assuming that areas below 6051·3 km radius were filled with saturated brine (at approximately 36 wt% NaCl). The mass of anhydrous halite that results is ~2 x 10¹⁹ kg, equivalent to a salt layer 64 m thick in those basins. This mass is orders of magnitudes smaller than the salt content of Earth’s oceans, suggesting that the salt deposits on Venus may host far thicker salt deposits across its lowlands.
Venus coastlines were likely steep and dynamic, precluding the establishment of long-lived, well-defined shorelines. Nonetheless, a variety of observations suggest former marine environments and possible shorelines close to the 6053 km radius contour (Fig. 1). Streamlined islands and channels can be seen parallel to some coastlines and there are hints of shoreward drainage systems above them. Taking that sea level and modern topography means oceans covered close to 90% of the surface of Venus, and had a volume about 40% of Earth’s oceans, equating to an average ocean depth of 1400 m. Interestingly, dissolving the mass of halite calculated earlier into that ocean volume gives a salinity of 35‰, about the same as terrestrial seawater. Did those oceans also support life?
It is hard to comprehend Mediterranean drying out almost completely, and the environmental impact that must have had, let alone the world losing its oceans entirely. Yet the evidence suggests that Venus did once have oceans, perhaps teeming with life, and that it lost them within the last billion years. The implications of such an event for life outside the Solar System, and on our own planet, are profound indeed.
References
1. T. Constantinou, O. Shorttle, and P. B. Rimmer, Nature Astronomy 2024 9:2 9, 189 (2024)
2. M. J. Way and A. D. Del Genio, J. Geophys. Res. Planets 125, e2019JE006276 (2020)
3. V. R. Baker, G. Komatsu, T. J. Parker, V. C. Gulick, J. S. Kargel, and J. S. Lewis, J. Geophys. Res. Planets 97, 13421 (1992)
4. A. P. Jones and K. T. Pickering, J. Geol. Soc. London. 160, 319 (2003)
5. D. Waltham, K. T. Pickering, and V. J. Bray, J. Geophys. Res. Planets 113, 2012 (2008)
6. S. Khawja, R. E. Ernst, C. Samson, P. K. Byrne, R. C. Ghail, and L. M. MacLellan, Nat. Commun. 11, 1 (2020)
7. J. M. Rouchy and A. Caruso, Sediment. Geol. 188–189, 35 (2006)
8. K. J. Hsü, W. B. F. Ryan, and M. B. Cita, Nature 1973 242:5395 242, 240 (1973)
9. B. Haq, C. Gorini, J. Baur, J. Moneron, and J. L. Rubino, Glob. Planet. Change 184, (2020)
10. J. van der Made, J. Morales, and P. Montoya, Palaeogeogr. Palaeoclimatol. Palaeoecol. 238, 228 (2006)
11. M. Roveri, V. Manzi, A. Bergamasco, F. M. Falcieri, R. Gennari, S. Lugli, and B. C. Schreiber, Am. J. Sci. 314, 751 (2014)
12. J. F. Kasting, Icarus 74, 472 (1988)
Figures
Fig. 1 Features consistent with former marine environments: (A) shoreline and wavecut platform; (B) streamlined islands; (C) submarine channel; and (D) drainage channels. Each can be explained by other processes and therefore none is diagnostic of former marine environments. Left-looking Magellan image, color-coded with stereo-derived topography, Mercator conformal projection. The anomalously deep area near the image centre is an erroneous altimeter measurement in a stereo data gap.
How to cite: Ghail, R., Crouch, E., and Mason, P.: The Messinian Salinity Crisis and the Lost Oceans of Venus, Europlanet Science Congress 2026, The Hague, The Netherlands, 7–11 Sep 2026, EPSC2026-974, https://doi.org/10.5194/epsc2026-974, 2026.
Since the first radar images were acquired of Venus’ complex, radar-bright highlands, there have been questions as to how they formed. The highlands of Venus host multiple sets of crosscutting tectonic structures, appear embayed by plains lavas, and represent the locally stratigraphically oldest terrain. There is some evidence that at least one highland may contain high-silica (i.e., felsic) rock, sharing a fundamental similarity with Earth’s continents. Current hypotheses suggest that the highlands of Venus may be formed through upwelling, downwelling, or lateral movement of crustal blocks. Here, we present large-scale (<1:5,000,000) tectonic maps of two sites in the Aphrodite Terra highland and one site in the Tellus Regio highland. At each study site, our mapping indicates multiple distinct phases of tectonic deformation. Crustal blocks that exhibit different tectonic histories within these sites are demarcated by long (~150 km) thrust faults and narrow (10s of km-wide) belts of high shortening strain. These findings support previous work at various regional mapping scales that found evidence for crustal blocks having different deformational histories in close proximity to one another in Tellus and Ovda Regiones. If these spatial arrangements of contrasting tectonic deformational histories are the result of lateral motions of crustal blocks, the highlands of Venus record tectonic history from a time when Venus’ lithosphere was experiencing a version of mobile-lid tectonics, much like how plate tectonics has helped develop high-standing, tectonically diverse continents on Earth. Our detailed mapping and quantitative analysis of map linework support the hypothesis that Venus’ highlands were formed through polyphase, lateral collisions unlike that recorded anywhere else in the inner Solar System except for Earth’s continents.
How to cite: Wratchford, L., Byrne, P., and Crane, K.: Polyphase tectonics support accretion of the Venus highlands, Europlanet Science Congress 2026, The Hague, The Netherlands, 7–11 Sep 2026, EPSC2026-273, https://doi.org/10.5194/epsc2026-273, 2026.
Please decide on your access
Please use the buttons below to download the supplementary material or to visit the external website where the presentation is linked. Regarding the external link, please note that Copernicus Meetings cannot accept any liability for the content and the website you will visit.
Forward to presentation link
You are going to open an external link to the presentation as indicated by the authors. Copernicus Meetings cannot accept any liability for the content and the website you will visit.
We are sorry, but presentations are only available for conference attendees. Please register for the conference first. Thank you.
EnVision is ESA’s upcoming Venus orbiter, planned to begin science operations at Venus in 2034. The mission is designed to investigate Earth’s sister planet as an integrated system, spanning its deep interior, surface, lower atmosphere, and upper atmosphere [1]. EnVision will address key questions concerning Venus’ geological history, present-day surface and atmospheric activity, and the coupled evolution of its interior, surface, atmosphere, and climate. To achieve these objectives, the spacecraft will operate in a low-altitude polar orbit, enabling its payload to observe the Venusian surface and atmosphere at high spatial and spectral resolution. Among its instruments is the VenSpec suite, which consists of three spectrometers [2]: VenSpec-U, operating in the ultraviolet range of 190–380 nm [3]; VenSpec-H, covering 1.16–2.48 µm [4]; and VenSpec-M, covering 0.79–1.51 µm [5]. Together, these instruments will characterize atmospheric trace gases and chemistry, search for volcanic gas plumes above and below the cloud deck, and map surface emissivity and composition.
To support EnVision, and in particular the VenSpec suite, the Venus Ground-Based Observations Working Group has been established to enhance the mission’s scientific return through coordinated observations from Earth-based facilities [6]. The Working Group has three main objectives. First, it aims to provide spectroscopic datasets across relevant wavelength ranges to help evaluate observing strategies and develop retrieval pipelines for VenSpec, with applications to both the Venusian atmosphere and surface. Second, it seeks to coordinate long-term monitoring of Venus’ atmosphere, including its dynamics and temporal variability, thereby bridging the observational gap between Akatsuki and EnVision and improving our understanding of global atmospheric behavior over the coming decade. Third, the group will encourage and organize ground-based observations during EnVision’s science phase from 2034 onward, providing valuable contextual information for measurements obtained by EnVision and VenSpec.
Our current activities include monitoring SO2 abundances at the Venus cloud top using IRTF/TEXES (5–25 μm; spectral resolving power up to 80,000) [7]; conducting high-resolution spectroscopic observations of both the dayside and nightside with IRTF/iSHELL (1.1–5.3 μm; spectral resolving power up to 90,000) to study trace gases such as CO, H2O, HDO, HF, OCS, SO2, HCl, and H2S [e.g., 8–10]; performing frequent multi-wavelength imaging with the Calar Alto telescope to investigate atmospheric dynamics through cloud morphology [11]; carrying out long-term monitoring of wind fields using Doppler shifts measured with high-resolution visible spectroscopy [12]; conducting high-spectral-resolution measurements with the High Dispersion Spectrograph at the Subaru Telescope (300–1000 nm; spectral resolving power up to 160,000) to search for molecular oxygen at the cloud top [13]; tracking the unknown absorber using ground-based spectropolarimetric measurements of Venus with NOT/ALFOSC (365–1015 nm); tracking the unknown absorber in the U band with STELLA [14]; developing an Earth-bound long-term CubeSat series, CLOVESat 1–5, planned for 2026–2042, to track the reflectivity of Venus [15]; and conducting long-term Venus monitoring with the Haleakala T60 telescope to investigate the unidentified UV absorber (300–500 nm). We also encourage collaboration with amateur astronomers. These activities will be summarized and presented in this contribution.
References
[1] Straume-Lindner, A. G., et al. 2025, EPSC-DPS Joint Meeting 2025, EPSC-DPS2025-850. [2] Helbert, J., et al. 2019, Proc. SPIE, 11128, 1112804, doi:10.1117/12.2529248. [3] Marcq, E., et al. 2025, EPSC-DPS Joint Meeting 2025, EPSC-DPS2025-395, doi:10.5194/epsc-dps2025-395. [4] Neefs et al. 2025 Acta Astronomica, 226. doi:10.1016/j.actaastro.2024.10.018. [5] Alemanno, G., et al. 2025, EPSC-DPS Joint Meeting 2025, EPSC-DPS2025-991, doi:10.5194/epsc-dps2025-991. [6] Hueso et al. 2025, EPSC-DPS2025-477, doi:10.5194/epsc-dps2025-477. [7] Encrenaz, T., et al. 2025, Astronomy & Astrophysics, 703, A219, 9. [8] Ferro-Milon, S., et al., this meeting. [9] Dias, J., et al., this meeting. [10] Sato T. M., et al. 2026, JPGU-AGU meeting 2026, PPS08-P03. [11] Sánchez-Lavega, A., et al. 2016, The Astrophysical Journal Letters, 833, L7 [12] Machado et al. 2014, Icarus, 243, 249–263. [13] Aoki, S, et al., this meeting. [14] Lee et al., 2022, Planet. Sci. J. 3 209. [15] Lee, Y. J. 2024, Europlanet Science Congress 2024, EPSC2024-158.
How to cite: Aoki, S., Hueso Alonso, R., Alemanno, G., Marcq, E., Robert, S., and Barraud, O. and the Venspec ground-based observation working group team: The EnVision VenSpec Ground-Based Observations Working Group: Current Activities and Future Plans, Europlanet Science Congress 2026, The Hague, The Netherlands, 7–11 Sep 2026, EPSC2026-300, https://doi.org/10.5194/epsc2026-300, 2026.
The Radio-Science experiment of EnVision comprises two sub-experiments (the Gravity experiment and the Radio-occultation experiment) that both relies on the Telemetry, Tracking and Command (TT&C) system of the spacecraft but that have different scientific goals and different operation modes.
The Gravity experiment
The internal structure of Venus is still uncertain (size and state of the core, mantle viscosity, average lithospheric and crustal thicknesses, as well as their lateral variations). These are key parameters to constrain the mantle composition, thermal evolution and deep interior of the planet. Without the availability of seismic data and Venus having no internal magnetic field to constrain the core state, the gravity field and the moment of inertia can be used to determine the radial structure of the planet. Thanks to its 6 cycles mission and to a 3 to 7 hours of tracking per day, the EnVision gravity field solution will improve the Magellan solution [1] by providing a better global degree strength (l=95 or 204 km at 3-σ) as well as areas of higher resolution and accuracy (<154 km over 40% of the planet, <2 mGal). The location of these areas depends on the pericenter position of the science orbit. With the current baseline orbit, the regions of lowest resolution (~200 km and 6 mGal accuracy), are located in the southern hemisphere (mainly at about 60°). Having a better resolved gravity field will allow to study gravity/topography ratios over structures of interest to understand their crustal and lithospheric morphologies [e.g.,2]. The k2 tidal potential Love number will be determined with a precision better than 1% (compared with the 22% for the Magellan solution [3]), which will result in an improved constraint of the state and the size of the core [e.g. 4]. The rotation state (spin, pole position variability) will also be improved, thanks to the tracking data and its coupling with the radar tie points.
The Radio-occultation experiment
Radio-occultations will be performed to derive the atmospheric structure (temperature, pressure, number density) and the electron density profile of the ionosphere of Venus. Thanks to the addition of a Master Reference Oscillator (developed by BHE, Hungary) that includes an Ultra-Stable Oscillator provided by CNES, the experiment will be performed in a one-way mode with two coherent downlinks (X and Ka bands), allowing to probe the atmosphere down to 35 km both at ingress and egress. Although a lot of radio-occultation experiments have already been performed by Venus Express [5,6] and Akatsuki [7], the short orbital period of EnVision (1.5 hours instead of 24 hours for Venus Epress and ~9 days for Akatsuki) and its near polar orbit will allow to cover a wide range of latitudes, longitudes and local times as well as to observe short-term temporal variations of the temperature and pressure profiles caused by atmospheric waves. Furthermore, the high expected signal-to-noise ratio and the dual X and Ka band communication will allow to study amplitude scintillations, giving access to convective velocities in the clouds [8]. Moreover, the use of a dual X and Ka band communication link will enable for the first time to estimate both liquid and gaseous phases of H2SO4 at the base of the clouds. SO2 profiles at 45-55 km will also be derived, allowing a synergy with the measurements of VenSpec-H. H2SO4 and SO2 estimates are of a great importance to better understand the sulfur cycle and, in consequence, its potential link with the planet volcanic activity.
[1] Konopliv A.S., Banerdt W.B. and Sjogren W.L., Icarus, 2-18, 139, 1999. [2] Maia, J. S., & Wieczorek, M. A., JGR Planets, https://doi.org/10.1029/2021JE007004, 2022 [3] Konopliv A.S. and Yoder C.F., GRL, vol.23 (14), 1857-1860, 1996. [4] Dumoulin C., Tobie G., Verhoeven O., Rosenblatt P. and Rambaux N., JGR Planets, doi:10.1002/2016JE005249, 2017 [5] Tellmann S., Pätzold M., Häulser B., Bird M.K. and Tyler G.L., JGR, doi:10.1029/2008JE003204, 2009. [6] Oschlisniok J., Häusler B., Pätzold M., Tellmann S., Bird M.K., Peter K. and Andert T.P., Icarus, doi:10.1016/j.icarus.2021.114405, 2021. [7] Ando, H., Noguchi, K., Imamura, T., Takagi, M., Sugimoto, N., Matsuda, Y., et al. JGR Planets, https://doi.org/10.1029/2025JE009165, 2025 [8] Oschlisniok, J., Pätzold, M., Tellmann, S., Dumoulin, C., and Rosenblatt, P. EPSC-DPS2025-642, https://doi.org/10.5194/epsc-dps2025-642, 2025.
How to cite: Dumoulin, C., Tellmann, S., Rosenblatt, P., Genova, A., Marty, J.-C., and Oschlisniok, J.: The Radio-Science Experiment onboard EnVision, Europlanet Science Congress 2026, The Hague, The Netherlands, 7–11 Sep 2026, EPSC2026-368, https://doi.org/10.5194/epsc2026-368, 2026.
EnVision is the next European Space Agency (ESA) mission to Venus, planned for launch in the early 2030s. The mission will perform a holistic investigation of Venus from its inner core to its upper atmosphere, combining radar imaging, subsurface sounding, spectroscopy, and radio science. EnVision aims to understand how Venus evolved into a world so different from Earth despite their similar size and composition. During its nominal four-year science phase in orbit around Venus, the mission will study geological activity, surface–atmosphere interactions, and atmospheric dynamics. By coupling observations of the surface, interior, and atmosphere, EnVision will provide an integrated view of the planet’s past and present evolution.
EnVision will orbit Venus on a low-altitude, short-period orbit made possible through approximately one year of aerobraking that will precede the science phase of the mission. The resulting ~50-minute low-altitude orbit, with a pericentre altitude of ~220 km and an apocentre altitude of ~540 km, will enable repeated observations of the same regions of the planet. This orbital configuration is particularly well suited for monitoring temporal surface changes, improving spatial coverage, and supporting synergistic observations between the different instruments throughout the nominal four-year mission.
The EnVision Science Operations Centre (SOC) at ESAC initiated mission preparation much earlier than for previous ESA missions to ensure the feasibility of long-term monitoring of surface and atmospheric composition changes. The mission’s suite of instruments and experiments, including the SAR altimetry mode, VenSpec UV and IR nadir spectrometers, the Subsurface Radar Sounder (SRS), and the Radio Science Experiment (RSE) dedicated to Earth radio-occultations and gravity investigations, will characterize the global distribution of atmospheric gases, low-resolution subsurface structures, the radiative state of the troposphere and mesosphere, and the gravitational field of Venus.
To maximize the scientific returns, the SOC is developing science operations tools and observation strategies together with an observation scenario framework that is sufficiently constrained to fulfil the mission’s scientific requirements while preserving flexibility for additional observations that may become necessary during the science phase.
This communication summarizes the current strategy for science operations dedicated to global observations and presents future developments aimed at strengthening the synergy between the different instruments.
How to cite: Mahieux, A., Lefort, J., Geiger, B., Belgacem, I., Du Toit, G., Straume-Lindner, A. G., Raynor, H., McSweeney, A., Voirin, T., Sikaneta, I., and Muniz Solaz, C.: EnVision Science Operation Activities: Global observation scenario, Europlanet Science Congress 2026, The Hague, The Netherlands, 7–11 Sep 2026, EPSC2026-507, https://doi.org/10.5194/epsc2026-507, 2026.
Introduction
The Cosmic Vision M5 mission EnVision from ESA will launch by the end of 2031 to study Venus for a nominal duration of 4 years. Its payload includes the VenSpec spectrometry suite, comprising three complementary spectrometers developed by BIRA-IASB, DLR, and LATMOS to study the atmosphere and surface of Venus from the UV to the infrared range. The scientific objectives of the suite are to characterize the diversity of the surface mineralogy as well as to assess the spatial distribution of gaseous species of interest (H2O, HDO, CO, SO2, SO) in order to better understand the interplay between chemistry, dynamics and surface interactions within the atmosphere of Venus [1, 2, 3, 4].
Role of the Working Group
Need for solar spectral irradiance at Venus
Given the radiative properties of the planet, the foremost signal coming from Venus in the wavelength bands used by the spectrometers on the day side is the reflected Solar Spectral Irradiance (SSI). In order to extract the planetary signal, an accurate SSI from the ultraviolet to the infrared needs to be known at the spectral resolution of the instrument channels, and at the date and position of Venus with respect to the Sun. Such an information is difficult to obtain from Earth-based or L1 observatories.
Based on this constraint and on the fact that the spectrometers’ optics will age over time, regular observations of the solar disk will be performed about every three months by the VenSpec suite to calibrate the instrument. These regular observations can also be of interest to complement Earth’s solar irradiance monitoring and global solar irradiance models.
Activities of the Working Group
The activities of the Working Group have been dedicated to the following topics of investigation:
1. to review the Solar Spectral Irradiance (SSI) data available, its consistency over time (some discrepancies are noted between different observatories and will be assessed) and its variability. Over a solar cycle, the SSI variability is lower than 0.1% in the infrared but increases at shorter wavelengths and is about 5% at 200 nm in the UV [5].
2. to work on defining the SSI indices that could be the most useful to generate the Venus-based SSI required by VenSpec especially in the UV where the variability is more important. Typical indices of interest are, for example, the MgII 280 nm doublet [6], the CaII-K bands at 393 nm and the H-1 Lyman-α line at 121.6 nm [5].
3. to review all the observatories that have generated relevant SSI indices over time, and which ones would be active during the planned nominal phase of the mission (2034-38) to be used as validation for the VenSpec generated index suites during Venus conjunction periods (e.g. the US Earth observation mission GOES-U, GOES-R; the Indian solar mission Aditya-L1).

Figure 1: Inventory of SSI monitoring missions through time with potential missions active during the EnVision mission (adapted from [8]).
4. to assess tools that have been developed to predict SSI for positions other than Earth’s in the Solar System like the Flare Irradiance Spectral Model (FISM) developed at LASP [7] and how they could be used during the mission.
5. to work on data taken at Venus by previous missions, such as Venus Express, to assess the validity of the methodology developed to obtain relevant SSI constraints at Venus’ position during the science phase of EnVision.
Conclusion & Perspectives
The Solar observations Working Group of the VenSpec spectrometry suite for the EnVision mission has started to develop a methodology to derive relevant SSI information at Venus for spectral calibration and data analysis. Preliminary assessments and applications of the methodology will be presented at the conference.
References
[1] Helbert, Jörn, et al. Infrared remote sensing and instrumentation XXVII. Vol. 11128. SPIE, 2019.
[2] Marcq, E., et al. Advances in Space Research 68.1 (2021): 275-291.
[3] Lustrement, B., et al. In Infrared Remote Sensing and Instrumentation XXXII, vol. 13144, pp. 164-196. SPIE, 2024.
[4] Robert, S., et al. Journal of applied remote sensing 19.1 (2025): 014525. doi: 10.1117/1.jrs.19.014525
[5] Woods, T. N., and M. T. DeLand. Earth and Space Science 8.8 (2021): e2021EA001740.
[6] Heath, D. F., and B. M. Schlesinger. Journal of Geophysical Research: Atmospheres 91.D8 (1986): 8672-8682.
[7] Chamberlin, P. C., et al. Space Weather 18.12 (2020): e2020SW002588.
[8] Woods, T. N., et al. Solar physics 293.5 (2018): 76.
How to cite: Lasue, J., Bolsee, D., Alemanno, G., Lopez Ariste, A., Baggio, L., Bertran, S., Chide, B., Conan, L., Juin, A., Leduc, B., Lustrement, B., Marcq, E., Pereira, N., Pinet, P., Reville, V., Robert, S., Rouanet, N., Rouillard, A., Stcherbinine, A., and Thomas, I. and the VenSpec Solar Observations Working Group: Activities of the VenSpec Solar Observations Working Group in preparation for the EnVision mission, Europlanet Science Congress 2026, The Hague, The Netherlands, 7–11 Sep 2026, EPSC2026-534, https://doi.org/10.5194/epsc2026-534, 2026.
EnVision's scientific goal is to study Venus from its core to its atmosphere, focusing on the planet's history, activities, and climate [EPSC2026-XXX]. The mission seeks to understand Venus' geological evolution, current geodynamic state, and interactions with its atmosphere. Additionally, EnVision will search for signs of past liquid water on Venus' surface.
EnVision will orbit Venus at a low-altitude on a quasi polar orbit for 6 Venus years or cycles (~ 4 Earth years). Through this nominal science phase, the mission will create comprehensive global maps of the surface [EPSC2026-XXX] but a crucial part of addressing the science objectives will be to observe high value targets from diverse types of terrains to help piece together its history. To that end, the EnVision science team has been working on a list of regions of interest to be observed with EnVision’s Synthetic Aperture Radar instrument and the Subsurface Radar Sounder.
The data generation is relatively high for a planetary mission, varying between 70 and 350 Gbit/day and the data downlink rates vary by a factor of 10 during a synodic period. Full SAR coverage cannot be achieved within the 6 Venus cycles, and coverage distribution will be dependent on the arrival date. The observing plan and hence location of observations must be adapted to the allowed data rates; observations with higher data rates such as SAR polarimetry or high resolution observations, can only be planned at certain times.
At this point in the mission development, a lot of uncertainties remain which is why we are working on reference Science Operations Scenarios to ensure the mission science objectives can be met.
The challenge of balancing the data generation, storage and downlink, means that not all potential targets can be observed and selection and prioritization is required [EPSC2026-XXX]. The SAR observations have requirements on viewing angle and overlap for repeat observations (stereo), and change detection measurements (requiring three observations), thus further limiting the opportunities to observe targets. This has been a particular focus of the EnVision science team as well as the ESA science planning team, who aim to demonstrate that the coverage in area and target type meet the mission’s objective. In this presentation, we want to break down the different operational challenges we are facing for planning targeted observations with EnVision and how our Reference Scenario addresses them to ensure mission success.
References:
[1] ESA BR-247, Cosmic Vision, Space Science for Europe 2015-2025, [2] Straume-Lindner et al. (EPSC2026-XXX), [3] Eckstein et al. (EPSC-DPS2025-1637), [4] ESA (2021), “EnVision, Understanding why Earth’s closest neighbour is so different”, Definition Study Report for the mission adoption ( Red Book), [5] Maiheux et al. (EPSC2026-507), [6] Mason et al. (EPSC2026-XXX).
How to cite: Belgacem, I., McSweeney, A., Sikaneta, I., Mahieux, A., Geiger, B., DuToit, G., Lefort, J., Voirin, T., Straume-Linder, A.-G., Raynor, H., Eckstein, P., and Muñiz Solaz, C. and the EnVision ROI WG: EnVision Science Operations Activities: Targeted observation scenario, Europlanet Science Congress 2026, The Hague, The Netherlands, 7–11 Sep 2026, EPSC2026-865, https://doi.org/10.5194/epsc2026-865, 2026.
Abstract:
The EnVision Radio-Science Experiment (RSE) will improve the determination of the gravity field of Venus using the Doppler radio-tracking data of the spacecraft during the science phase covering 6 Venusian days (or 4 Earth’s years) (Rosenblatt et al., 2021). The Venus rotation model (spin rate and pole position) is also determined with the gravity field since it provides the reference frame attached to the planet in which the gravity field is expanded in spherical harmonics. Both gravity field and Venus’s rotation model are estimated in the Precise Orbit Determination (POD) process and so their solutions are correlated. The monitoring of tie-points identified on planetary surface images is helpful to decrease this correlation. Here, we study the ability of the EnVision radio-science experiment to determine the expected spin rate periodic variations and polar drift using future EnVision Doppler data and tie-Points data determined from the radar images.
The determination of Venus spin rate and pole position
The spin rate of Venus has been obtained using a number of different methods. These include Doppler tracking data from the Pioneer Venus Orbiter and Magellan spacecraft (Konopliv et al., 1999), as well as numerous radar data from Earth and space-borne sources collected over the last 50 years (e.g. Shafer & Hensley, 1991; Davies et al., 1992; Campbell et al., 2019; Margot et al., 2021). Other methods include thermal data from the surface and Magellan altimetry data (Mueller et al., 2012). However, the published solutions differ by up to about 10 minutes, depending on the kind of data and its time span, used to estimate this rotation rate. A recent analysis of 8 years of Venus Express tracking data yields to a rotation value consistent with the previous values and reduces their widespread down to about 3 minutes (Levesque et al., 2026).
Nevertheless, it was not possible to estimate the periodic variations of the spin rate due to the inaccuracy of the reconstructed Venus Express orbit from the Doppler data (Levesque et al., 2026). Margot et al., (2021) reported variations of spin rate but no periodicities. The precession rate could not be detected using Doppler data of either Magellan or Venus Express, while the radar speckle approach developed by Margot et al. (2021) measured a precession rate providing a 7% error on the Moment of Inertia (MoI) of the planet. This error is however too large to further constrain the interior structure of Venus (Dumoulin et al., 2017). The performance analysis of the EnVision Radio-Science Experiment (RSE) has shown that the spin rate could be retrieved with an error of 0.03 minute and the MoI with an error of 1.9%, allowing for better constraining the internal structure of Venus (Rosenblatt et al., 2024).
The determination of polar drift and spin rate periodic variations
Venus's expected Chandler Wobble is a slow motion of the spin pole with respect to the surface of the planet, which on a timescale of a few years should correspond to a linear drift of 22 m/yr across the surface (Phan &, Rambaux, 2025). This polar drift is sensitive to the state and size of the Venus’s core, so it could be used to further constrain the interior of the planet (Phan & Rambaux, 2025).
The spin rate periodic variations are expected to have three different sources of variations induced by the triaxiality of Venus’ figure, by the exchange of angular momentum between the atmosphere and the solid planet and by the core-mantle coupling. The amplitude of these three sources are respectively 2 minutes, 25-50 seconds and 3.5-20.4 seconds (Cottereau et al., 2011).
We perform the simulations of the Doppler tracking data using the GINS software, and of the tie-points determined from the radar images in order to assess the accuracy of the retrieved spin rate periodic variations and polar drift from EnVision.
References:
Campbell B. A. et al. (2019), Icarus 332, 19–23 ; Cottereau L. et al. (2011), Astronomy and Astrophysics - A&A 531, 45 ; Davies M. E. et al. (1992), Celestial Mechanics and Dynamical Astronomy 53(4), 377–397; Konopliv A., et al. (1999), Icarus 139(1), 3–18 ; Lévesque M. et al. (2026), Planetary Science Journal, 7:21 (11 pp) ; Margot J.-L. et al. (2021) Nature Astronomy 5(7), 676–683 ; Mueller N. et al. (2012), Icarus 217(2), 474–483 ; Phan P.-L. & Rambaux N. (2025). Astronomy & Astrophysics 699, A65 ; Rosenblatt P. et al. (2021), Remote sensing, vol. 13, 1624; Rosenblatt P. et al. (2024), EPSC2024–410 ; Shaffer, S. & S. Hensley (1991), Interoffice Memo, Pasadena, California, USA n°3346-91-112.
How to cite: Rosenblatt, P., Rambaux, N., Dumoulin, C., Marty, J.-C., Phan, P.-L., Laurent-Varin, J., and Lévesque, M.: Spin rate periodic variations and polar drift determination from the EnVision radio-science experiment., Europlanet Science Congress 2026, The Hague, The Netherlands, 7–11 Sep 2026, EPSC2026-945, https://doi.org/10.5194/epsc2026-945, 2026.
Introduction
The Venus Climate Database is a tool designed to provide to the scientific and engineer community working on projects linked to Venus a realistic description of its atmospheric climatology, based on simulations of the Venus PCM [1,2]. The current version, VCD v2.3, was released in late 2023 and is now used by roughly 180 users from 21 countries.
One of the main goal is to provide a robust assessment of the thermosphere of Venus, for aerobraking studies, in particular in relation to current mission projects such as EnVision. Thanks to ESA funding, our team has worked to investigate some processes that are source of uncertainty in the thermospheric circulation, as well as to include new scenarios from other GCMs.
Updates of the Venus PCM simulations
Some modifications have been implemented in the Venus PCM to improve some parameterizations. This includes :
-
adjustments of the gravity wave parameterization scheme: the polar regions now benefit from GW oriented in all directions. The transition between E-W orientation and full random is done around 45-55° of latitude. This modification is based on observations of GW orientations in the polar region at cloud level and above.
-
A new molecular diffusion scheme has been implemented.
-
Modifications have been done in the photochemistry, with some cross section updates (SO, S2), addition of OSSO isomers, ClSO and Cl2SO2. All these modifications are affecting composition up to 100-130 km, but not above.
These modifications lead to a small reduction of the tuning needed on oxygen atom production, and the main impact is visible in the temperature structure of the polar thermosphere. It also affected the variability on the thermospheric density, in particular on the night side where this variability is highest.
New concept: scenarios from additional GCMs
The main change in this new version of the VCD is the possibility to access scenarios that are built from simulations of other GCMs. Invitations were sent to other models of the Venusian atmosphere to provide the needed simulations so that the VCD team can produce scenarios based on these results. In VCD v3.1, we have included scenarios based on the AFES-Venus model [3], with a scenario associated to a free run, and a second one based on data assimilation [4]. Additional models may be included in the future. The protocole for the production of needed simulations is available on demand by contacting the VCD team. This feature allows for comparison between models, and help the user to build a more robust view of the model dependency of the provided climate and variabilities.
In practice, new flags have been implemented to label the different scenarios in an intuitive way. Undefined values are output for any variable or location that is not present in the requested scenario. Some examples are provided in Figures 1 and 2.
Figure 1: Example of zonal wind profiles in VCD v3.1, with Venus PCM scenario 11 (basic albedo and EUV) and AFES-V scenarios 101 (free run) and 102 (data assimilation run).
Figure 2: Zonal and temporal averages for temperature and zonal wind fields, in three different scenarios of the VCD v3.1.
An additional improvement that should be useful to users: some code re-engineering has been done in order to improve significantly the speed of successive queries, in particular in the case of the tracking of atmospheric fields along a spacecraft trajectory.
The VCD v3.1 should be released to the public before the end of the year 2026.
References
[1] Martinez A. et al. (2023) Icarus 389, 115272, 10.1016/j.icarus.2022.115272.
[2] Martinez A. et al. (2024) Icarus 415, 116035, 10.1016/j.icarus.2024.116035
[3] Sugimoto N. et al. (2014) J. of Geophys. Res. Planets 119, 1950-1968, 10.1002/2014JE004624
[4] Sugimoto N. et al. (2017) Sci. Reports 7, 9321, 10.1038/s41598-017-09461-1
How to cite: Lebonnois, S., Millour, E., Kovalenko, I., Liu, J., Martinez, A., Forget, F., and Cipriani, F.: Some news about the Venus Climate Database: version 3.1, Europlanet Science Congress 2026, The Hague, The Netherlands, 7–11 Sep 2026, EPSC2026-317, https://doi.org/10.5194/epsc2026-317, 2026.
One of the goals of the NASA-led VERITAS mission to Venus is to produce a global, high-resolution digital elevation map (DEM). Its X-band radar instrument, VISAR (Venus Interferometric Synthetic Aperture Radar), will enable imagery and topographic mapping at resolutions two orders of magnitude higher than previously achieved by the Magellan mission. However, it will face fundamental challenges concerning the calibration of the initial DEMs due to limited orbital position accuracy and severe atmospheric path delay (hundreds of meters compared to meters on Earth). These challenges cannot be approached as for Earth-orbiting missions given the lack of precisely-calibrated ground reference targets and the absence of GNSS-like systems. Therefore, the VERITAS mission will instead exploit VISAR imagery to improve our knowledge of the orbital position and attitude of the spacecraft by incorporating repeated observations of the same ground features from different viewing geometries into the orbit determination routine and to calibrate the DEM.
Extracting calibration points from images that can subsequently be localized and used as references, however, requires a robust feature matching algorithm. Although there already exist several matching algorithms which have demonstrated strong performance with optical imagery, their effectiveness can degrade significantly when applied to SAR data. This degradation is due to inherent differences in the measuring principle of optical and radar systems (depending on angle of incoming light versus travel time of radar pulses, respectively), and different noise processes.
This work evaluates the performance of existing feature matching algorithms on SAR imagery with the goal of identifying the most suitable approach for VERITAS data. To conduct these tests, TerraSAR-X spaceborne X-band SAR imagery was acquired over a Venus analog site in the Askja region of Iceland. Importantly, we use a postprocessed version of this dataset which mimics the resolution of different VISAR products to enable a meaningful interpretation of our results. Furthermore, we test both radar-coordinate and geocoded imagery, as the latter is expected to offer better performance for classic feature matchers, but the former is less sensitive to errors in the assumed topography of Venus (which still relies on low-resolution Magellan data).
Our study offers a comparative performance baseline for feature matching algorithms on SAR data in the Venus exploration context. The results enable an evidence-based decision on the optimal approach for the development of algorithms suitable for VERITAS data, and showcase remaining challenges and opportunities for the entire VISAR DEM calibration pipeline.
How to cite: Pasquariello, V. and Köhne, T.: Identifying control point features in Venus-like radar imagery for VERITAS calibration purposes, Europlanet Science Congress 2026, The Hague, The Netherlands, 7–11 Sep 2026, EPSC2026-319, https://doi.org/10.5194/epsc2026-319, 2026.
Recent orbiters from ESA and JAXA have revealed an unexpected degree of temporal variability in Venus's atmosphere. Which processes have driven the reported variability in reflectivity, SO2 gas abundance, super-rotation wind speed, and cloud structures? This question requires a better understanding of surface volcanic activity and its outgassing, cloud-formation processes, material transport between the deep atmosphere and the cloud-top level atmosphere, atmospheric wave activity, and the impacts of solar activity on the planetary atmosphere.
In Korea, the Nuri launch vehicle successfully delivered multiple spacecraft to a designed Earth orbit. As a next step toward its application to an interplanetary mission, we propose a small-scale mission to Venus. We evaluate the scientific impact, the Nuri launcher’s limited mass capacity, the country's technical capabilities, and its significant potential for international scientific collaboration. Our concept study aims to acquire an imaging spectral dataset using stereo observations, enabling characterization of three-dimensional structures and their variability at the cloud-top level over the dayside, and of deeper atmospheric structures, down to 10 km altitude, using the CO2 atmospheric windows at the nightside. Our target wavelength range, therefore, extends from 200 nm to 2600 nm, and identical imaging spectrometers shall be used on two spacecraft to observe the same locations simultaneously on the dayside or nightside. Such stereo observations are only possible by using more than one spacecraft. We present our concept study for further international collaboration.
Our concept mission assumes a 2030 operational timeline, which may overlap with or follow ESA’s EnVision and NASA’s VERITAS and DAVINCI. Therefore, information on active volcanic areas and atmospheric properties will benefit our data interpretation and reveal the driving forces of the observed atmospheric variability. As Venus is often described as Earth's twin planet due to its physical similarities, such as radius and mass, a better understanding of this planet will enhance our general knowledge of Earth-like exoplanets with volcanism. We conduct this concept study under the Korea Aerospace Administration (KASA)’s planning research funding.
How to cite: Lee, Y. J. and Streel, N. and the Korean Venus exploration planning team: Concept study for Korea’s future Venus exploration to understand the three-dimensional structures of the variable atmosphere, Europlanet Science Congress 2026, The Hague, The Netherlands, 7–11 Sep 2026, EPSC2026-940, https://doi.org/10.5194/epsc2026-940, 2026.
Radio occultation measurements at Venus have provided key insights into the structure of the planet’s atmosphere. One particularly remarkable phenomenon revealed by these observations is the presence of radio scintillations—rapid fluctuations in signal intensity. These scintillations are caused by small-scale irregularities in the atmospheric refractive index, which are associated with fine-scale density variations. A likely source of these density fluctuations is vertically propagating internal gravity waves originating from the convective layer located at altitudes between roughly 50 and 55 kilometers.
Frequency-dependent radio scintillations have been observed in atmospheric regions characterized by enhanced static stability, where the propagation of gravity waves is favored. This finding supports the interpretation that gravity waves are a plausible source of the observed scintillations. Consequently, the analysis of radio scintillations provides valuable information about the intensity and global distribution of gravity waves, as well as about the strength of the convective winds responsible for generating them.
We present the results of a scintillation analysis based on X-band radio occultation data from the mission Venus Express and compare them with earlier observations and model predictions. In addition, we discuss the expected outcomes of the forthcoming radio scintillation investigations of the mission EnVision and emphasize the advantages of combining X-band and Ka-band radio signals.
How to cite: Oschlisniok, J., Tellmann, S., Pätzold, M., Häusler, B., and Peter, K.: Radio Scintillations observed with Venus Express, Europlanet Science Congress 2026, The Hague, The Netherlands, 7–11 Sep 2026, EPSC2026-88, https://doi.org/10.5194/epsc2026-88, 2026.
The UVI camera onboard the JAXA Akatsuki mission provided long-term series of images of the Venus cloud tops at 283 nm and 365 nm – two wavelength that correspond to the spectral bands of gaseous sulfur dioxide and UV absorber. We used the automated correlation method to track motions of the cloud features and derive wind speed and its variations for two observation intervals of one Venusian year each: October 2019 – April 2020 (S07) and April 2022 – September 2022 (S11). The mean zonal velocity derived from 283 nm images at noon is by up to 5 m/s higher than the speed measured at 365 nm. Also the afternoon peak of zonal velocity at 283 nm is shifted towards evening terminator with respect to that measured at 365 nm. Zonal velocity increases with phase angle that implies positive altitude gradient of the wind velocity. This might suggest that the radiation at 283 nm forms in slightly higher layers than that at 365 nm that can explain the difference in velocity measured in two spectral bands. We found a dependence of the atmospheric dynamics and planet albedo on the position of Y feature. The strongest correlation within pairs of images in 283 nm and 365 nm is observed in the heading part of the Y feature resulting in closer wind speeds measured in these channels.
How to cite: Patsaeva, M., Khatuntsev, I., Ignatiev, N., and Titov, D.: Circulation of the Venus atmosphere from two years of Akatsuki UVI camera observations, Europlanet Science Congress 2026, The Hague, The Netherlands, 7–11 Sep 2026, EPSC2026-1093, https://doi.org/10.5194/epsc2026-1093, 2026.
Sulphur dioxide (SO2) is arguably the most variable trace at Venus’ cloud top, with observable column density variations spanning about 2-3 orders of magnitude over spatial extents ranging from a few hundred of kilometers to planetary scale, and over time scales ranging from about an Earth day to several decades [2, 3, 1-6]. The most recent extensive datasets on the day side have been acquired by the UV spectrometer SPICAV-UV on board ESA’s Venus Express (2006-2014) operating in nadir mode, and by the UV imager UVI on board JAXA’s Akatsuki (2015-2025), both using SO2 UV absorption featured in the solar light reflected by the cloud top.
Both instruments agree about the latitudinal distribution of SO2, enhanced at lower latitudes compared to higher latitudes due to the interplay between the vertical-meridional general circulation and photochemical destruction. There is however a discrepancy between the two datasets regarding the SO2 distribution with respect to local solar time. Whereas SPICAV-UV [3] found a minimum near the subsolar point at noon, UVI [5] evidenced a morning/evening asymmetry with an afternoon maximum, consistent with the effect of solar tides and with recent 3D photochemical-dynamical coupled numerical models [4].
Recent advances in radiative transfer numerical calculations, especially involving 3D Monte-Carlo solvers such as htrdr-planets [7], now allow for simulating accurately the solar light scattered even for large solar zenith angle values such as near the morning and evening terminators (Fig. 1). This part of the SPICAV-UV dataset could not be processed before using pseudo-spherical radiative transfer solvers like DISORT, and thus the corresponding reflectance spectra were dismissed from previous analyses. Using an updated Venus atmospheric model and a corrective approach involving both DISORT and htrdr-planets (combining DISORT’s computation speed and htrdr-planets’ accuracy), we will present our reanalysis of the whole SPICAV-UV data set, including regions near the terminator. We will then examine if the trends seen in climatological variables such as SO2, O3, cloud top altitude, or the UV absorber with respect to latitude, longitude and local solar time are consistent with previous findings.
Figure 1: Comparison of synthetic radiance factors for the nominal case using two different solvers, DISORT (pseudo-spherical, red) and htrdr-planets (Monte Carlo 3D, black). Both solvers agree at low solar zenith angle (SZA) values, but DISORT underestimates significantly Venus’ brightness for a grazing Sun near the terminator.
This work has been funded by the French National Research Agency (ANR), project RaD3-net, grant number ANR-21-CE49-0020.
-
Bibliography
-
[1] Encrenaz et al., A & A (2012)
-
[2] Marcq et al., Nature Geosci. (2013)
-
[3] Marcq et al., Icarus (2020)
-
[4] Stolzenbach et al., Icarus (2023)
-
[5] Iwanaka et al., JGR Planets (2025)
-
[6] Encrenaz et al., A & A (2025)
-
[7] He et al., JQSRT (2026)
How to cite: Salugová, E., Marcq, E., He, Z., Vinatier, S., and Bertaux, J.-L.: Cloud top sulphur dioxide measurements from the morning to the evening terminator on Venus, Europlanet Science Congress 2026, The Hague, The Netherlands, 7–11 Sep 2026, EPSC2026-549, https://doi.org/10.5194/epsc2026-549, 2026.
With the most complex cloud structure among the terrestrial planets of our solar system, Venus atmosphere has been studied for decades, but many questions are still far from being answered. What is clear, however, is that understanding clouds is key to comprehending the overall behaviour of this dense atmosphere. Venusian aerosols are frequently modeled as a four mode distribution with sizes ranging from 1 to more than 3 microns located mainly between 45 and 75 km in altitude, although its upper bounder varies latitudinally [1,2]. Its composition is still under discussion, especially for the biggest particles [3], but a concentrated solution of sulfuric acid seems to be the main component. Sulfuric acid is photochemically produced from SO2 and H2O at the upper cloud altitude [4], where the temperature structure shows strong latitudinal variability [5]. The radiative energy balance is also affected by the cloud structure since the cloud top altitude affects both cooling and heating rates [6]. Furthermore, cloud-tracking based on infrared nightside images constitutes the most usual way to study both lower cloud dynamics [7] and winds in the upper clouds [8].
The Visible and Infrared Thermal Imaging Spectrometer (VIRTIS) onboard Venus Express mission was designed to study both Venus atmosphere and surface through its three channels [9] providing invaluable data to study the vertical structure of the clouds and its variability [1,2,10]. However, the retrieval of atmospheric properties through radiative transfer calculations is usually an inverse multiparametic problem in which the effect of different parameters on the simulated radiance is coupled. This is the case for Venus infrared windows, from which it is not easy to disentangle the effect of temperature, cloud, minor gases and surface [11,12]. Moreover, different models in which different parameters have been retrieved can also lead to similar fits to the data.
We wanted to delve deeper into this problem, focusing on the vertical distribution of the aerosols since there is no previous exhaustive analysis on the number of free parameters required and supported by these observations. One of the most widely used parameterisations is the use of ‘mode factors’, i.e., altitude-independent multiplicative values that affect the number density but not the altitude distribution [5]. Aerosol exponential profiles in which the aerosol scale height and cloud top are taken as free parameters are also frequently present in the literature [8,10]. In our work, we used Haus et al. [5] description of the aerosol vertical distribution and we studied whether varying individual parameters actually provided more information than using ‘mode factors’.
To do so, we used archNEMESIS [13] as radiative transfer code, which implements MultiNest [14], a Bayesian inference tool based on nested-sampling algorithms and studied individual spectra convering mid-latitude, cold collar and South Polar Vortex regions to analyse the information content on the different aerosol modes contained in each of them to find their most informative description. This is feasible thanks to the Bayesian evidence, which is a measure of the probability that the model truly represents the observations. This allows us to compare models with different parameterisations of the aerosols and to choose the one that achieved the highest Bayesian evidence. Furthermore, this technique also allows us to study the correlation between the parameters and, as traditional retrieval schemes, to determine atmospheric parameters and their uncertainty. With the parameterisation proposed here to retrieve the aerosol vertical distribution, we will re-analyse the temperature and cloud structure variability from the entire VIRTIS-M-IR nightside dataset in a forthcoming work. This future study will include the retrieval of instantaneous maps of atmospheric properties for each observation thanks to a clustering preprocessing applied to the measurements. It will also serve as an initial validation of the use of Bayesian methods to determine Venusian atmospheric properties, which could be very useful for analysing data from future missions such as Envision.
References:
[1] Ignatiev et al. (2009), JGR 114.
[2] Haus et al. (2014), Icarus 232,232-248.
[3] Mogul et al. (2025), JRG 130.
[4] Titov et al. (2018), SSR 214, 126.
[5] Zasova et al. (2006), CR 44, 364-383.
[6] Garate-Lopez and Lebonnois (2018), Icarus 313, 1-11.
[7] Hueso et al. (2015), PSS 113-14,78-99.
[8] Garate-Lopez et al. (2015), Icarus 245, 16-31.
[9] Piccioni et al. (2007), ESA Special Publication
[10] Lee et al. (2012), Icarus 217, 599-609.
[11] Haus and Arnold (2010), PSS 58, 1578-1598.
[12] García Muñoz et al. (2013), PSS 81, 65-73.
[13] Alday et al. (2025), JORS 13.
How to cite: Reyes-Guerrero, J., Pérez-Hoyos, S., and Garate-Lopez, I.: Retrieval of Venus' aerosols vertical distribution: a Bayesian approach, Europlanet Science Congress 2026, The Hague, The Netherlands, 7–11 Sep 2026, EPSC2026-247, https://doi.org/10.5194/epsc2026-247, 2026.
Recent studies of the Venusian upper atmosphere revealed a sudden increase in the deuterium-to-hydrogen ratio (D/H) above the main cloud layer using observations from the Solar Occultation in the InfraRed (SOIR) instrument onboard Venus Express. In addition, analyses of magnetic field and plasma measurements from Venus Express identified two distinct populations of hydrogen (H) and deuterium (D) in the upper atmosphere and exosphere of Venus: a thermal and a nonthermal component. Unlike the thermal population, the nonthermal H and D atoms possess sufficient energy to populate the extended exosphere and represent a major source of atmospheric escape.
The nonthermal H and D populations are believed to originate from photochemical reactions occurring in the upper atmosphere of Venus between altitudes of approximately 100 km and 250 km. In this study, we apply a Monte Carlo model to trace the trajectories and evolution of nonthermal H and D atoms from their source regions through the upper atmosphere and into the exosphere. The model follows the particles until they either become thermalized through collisions or escape into the extended exosphere.
By comparing the modeled exospheric populations with observations of H and D in the extended Venusian exosphere, we investigate which photochemical reactions are most important for populating the exosphere and driving the atmospheric escape of hydrogen and deuterium. These results provide new insights into the long-term evolution of water and atmospheric loss processes at Venus.
How to cite: Weichbold, F., Scherf, M., Lammer, H., and Woitke, P.: Tracing Nonthermal Hydrogen and Deuterium From the Upper Atmosphere to the Venusian Exosphere, Europlanet Science Congress 2026, The Hague, The Netherlands, 7–11 Sep 2026, EPSC2026-1044, https://doi.org/10.5194/epsc2026-1044, 2026.
Our results. We present preliminary new simultaneous measurements of cloud mode 3 aerosol opacity, CO, H2O abundances and the D/H ratio below the nightside clouds of Venus (30-45 km), using IRTF/iSHELL observations in the K3 mode (2.26-2.55 µm), obtained on 6th-25th February 2025. The 1.5x5’’ slit was used, with an effective spectral resolution of ~25 000. Scans of Venus were performed by placing the slit next to the limb of the planet and then drifiting it across the disk towards the terminator. We investigated possible correlations between mode 3 opacity, CO and H2O abundances, and with the D/H ratio, and compared with previous studies [1,2,3,4].
Trace species and cloud opacity correlations. Our goal is to investigate correlations between trace gases and cloud morphologies, to constrain models of upwelling and downwelling, cloud formation and dissipation in Venus’ atmosphere, which are still poorly understood [5,6,7]. Simultaneous cloud and trace species maps allows us to study the coupled dynamics, chemistry and cloud microphysics, with some hints of correlations in previous studies [8,9]. Maps of CO and OCS were found to be anti-correlated in latitude [2,10] and may constrain circulation due to the Hadley-cell and photochemistry processes.
The vertical gradient of H2O. Moreover, we investigated the vertical gradient of H2O and the D/H ratio (0-45 km), using available IRTF/iSHELL data from the 1.74 µm and 1.18 µm emission windows. Measuring H2O below the clouds is crucial to understand its role in the greenhouse effect, on the formation of sulfuric acid clouds [11] and on surface-atmosphere reactions [12], The D/H ratio can interpreted as a tracer of atmospheric evolution. Its high value, ~ 100 D/H (Earth) (VSMOW) [1, 10], could point to a loss of a primordial ocean [13], or alternatively it could reflect a balance between loss by escape and supply by a source, such as volcanic outgassing [14].
Our program aims to provide monitoring of trace species abundances and cloud opacities, which can be investigated in the context of previous observations (Venus Express, Akatsuki) and will be useful for future missions (EnVision, VERITAS), to improve our understanding of the chemical and dynamical cycles in Venus’atmosphere and the divergent evolution between these two planets.
Data treatment. The data reduction, including wavelength calibration, flat-fielding, sky subtraction, telluric correction and flux calibration were performed using the standard Spextool 5.0.3 software [15,16], following the standard procedure from previous observations [17]. Straylight subtraction was done by simulation of the dayside crescent using the Planetary Spectrum Generator [18]. These were appropriately scaled for each nightside spectra. The scaler was determined using the saturation of spectrally resolved CO lines in the 2.32-2.35 µm range, following [17]. Retrievals of minor species abundances were obtained using the ASIMUT-ALVL radiative transfer code, extensivelly used for forward modeling and retrieval of minor species in Earth and Mars atmospheres [19,20,21,22].
Model Input. For atmospheric input, we used the trace species abundance profiles taken from [10] and the temperature-pressure profile from [23]. Linelists were taken from the HITRAN2020 molecular database and are broadened by CO2.. The CO2 line profiles were modeled using a sublorentzian lineshape [24]. The opacity is assumed constant in the entire 2.3 µm window, as an approximation [25]. For H2O, an updated linelist of spectroscopic parameters is used, in which priority is given to the most recent CO2-collisional parameters computed by [26] for the 1.18 µm, 1.38 µm, 1.74 µm and 2.3 µm windows. More recent calculations from [27] at 2.7 µm and 6 µm were then added. When CO2-specific parameters were not available, air-collisional parameters from HITRAN2020 were used, with the broadening parameters multiplied by the empirical factor of 1.7, which currently represents the best approximation for CO2-collisional parameters. We used the cloud particle profiles defined in [28]: mode 1, mode 2, mode 2p and mode 3, with effective radii of 0.49 µm, 1.18 µm, 1.56 µm and 4.25 µm [28]. We defined a cloud model that includes particles of 75 % H2SO4 and 25 % H2O by weight [29].
References. (1) Marcq et al. 2023, Icarus; (2) Arney et al. 2014, JGR:Planets; (3) Bézard et al. 2007, JGR; (4) Pollack et al. 1993, Icarus; (5) Stolzenbach et al. 2023, Icarus; (6) McGouldrick et al. 2021, The Planetary Science Journal; (7) Bierson et al. 2020; (8) Bell et al. 1991; (9) Tsang et al. 2010; (10) Marcq et al. 2006; (11) Krasnopolsky et al. 1994; (12) Fegley et al. 2003; (13) Donahue et al. 1999; (14) Grinspoon et al. 1993; (15) Cushing et al. 2004; (16) Vacca et al. 2003; (17) Marcq et al. 2021; (18) Villanueva et al. 2018; (19) Vandaele et al. 2006; (20) Drummond et al. 2008; (21) Aoki et al. 2021; (22) Trompet et al. 2023; (23) Zasova et al. 2006; (24) Bézard et al. 2011; (25) Tonkov et al. 1996; (26) Ducreaux et al. 2025; (27) Régalia et al. 2019; (28) Haus et al. 2010; (29) Palmer Williams 1975.
Funding. JAD acknowledges funding through the research grants UID/04434/2025 and a fellowship grant 2022.09859.BD.
How to cite: Dias, J., Machado, P., Robert, S., F. Young, E., A. Bullock, M., and Quirino, D.: Monitoring trace species and cloud opacity in the lower atmosphere of Venus using IRTF/iSHELL, Europlanet Science Congress 2026, The Hague, The Netherlands, 7–11 Sep 2026, EPSC2026-102, https://doi.org/10.5194/epsc2026-102, 2026.
The deuterium-to-hydrogen [D/H] ratio in atmospheric water vapour is a key tracer of Venus’s water history. Previous measurements by the Pioneer Venus entry probe [1] together with Fourier Transform Spectrometer observations from ground-based telescopes [2] [3] in the 1980s revealed a D/H ratio in Venus’s deep atmosphere of about 150 times the terrestrial standard. This result was interpreted as evidence of atmospheric escape, which preferentially removes hydrogen and enriches deuterium over geological timescales, suggesting that Venus lost a significant amount of water. However, the reported values have relatively large uncertainties: 150 VSMOW from the Pioneer Venus entry probe [1], while 120 ± 40 VSMOW [2] and 157 ± 15 VSMOW [3] by ground-based telescopes for disk-averaged values. No new measurements have been reported since the last observations in the 1980s. Furthermore, no spatial map of the D/H ratio in the lower atmosphere has ever been obtained.
Unlike the upper atmosphere, which is dominated by photochemistry, the deep atmosphere below the thick cloud layer is dominated by thermodynamic equilibrium chemistry [4]. This region acts as a reservoir, preserving the “memory” of Venus's water inventory. Probing these deep layers is essential for measuring the bulk D/H ratio independently of the cloud microphysics and photodissociation processes at higher altitudes. By resolving the vertical distribution of this ratio from the deep to the upper atmosphere, and linking the bulk value to the escape zone, we can constrain the fractionation factor [5]. This is a key diagnostic for distinguishing between two evolutionary scenarios that could explain the enhanced D/H ratio: a massive escape from a past primordial ocean [1] or a steady-state balance maintained by current volcanic and/or cometary supplies [5]. Furthermore, detecting local anomalies would reveal active volcanic outgassing and thus constrain the proposed scenarios. Given that a 10% variation in bulk D/H can alter the estimated volume of escaped water by an order of magnitude, these deep atmospheric measurements are crucial for reconstructing the history of Venus. To better constrain the D/H ratio in the deep atmosphere, new spatially resolved observations with better sensitivity are therefore required.
In this study, we conduct high-resolution spectroscopy of Venus’s nightside using the iSHELL instrument at NASA InfraRed Telescope Facility (IRTF) to observe H2O and HDO in the deep atmosphere of Venus and retrieve updated D/H values. The observations were carried out on 11 February 2022, when the apparent diameter of Venus was 41.2” and the Doppler shift between Earth and Venus was 11.31 km s-1. The observations were conducted under a small illuminated fraction of the disk, approximately 25%, in order to minimize stray light from the bright crescent and enable sensitive measurements of the nightside thermal emission. We observed the nightside of Venus in the K3 band, covering 2.26–2.55 μm, which probes the lower atmosphere at altitudes of approximately 30–40 km. This spectral region allows the simultaneous detection and separation of H2O and HDO absorption lines. We used the narrowest slit width of 0.375″, corresponding to a resolving power of λ/Δλ ~ 75,000, which is required to resolve individual absorption lines and distinguish Venusian features from telluric contamination. The observing strategy was designed to map the nightside disk by placing the slit at five different positions across Venus, with the slit aligned in the east-west direction.
The observed data were reduced using standard procedures, including sky subtraction, flat-fielding, and spectral calibration. A small contribution of scattered light from the dayside crescent was characterized and removed using observational data obtained from the dayside crescent. The flux calibration was based on radiance predicted by radiative transfer calculations. The HDO/H2O ratio is retrieved together with the volume mixing ratios of CO, HF, SO2, and OCS using radiative transfer calculations, and the results will be discussed.
References
[1] T.M. Donahue, J.H. Hoffman, R.R. Hodges Jr., A.J. Watson, Venus Was Wet: A Measurement of the Ratio of Deuterium to Hydrogen. Science 216, 630-633 (1982). doi:10.1126/science.216.4546.630
[2] G.L. Bjoraker, H.P. Larson, M.J. Mumma, R. Timmermann, J.L. Montani, Airborne observations of the gas composition of Venus above the cloud tops: measurements of H2O, HDO, HF, and the D/H and 18O/16O isotopic ratios, in AAS/Division for Planetary Sciences Meeting Abstracts #24. Bulletin of the American Astronomical Society, vol. 24, 1992, p. 995 link
[3] C. de Bergh, B. Bézard, T. Owen, D. Crisp, J.P. Maillard, B.L. Lutz, Deuterium on Venus: Observations From Earth. Science 251, 547–549 (1991). doi:10.1126/science.251.4993.547
[4] E. Marcq, F.P. Mills, C.D. Parkinson, A.C. Vandaele, Composition and Chemistry of the Neutral Atmosphere of Venus. Space Sci Rev 214, 10 (2018). doi:10.1007/s11214-017-0438-5
[5] D.H. Grinspoon, Implications of the high D/H ratio for the sources of water in Venus’ atmosphere. Nature 363, 428-431 (1993). doi:10.1038/363428a0
How to cite: Ferro Milon, S., Aoki, S., Nakagawa, H., Iwanaka, T., Sagawa, H., Sato, T., Robert, S., Vandaele, A. C., Marcq, E., Yoshida, T., and Terada, N.: Ground-based measurements of the D/H ratio in the deep atmosphere of Venus from 2022 IRTF/iSHELL Observations, Europlanet Science Congress 2026, The Hague, The Netherlands, 7–11 Sep 2026, EPSC2026-746, https://doi.org/10.5194/epsc2026-746, 2026.
The Venusian atmosphere serves as a natural laboratory for understanding atmospheric chemistry that cannot be observed in the terrestrial atmosphere. Different chemical processes occur at different altitudes: photochemistry driven by solar UV radiation in the upper atmosphere, cloud formation- and dissipation-related chemistry in the cloud layer, and thermodynamic equilibrium controlled by high temperatures in the lower atmosphere. Another categorization can be made in terms of chemical cycles, such as, sulfur oxides (SOx), carbon oxides (COx), and chlorides (Clx). Observational constraints on the spatial and temporal variability of trace gases associated with these cycles can help us better understand atmospheric chemistry.
We have observed high-resolution (R ~ 75,000) spectra of the Venusian dayside using iSHELL mounted on the 3.2-m NASA Infrared Telescope Facility (IRTF) on Mauna Kea since 2018. The iSHELL instrument is a cross-dispersed high-resolution echelle spectrograph operating over the wavelength range of 1.06–5.3 μm. Twenty standard observing modes with different wavelength coverages are available by selecting one of the six cross-dispersing gratings (J, H, K, L, L’, and M) and adjusting the tilt position. By fully exploiting the capabilities of iSHELL, we can retrieve the abundances of HDO, CO, HF, HCl, OCS, and their isotopologues near the Venusian cloud tops. To date, we have accumulated 23 days of successful observations over four observing periods (2018, 2020, 2023, and 2025). Among them, our first results focusing on the HCl abundance near the cloud tops have already been published (Sato and Sagawa, 2023).
Because the observations were conducted using various observing modes and slit lengths after the publication, we revisited and refined the data calibration methods and radiative transfer model. For example, we developed a method to estimate the slit position on the Venusian disk from guide images of Venus taken with the 3.46-μm filter by fitting the limb of the Venusian dayside disk, independent of the slit length (5”, 15”, or 25”). In addition, we estimated the instrument response function for each observing mode using multiple Ar-Th lamp emission lines fitted with a combination of two Gaussian functions: one symmetric and the other asymmetric. The molecular absorption database used in the radiative transfer model was updated to HITRAN2024. In this presentation, we provide an overview of our observations conducted so far. We will present initial results on the retrieval of CO and its isotopologues near the cloud tops.
How to cite: Sato, T., Sagawa, H., Aoki, S., and Jessup, K. L.: Ground-based observations using IRTF/iSHELL for monitoring trace gases near the cloud tops of Venus, Europlanet Science Congress 2026, The Hague, The Netherlands, 7–11 Sep 2026, EPSC2026-833, https://doi.org/10.5194/epsc2026-833, 2026.
Sulphur dioxide (SO2) is arguably the most variable trace gas at Venus’ cloud top, with observable column density variations spanning about 2-3 orders of magnitude over spatial extents ranging from a few hundred of kilometers to planetary scale, and over time scales ranging from about an Earth day to several decades [1, 3-7, 4, 5]. Orbital investigations from ESA’s Venus Express (2006-2014), and JAXA’s Akatsuki (2015-2025) have provided long term measurements series of cloud top SO2, but suffer from instrumental limitations in terms of size, weight, power, and spectral resolution when compared to ground instrumentation.
As a complement of the orbital monitoring with inevitable gaps in time between active space missions, as well as considering the known variability of SO2, Encrenaz et al. [3-7] have been running a monitoring campaign using the high-resolution (R ~ 105) mid IR spectrometer TEXES [2], a guest instrument hosted at the IRTF telescope in Hawaii. During most Venusian quadrature events from 2012 up to the present day, they have recorded hyperspectral cubes of Venus near 7.4 µm, 8.6 µm and 19 µm, probing altitudes ranging from 57 to 67 km, within the upper clouds of Venus. Using simple weak line ratios of SO2/CO2 on one hand, and HDO/CO2 on the other hand, they confirmed the striking variability of SO2 over short timescales (a few terrestrial hours) and spatial extents of about 1000 km (so called “SO2 plumes”), in comparison with the spatially uniform HDO maps used here as a proxy for H2O. Long-term variations of HDO were nevertheless evidenced, exhibiting complex correlations with SO2 [5].
We have now undertaken the reprocessing of the whole TEXES data set, along two main directions of improvement. First, we shall map the spectral cubes onto a suitable and consistent coordinate system (latitude, longitude, local solar time) to assess SO2 variability more accurately than using only the existing full disk images. Then, we shall develop a radiative transfer model that should allow for more accurate retrievals of minor species, possibly allowing for limited temperature and SO2 vertical profiling within the upper cloud. We shall present here our preliminary results, and plan to use this pipeline for future TEXES observations that the team will lead.
Figure 1: Synthetic spectrum with 5 ppm of H2O at 65 km and variable amounts of SO2. Besides SO2 spectral lines, a CO2 line can be seen near 1345.25 cm-1, as well as a HDO line near 1344.9 cm-1
Bibliography
-
[1] Esposito et al., Science (1984)
-
[2] Lacy et al., PASP(2002)
-
[3] Encrenaz et al., A & A (2012)
-
[4] Marcq et al., Nature Geosci. (2013)
-
[5] Marcq et al., Icarus (2020)
-
[6] Encrenaz et al., A & A (2023)
-
[7] Encrenaz et al., A & A (2025)
How to cite: Marcq, E., Verbaenen, E., Greathouse, T., Roos-Serote, M., Aoki, S., Bézard, B., and Encrenaz, T.: Monitoring of sulphur dioxide observed in the upper clouds of Venus by TEXES/IRTF in the thermal IR, Europlanet Science Congress 2026, The Hague, The Netherlands, 7–11 Sep 2026, EPSC2026-560, https://doi.org/10.5194/epsc2026-560, 2026.
We will present summarised findings from our JCMT-Venus project, a long-term disc-integrated monitoring programme using the 15-metre James Clerk Maxwell Telescope (JCMT), a single-dish telescope operating at millimetre and submillimetre wavelengths, to probe the upper mesosphere of Venus at altitudes of approximately 90–110 km. The region probed marks the dynamical transition between superrotation and subsolar-to-antisolar flow, and is also a photochemically active layer central to Venus’ chemical cycles. The variability of key chemical species in this region has been relatively poorly characterised. Existing observations used to probe this region have important limitations: occultation measurements are often restricted to specific Local Solar Time (LST) or latitude ranges, while millimetre and submillimetre observations generally have sparse temporal sampling [1,2].
With the main aim of following up our detection of phosphine (PH3), whose presence implies chemical disequilibrium and is therefore of potential biological interest [3], the project has since expanded into a broader investigation of Venus’ upper mesosphere. The wide spectral bandwidth of the observations provides simultaneous coverage of several important species, including H2O (via HDO), SO2, SO, H2SO4, OCS, and HCO+. To date, four multi-week observing campaigns have been completed, with a fifth approved for July 2026. These campaigns sample complementary LST ranges, covering dayside and nightside and different stages of the solar cycle for comparison. Together, they provide invaluable insights into the simultaneous variability of species that are important for understanding the chemistry and the dynamics of this region. The talk will include three main parts, 1) a study of the daily variability of H2O and SO2, 2) daily constraints on SO, H2SO4, and OCS, and 3) the re-detection of PH3.
The first part of the talk will discuss the variability of H2O and SO2, which are key species in Venus’ photochemical cycles leading to the formation of the global sulphuric acid cloud and haze layers. Their variability in the upper mesosphere is poorly understood, mostly because at least two of the short-term, LST-dependent, spatial, and potential long-term effects were entangled in individual studies. Combining independent observations is also challenging, since even observations made over similar periods can produce very different results, possibly because of differences in instrumentation and data reduction [1,4]. We apply a consistent reduction method to all campaigns, with particular attention to standing-wave removal, a common issue in Venus mm/submm spectroscopy. We have four main findings. First, SO2 exhibits long-term variability (Fig. 1) and appears to follow the long-term cycle observed near the cloud-top altitude [5], further constraining any upper-mesospheric SO2 reservoir to be linked to the supply of SO2-related species from below. Second, H2O also exhibits long-term variability in the form of an anti-correlated response to the long-term change in SO2, likely because higher SO2 abundance consumes more H2O through H2SO4 formation (Fig. 1). Third, in the absence of long-term effects, SO2 shows a clear LST-dependent trend that can be reproduced using an independent model (Fig. 2) [6]. Finally, H2O variability is broadly consistent with the noise level over each campaign, although individual excursions are present in the form of sudden depletion events.
The second part will report results for other major sulphur-bearing species, including SO, OCS, and H2SO4. These species are investigated in temporal parallel with the daily variations of H2O and SO2, providing benchmark data for photochemical models and constraining existing models of the SO2 inversion profile [7,8]. The third part will discuss the new PH3 detection and its robustness.

Figure 1: Disc-integrated SO2 and H2O abundances as a function of sampled LST for the first three campaigns in February 2022, July 2023, and August-September 2023. SO2 is broadly absent in Campaign 1 but detected in Campaigns 2 and 3, indicating long-term variability. H2O is largely stable between Campaigns 2 and 3, but is higher in Campaign 1, likewise indicating a long-term effect.

Figure 2: Daily SO2 abundances as a function of LST in Campaigns 2 and 3, compared with independent LST model predictions for different Kzz values and dynamical-component weightings [6]. The best agreement is obtained for a mixed dynamical case with 75% superrotation and a 25% subsolar-to-antisolar contribution, suggesting that, in the absence of long-term effects, SO2 variability in Venus’ upper mesosphere is primarily LST-dependent.
References:
[1] Sandor B. J. & Clancy R. T., 2005, Icarus, 177, 129.
[2] Chamberlain S. et al., 2020, Icarus, 346, 113819.
[3] Greaves J. S. et al., 2021, Nature Astronomy, 5, 655.
[4] Gurwell M. A., Melnick G. J., Tolls V., Bergin E. A. & Patten B. M., 2007, Icarus, 188, 288.
[5] Encrenaz T. et al., 2025, A&A, 703, A219.
[6] Shao W. D., Zhang X., Mendonça J. & Encrenaz T., 2022, The Planetary Science Journal, 3, 3.
[7] Zhang X. et al., 2010, Nature Geoscience, 3, 834.
[8] Zhang X. et al., 2012, Icarus, 217, 714.
How to cite: Tang, W., Clements, D., Greaves, J., Richards, A. M. S., and Peel, M.: JCMT-Venus: Long-term Monitoring of Chemical Variability in Venus' Upper Mesosphere, Europlanet Science Congress 2026, The Hague, The Netherlands, 7–11 Sep 2026, EPSC2026-1119, https://doi.org/10.5194/epsc2026-1119, 2026.
We present a long-term analysis of the Venusian atmospheric thermal structure between 45-80 km combining data from Venus Express and Akatsuki Radio Science payloads for periods spanning 2006-2024. The thermal structure is crucial for our comprehensive understanding of the atmosphere, providing better constraints for the cloud structure, radiative transfer algorithms and the general circulation models. The temperature profiles derived from the Radio Occultation (RO) measurements are compared with climatological mean outputs from the Venus International Reference Atmosphere (VIRA) and the Venus Climate Database (VCD). Large deviations exceeding 10K between RO observations and model outputs are seen at the high latitudes in both the hemispheres. A long term trend analysis of the annually averaged temperature profiles reveals a quasi-sinusoidal variability over the years across the low to mid latitude regions. To test the possible role of cloud albedo in modulating the thermal structure, VCD albedo settings are varied mimicking the observations obtained by Venus Express and Akatsuki. We find that VCD is able to partially explain the variability, especially in the lower altitudes, although large deviations with RO still occur above cloud tops. Our study highlights the need to update the existing climatological models with the latest available datasets, as well as to improve our understanding of the underlying physical processes governing the chemical and dynamical processes in the atmosphere.
How to cite: Banerjee, S., Choudhary, R. K., Tripathi, K. R., Kailasam Madathil, A., Oschlisniok, J., Tellmann, S., Imamura, T., and Ando, H.: A comparative study on the Venusian Atmospheric Thermal Structure using observations and models, Europlanet Science Congress 2026, The Hague, The Netherlands, 7–11 Sep 2026, EPSC2026-323, https://doi.org/10.5194/epsc2026-323, 2026.
Please decide on your access
Please use the buttons below to download the supplementary material or to visit the external website where the presentation is linked. Regarding the external link, please note that Copernicus Meetings cannot accept any liability for the content and the website you will visit.
Forward to presentation link
You are going to open an external link to the presentation as indicated by the authors. Copernicus Meetings cannot accept any liability for the content and the website you will visit.
We are sorry, but presentations are only available for conference attendees. Please register for the conference first. Thank you.
In the Venusian atmosphere, a cloud layer composed mainly of sulfuric acid exists at altitudes of 50–70 km. Near the cloud base, infrared radiation emitted from the lower atmosphere is absorbed, driving convection in the lower and middle clouds (approximately 50–55 km) and forming the troposphere. In addition, a large-scale meridional circulation is thought to exist, in which air rises at low latitudes, flows poleward above the cloud top, and descends at high latitudes to return to the troposphere, producing adiabatic heating above the polar troposphere. Poleward heat transport by baroclinic disturbances, suggested by Venus GCM studies, might also affect the tropopause structure. As a result, the high-latitude tropopause will be formed by the combined effect of multiple dynamical processes, including convection, large-scale circulation, and wave activity. Therefore, investigating temporal variations in tropopause structure can provide insight into how the vertical structure of the Venusian atmosphere is maintained.
Based on temperature data from radio occultation observations by the Venus Express spacecraft, Ando et al. (2017) identified temperature variations on timescales of several days in the polar region and attributed them to planetary-scale waves. By analyzing a larger data set, we further showed that the tropopause height also varies on similar timescales and that there is a strong positive correlation between the temperature below the tropopause and the tropopause height. These features suggest meridional advection of the background atmospheric structure associated with planetary-scale waves, but direct verification has been difficult because meridional wind cannot be obtained from radio occultation observations.
In this study, we investigate this mechanism using numerical simulations with the global non-hydrostatic Venus atmospheric model, Venus SCALE-GM, to complement the analysis of observational data and investigate the dynamical mechanism of the observed variations. The model reproduces a positive correlation between temperature anomalies and tropopause height, and also shows a positive correlation between convective intensity and tropopause height. To clarify the role of waves, we investigated the meridional wind and temperature fields around 55 km altitude, which exhibit a prominent wavenumber-1 structure at high latitudes. Wavenumber–frequency analysis indicates a period of about 6 Earth days and a zonal propagation slower than the background flow, consistent with a Rossby wave. The meridional displacement associated with the wave is estimated to be approximately 5° in latitude, and we are investigating whether this displacement can explain the tropopause height variations.
How to cite: Sugiura, M., Kashimura, H., Imamura, T., Ando, H., Häusler, B., Paetzold, M., and Tellmann, S.: Variability of Venusian Polar Tropopause Studied by Radio Occultation and a Venusian GCM, Europlanet Science Congress 2026, The Hague, The Netherlands, 7–11 Sep 2026, EPSC2026-295, https://doi.org/10.5194/epsc2026-295, 2026.
Venusian sulfuric acid clouds play a central role in the planet’s sulfur cycle, radiative balance, and atmospheric chemistry. One long-standing problem in Venus chemistry is the significant depletion of sulfur dioxide (SO2) across the cloud layers. Observations show that the concentration of SO2 decreases by three orders of magnitude from the bottom to the top of the cloud layers. Gas-phase chemistry alone cannot fully account for this depletion, suggesting that heterogeneous uptake and oxidation of SO2 in cloud droplets may serve as an additional sink. In terrestrial atmospheric chemistry, dissolved SO2 can be oxidized by oxygen (O2) through Fe(III)-catalyzed reactions. The reaction could be a candidate pathway for reactive uptake of SO2 into Venusian sulfuric acid droplets.
This chemistry may also be relevant to another unresolved issue in Venus’ atmosphere: the photochemical stability of the CO2-dominated atmosphere. Photolysis of CO2 produces CO and O2, yet O2 remains extremely scarce in the gas phase. Photochemistry in sulfuric acid droplets containing SO2 and iron has been proposed as a possible O2 sink, in which sulfite-derived radicals rapidly react with O2 and form peroxymonosulfate (HSO5–) 1. Because HSO5– can potentially oxidize CO to CO2, this chemistry may also contribute to CO2 regeneration in the cloud layer. Thus, ferric chloride photochemistry in sulfuric acid droplets could potentially link SO2 depletion, O2 removal, and . In addition, ferric chloride has recently been discussed as a possible contributor to the unknown UV absorption in Venus’ clouds, motivating further investigation of iron chloride chemistry in sulfuric acid droplets.
Here, we present preliminary laboratory experiments designed to test whether iron-containing sulfuric acid droplets can promote SO2 oxidation by O2 under Venus-relevant acidic conditions. Single droplets were levitated using an electrodynamic balance and analyzed by Mie resonance and Raman scattering. Ferric chloride was introduced as an iron source, and both acid composition and iron abundance were selected within ranges relevant to Venus cloud conditions. The droplets were exposed to gas mixtures containing SO2 and O2 , which was used to test whether photochemical Fe redox cycling and radical formation can promote SO2 oxidation by O2. To interpret the reactivity, we also calculated Fe speciation in sulfuric acid solutions, indicating that dissolved rather than as hydroxo or sulfito complexes, commonly invoked in dilute aqueous Fe-catalyzed SO2 oxidation. This contrasts with our previous NO2 oxidation experiments using the same setup, where clear droplet growth was observed when both SO2 and NO2 were supplied at 100 ppm2. This comparison suggests the low efficiency of Fe-mediated SO2 oxidation by O2 under low-O2 and highly acidic conditions. Possible limiting factors include the low O2 abundance, suppressed formation of reactive S(IV) species in strongly acidic droplets, and sulfate-dominated Fe speciation.
These preliminary results provide an experimental constraint on ferric chloride photochemistry and Fe-mediated O2 oxidation in Venus-analog sulfuric acid droplets. Future work will quantify the detection limit, and vary O2 abundance, UV flux, Fe concentration, and sulfuric acid concentration. These experiments will help assess whether iron-containing sulfuric acid cloud droplets can act as sites for SO2 depletion and O2 sink chemistry in Venus’ atmosphere.
(1) Rowland, G.; Eldik, R.; Phillips, L. F. Photochemistry of Concentrated Sulfuric Acid in the Presence of SO2 and Fe(II), and Implications for the Cloud Chemistry of Venus. Journal of Photochemistry and Photobiology A-chemistry 2002, 153, 1–10.
(2) Ubukata, S.; Karyu, H.; Nakagawa, H.; Koyama, S.; Minamikawa, R.; Kuroda, T.; Terada, N.; Gen, M. Uptake of SO2 into Sulfuric Acid Droplets through the Oxidation by NO2 under Venus-Analogous Conditions. ACS Earth Space Chem. 2025, 9 (6), 1525–1533.
How to cite: Ubukata, S., Gen, M., Karyu, H., Nakagawa, H., Murata, I., and Terada, N.: Ferric chloride photochemistry in sulfuric acid droplets: Constraints on SO2 oxidation by O2, Europlanet Science Congress 2026, The Hague, The Netherlands, 7–11 Sep 2026, EPSC2026-375, https://doi.org/10.5194/epsc2026-375, 2026.
Venus is covered by dense sulfuric acid clouds at around 47-70 km altitudes, which have great impact on the global temperature and climate change by controlling its energy balance. The cloud mass and opacity are observed to increase with decreasing altitude, and the shape of the vertical profiles is characterized by a three-step staircase pattern. In particular, the lower clouds possess an exceptionally high mass density. Model analysis indicates that the formation of the middle and lower clouds is primarily governed by atmospheric dynamics, including eddy diffusion and vertical wind transport. Nevertheless, substantial uncertainties remain in our understanding of these processes. A key limitation arises from the scarcity of observations within the cloud deck, which has led to a wide range of empirically adopted cloud eddy-diffusion coefficients in existing models. Furthermore, most previous studies investigating vertical wind transport acquire the wind velocity profiles under the assumption of conserved vertical mass flux in the background atmosphere, which do not include the effects of divergent and convergent of large-scale atmospheric circulation on the vertical distribution of trace gases. In this work, we develop a one-dimensional triple-modal cloud model with vertical wind velocity profiles from recent general circulation model simulations. The derived cloud mass loading shows good agreements with observations. Through sensitivity experiments, we investigate the impact of cloud diffusivity and vertical winds on Venusian cloud structures. The results also demonstrate that these dynamical effects vary substantially across different latitudes.
How to cite: Dai, L., Fan, S., Zhang, X., Lai, D., and Cui, J.: Dynamics-regulated cloud distribution on Venus, Europlanet Science Congress 2026, The Hague, The Netherlands, 7–11 Sep 2026, EPSC2026-745, https://doi.org/10.5194/epsc2026-745, 2026.
Plain Language Summary
Studying the surface of Venus is a challenge due to its high temperatures of approximately 460 °C, an atmospheric pressure of 93 bar, and its thick atmosphere composed mainly of carbon dioxide, nitrogen, and small amounts of corrosive compounds such as sulfur dioxide. These conditions make orbital remote sensing imaging techniques difficult. However, a few narrow spectral windows in the near-infrared, around 1 μm, allow the detection of signals coming from the surface. Future missions, including VERITAS, EnVision, and DAVINCI, will rely on these signals to study Venus’ surface emissivity and retrieve surface composition. To interpret these data, laboratory investigations that simulate the conditions of Venus’ surface are needed. This study examines two sets of mineral and rock samples: a first set weathered at the NASA Goddard Space Flight Center (GSFC) Hot Environments Laboratory (HEL), and a second set weathered at the NASA Glenn Extreme Environments Rig (GEER). All samples, fresh and altered, were then analyzed at the Planetary Spectroscopy Laboratory (PSL) at DLR for near-infrared reflectance and high-temperature emissivity. The microscopical and chemical characterization of the samples was performed at the Museum für Naturkunde (MfN, Berlin) and the University of Münster.
Introduction
The rocks on the surface of Venus are subject to a temperature and pressure of approximately 460 °C and 93 bar, respectively [1]. They are also exposed to a thick atmosphere composed mainly of CO2 and N2, with trace C-O-H-S species including SO2, among other corrosive compounds [2]. Studying the surface composition of Venus is challenging due to the high spectral opacity of its atmosphere at almost all wavelengths [3]. However, in the near-infrared (NIR) range, around 1 μm, the atmosphere presents a few spectrally transparent windows allowing us to gain insights into the planet’s surface composition, geological history, and evolution [4,5]. Instruments like the Venus Emissivity Mapper (VEM) on VERITAS, VenSpec-M on EnVision, and the VISOR camera onboard DAVINCI will acquire data of Venus around the 1 μm region. The interpretation of these data requires emissivity measurements of Venus analogs acquired under Venus-like conditions [6,7].
Weathering is the main exchange mechanism between the solid surface of Venus and its atmosphere [8]. However, how, and to which extent, weathering might affect the spectroscopic signatures of surface rocks and minerals is still not well understood [9,10,11], limiting the knowledge and interpretation of the data. Laboratory measurements of samples under Venus’ surface conditions, including its temperature, pressure, and atmospheric composition, are therefore necessary for the accurate interpretation of the data obtained by remote sensing. The Planetary Spectroscopy Laboratory (PSL) at DLR is periodically collecting NIR spectra of experimentally weathered samples [12,13] to prepare for the interpretation of the remote sensing data from the VenSpec-M and VEM instruments.
Samples and Measurements
We present the spectral analysis of two main groups of altered samples. The first group includes a slab and grains (250–500 μm) of a biotite sample, which were exposed to simulated Venusian atmospheric conditions at the NASA Goddard Space Flight Center (GSFC) in the Small Venus Chamber (Lil’VICI) at the Hot Environments Laboratory (HEL). The second group consists of five samples, three basalts, a granodiorite, and the mineral aragonite from the collection presented in [14], comprising the fresh samples and their respective duplicate slabs weathered at the NASA Glenn Extreme Environments Rig (GEER) under Venus’ surface conditions for ten days. Both sample groups underwent the same suite of laboratory analyses at PSL. These include measurements of the spectra using Fourier Transform Infrared Spectroscopy (FTIR) for hemispherical reflectance at ambient temperature across the near-infrared spectral range and emissivity measurements at high temperatures simulating Venus’ surface temperatures (440–480°C). Chemical analyses were performed using a scanning electron microscope (SEM) and micro X-ray fluorescence (μXRF) spectrometer at the Museum für Naturkunde (MfN, Berlin). Additional SEM measurements were performed at the Institut für Mineralogie of the University of Münster. This work is part of a broader effort to compare results from samples that have been experimentally weathered in different facilities and assess how varying experimental conditions may influence emissivity and alteration processes.
References
[1] Fegley, B. (2005). Meteorites, comets, and planets, 487–507.
[2] Krasnopolsky, V. A., & Lefèvre, F. (2014). Comparative Climatology of Terrestrial Planets, 231–276.
[3] Tsang, C. C. C., et al. (2010). Geophysical Research Letters, 37(2).
[4] Allen, D. A., & Crawford, J. W. (1984). Nature, 307(5948), 222–224.
[5] Pollack, J. B., et al. (1993). Icarus, 103(1), 1–42.
[6] Plesa, A.-C., et al. (2024). EGU Abstract.
[7] Garvin, J., et al. (2024). LPSC, LV, Abstract #2429.
[8] Lebonnois, S., & Schubert, G. (2017). Nature Geoscience, 10(7), 473–477.
[9] Dyar, M. D., et al. (2021). Icarus, 358, 114139.
[10] Helbert, J., et al. (2021). Science Advances, 7(3).
[11] Treiman, A. H., et al. (2021). The Planetary Science Journal, 2.
[12] Alemanno, G., et al. (2024). LPSC, LV, Abstract #1552.
[13] Alemanno, G., et al. (2025). EGU Abstract.
[14] Longo, A. Z. (2024). MSc thesis, University of North Carolina.
How to cite: Monarrez Aguilar, A., Alemanno, G., Van den Neucker, A., Kohler, E., Plesa, A.-C., Maturilli, A., Longo, A. Z., Liu, X., Carli, C., Jennings, L. A., Klemme, S., Dyar, M. D., Hamann, C., Kaufmann, F., Smrekar, S., Barraud, O., Widemann, T., Robert, S., and Marcq, E.: Laboratory Investigation of Venus Surface Conditions on Analogue Samples for the Interpretation of Venus Orbital Data, Europlanet Science Congress 2026, The Hague, The Netherlands, 7–11 Sep 2026, EPSC2026-703, https://doi.org/10.5194/epsc2026-703, 2026.
Synthetic Aperture Radar (SAR) observations provide valuable information for volcanic surface characterisation due to their sensitivity to surface roughness and dielectric properties. Accurate characterisation of volcanic terrains is important for understanding SAR scattering behaviour and surface physical properties, including roughness and dielectric variability, in both terrestrial and planetary environments. Radar remote sensing is particularly valuable for volcanic investigations in regions where optical observations are limited by cloud cover, ash, or dense atmospheres, such as on Venus. Conventional model-based dual-polarimetric SAR decomposition methods, including the framework proposed by Lorenzo Mascolo et al. [1], often overestimate volume scattering in volcanic terrains because depolarised returns arising from rough-surface interactions and multiple scattering are incorrectly interpreted as random volume scattering. Since volcanic surfaces are predominantly non-vegetated and characterised by blocky lava flows, rough interfaces, and coherent depolarisation mechanisms, a significant portion of the surface scattering contribution is absorbed into the estimated volume scattering component. This leads to systematic underestimation of surface scattering power and reduced physical interpretability of decomposition results. To address these limitations, this study proposes a physically constrained model-based dual-polarimetric SAR decomposition framework for volcanic surface characterisation using ALOS PALSAR-2 datasets acquired over terrestrial volcanic analogue sites in Iceland. The proposed approach constrains the unpolarised scattering component using polarisation-state information derived from Stokes parameters. A hybrid formulation combining the degree of polarisation and a phase-sensitive randomness index is introduced to distinguish stochastic volume scattering from coherent rough-surface depolarisation. In addition, an intensity-based constraint is incorporated to suppress residual overestimation in high-backscatter regions while preserving total power conservation. The methodology is particularly relevant for forthcoming dual-polarimetric SAR observations from the ESA EnVision mission, which will enable investigation of volcanic surface scattering behaviour and dielectric variability on planetary surfaces. Experimental results demonstrate improved discrimination of volcanic surface units and more physically consistent decomposition compared with conventional dual-polarimetric approaches.
Keywords: Volcanos; Synthetic Aperture Radar; Dual-polarimetric decomposition; ALOS-PALSAR-2; EnVision
References
[1] L. Mascolo, S. R. Cloude, and J. M. Lopez-Sanchez, “Model-based decomposition of dual-pol SAR data: Application to Sentinel-1,” IEEE Transactions on Geoscience and Remote Sensing, vol. 60, pp. 1–19, 2021.
Acknowledgement: The authors would like to acknowledge the Japan Aerospace Exploration Agency (JAXA) for providing the ALOS PALSAR-2 datasets to carry out this research work.
How to cite: Awasthi, S., Gao, Y., Gallardo i Peres, G., Davidova, N., Ghail, R. C., and J. Mason, P.: Physically Constrained Dual-Polarimetric SAR Decomposition for Volcanic Surface Characterisation: Analogue Studies for the Venus EnVision mission, Europlanet Science Congress 2026, The Hague, The Netherlands, 7–11 Sep 2026, EPSC2026-875, https://doi.org/10.5194/epsc2026-875, 2026.
Introduction: Within the Venusian volcanic plains, long meandering channels have been identified and classified as so-called ‘canali’ (e.g. [1]). Canali are channels of great length that are thought to have been formed by melts and/or fluids on the Venusian surface. Canali may have formed through a combination of mechanical and thermal erosion or collapse of subsurface lava flows [2]. The morphological properties of canali show a great degree of similarity to terrestrial rivers [3], suggesting that the fluid that formed them must have been a low-viscosity fluid, likely similar in viscosity to water. Additionally, the extreme length and constant width of the longest canali imply that the responsible fluid was stable over a vast distance and thus a large amount of time. Water cannot have been responsible for the formation of canali, as liquid water is unstable due to the high surface temperatures. Instead, a magma or fluid-rich melt is more likely to have carved the canali. However, ordinary basaltic magmas are too viscous to form the observed channel geometries [4], and would also cool too quickly and could, therefore, not produce the observed length of the channels. Several other candidates have been proposed based on stable mineral phases on the Venusian surface. This study aims to constrain the melting behaviour of carbonate melts relevant to the Venusian crust while assessing their potential as a source for the formation of canali on Venus.
Methods: We performed high-pressure and -temperature experiments in a Bristol-type end-loaded piston cylinder press. Experiments were conducted at the Institute for Mineralogy, Münster University, and the Department of Earth Sciences, VU, Amsterdam. Three compositions were studied. All compositions consisted of 75 wt% Ocean Island Basalt (OIB), a basaltic equivalent to the Venusian upper crust, while the remaining 25% consisted of either Na2CO3, CaCO3, or a mixture of 50 wt% Na2CO3 and 50% CaCO3. The OIB was created by mechanically mixing reagent grade powders of SiO2, Al2O3, Na2CO3, MgO, CaCO3, TiO2, Fe2O3, K2CO3 and MnO under ethanol, after which the material was decarbonated and molten into a glass. The glass was ground into a fine powder, after which the corresponding carbonate was added to obtain the final three compositions. Starting compositions were directly loaded in 2.0 mm outer diameter, 1.7 mm inner diameter Pt capsules. Three loaded capsules, each containing one of the three starting compositions, were placed in boron-nitride (BN) three-holed spacers. The capsule-containing BN spacers were loaded into regular ½ inch talc-pyrex assemblies. A ruby disc was placed on top of the BN spacer, followed by an MgO sleeve containing a 1.6 mm outer diameter and a 4-bore alumina thermocouple sleeve containing thermocouple wires. At the top of the assembly, a hardened steel plug and pyrophyllite ring were placed. Temperatures were measured using W95Re5 – W74Re26 (type C) thermocouple wires placed at the assembly hotspot. A total of 15 experiments were performed, all lasting 2 hours, while temperature and pressure were varied (T = 1050, 1100, 1200, 1300, 1400 °C; P = 0.5, 0.85, 1.7 GPa). Capsules were subsequently polished to expose the interior. Phases were identified and major element concentrations were measured using EPMA at Münster University and the Netherlands Geological Facility at Utrecht University.
Results: Various phases were identified. The OIB+Ca experiments did not produce carbonate melt under any of the experimental conditions, CaCO3 broke down to CaO and CO2 before the liquidus of the system was reached (Fig 1). Both the OIB+Na and the OIB+mix experiments produced carbonate melt at 1100 °C at various pressures (Fig 2). Details will be presented at the conference. Our results are used to create OIB + carbonate stability fields (Fig. 3).
|
|
|
Figure 1. CaCO3 has decomposed fully, resulting in an ultra-calcic silicate melt coexisting with a supercritical CO2 phase at 0.85 GPa, 1300 °C. |
Discussion: Pure CaCO3 does not produce carbonate melts under the explored experimental conditions. In contrast, pure Na2CO3 or a mixture of the two will produce carbonate melt at some of the experimental conditions. Depending on the oxygen fugacity and composition of carbonates in the Venusian crust, this may have various implications. Carbonates in the Venusian crust may have various origins. Carbonates have been suggested to result from evaporated oceans [5], liquid immiscibility of carbonated silicate melt [2], or buried reaction products as a result of chemical weathering [6]. Basic studies have been performed on the chemical composition of chemically weathered Venusian minerals and/or rocks (e.g. [7]), but more a qualitative approach is needed to fully understand weathering rates and processes. Depending on the geotherm, these potential carbonates might remain solid, melt to from carbonate melts or dissociate to produce CO2. If carbonate melt is stable, a mechanism to concentrate and erupt the melt would be required to act as a canali-forming source. Experimentally studying the rheological properties of carbonates will lead to a better understanding of the potential carbonatites hold as a canali-forming source. Additionally, this study has implications for the solubility of CO2 in silicate melt. Experiments show that the solubility increases with increasing pressure. Given the abundance of CO2 in the Venusian atmosphere, carbonatites and/or carbonated magmas have played a major role in the outgassing of CO2 and, thus, the evolution of Venus.
|
|
|
Figure 2. Stable carbonate melt coexisting with silicate melt at 1.7 GPa, 1100 °C. |
|
|
|
Figure 3. Schematic estimated stability field of 75% OIB + 25% CaCO3. |
Acknowledgements: This study was supported by the ERC StG VenusVolAtmos and NWO M-Invest Canali awarded to ESS.
References: [1] Komatsu et al. (1992), GRL. [2] Trussell et al. (2025), Science Advances. [3] Bray et al. (2007), JoGR.[4] Treiman (2009), 40th LPSC 2009. [5] Zolotov (2018), RiMaG. [6] Kargel et al. (1994), Icarus. [7] Santos et al. (2023), JGR Planets.
How to cite: Aerts, G., Jorritsma, J., Berndt, J., Klemme, S., van Westrenen, W., and Steenstra, E.: An experimental perspective on the feasability of the formation of Venusian canali via carbonatitic melts, Europlanet Science Congress 2026, The Hague, The Netherlands, 7–11 Sep 2026, EPSC2026-912, https://doi.org/10.5194/epsc2026-912, 2026.
We present a collection of radio-frequency observations of Venus, investigating its solid surface temperature profile and dielectric properties.
Observations at wavelengths >∼4 cm1 can image the surface of Venus below its hot, dense clouds. Emission is received from depths up to ∼10x the wavelength, polarised by the minerological properties of the lithosphere.
Imaging reveals spectral index and polarisation variations associated with Venusian surface features. We are also collating observations from our projects and the literature to provide a large dataset covering total flux density measurements across a wide range of ground-penetrating wavelengths at different epochs, investigating dependence on the presenting hemisphere of Venus. New observations surprising behaviour at wavelengths of tens cm. The Figure shows new ASKAP data (2015) compared with the GMRT measurements by Mohan et al. in 2004. These contribute to constraining the gradient of properties with subsurface depth and thus the composition.
Some of these observations were taken associated with ORP2 proposal M001. This covered wavelengths from 2 m to the UV, with one aim to look for correlations between cm-mm wave observations of atmospheric reduced gasses, and surface features. This complements an ongoing JCMT monitoring project, see W. Tang presentation.
1 Including dedicated and serendipitous observations using ASKAP, Effelsberg, TNRT, MeerKAT and e-MERLIN plus archive and published data from the VLA and GMRT (e.g. Hugo B. and Perley R. 2024 https://archive-gw-1.kat.ac.za/public/repository/10.48479/bqk7-aw53/index.html; Akins et al. 2025LPICo3090.2366A; Butler et al. 2001Icar..154..226B; Mohan et al. 2019MNRAS.487.4819M )
^2 Opticon RadioNet Pilot
How to cite: Richards, A. M. S., Greaves, J. S., Akins, A., Clements, D. L., Kraus, A., Legodi, P., Pimpanuwat, B., and Tang, W.: New Radio Insights into Venus, Europlanet Science Congress 2026, The Hague, The Netherlands, 7–11 Sep 2026, EPSC2026-1077, https://doi.org/10.5194/epsc2026-1077, 2026.
Polygons of various sizes cover more than 5% of the surface of Venus, almost as much of the surface as that covered by tesserae, and yet they have been largely ignored. The most recent study [1] identified 204 polygonal terrain locations covering approximately 8 Mm², using an automated algorithm that resulted in a northern hemisphere bias. Nonetheless, they found that 65% of the identified polygonal terrain is associated with small volcanoes, 25% with coronae, 18% with tesserae, and 20% with wrinkle ridges. Polygonal terrain is currently attributed to thermal contraction by cooling, whether of lava flows, or following heating by an intrusion [2], or in response to climate change [3].
Our mapping of an additional 16 Mm² (Figure 1) reveals 6 types of polygonal terrain (plus unclassified), broadly divided into irregular (55% by area) and rectilinear patterns (37% by area). There appear to be two distinct size ranges of smaller cells close to the resolution limit (~100 m) and larger cells several km across, sometimes superposed. A thermal contraction origin by cooling is difficult to reconcile with the variety, shapes and sizes of polygons observed.
A range of processes in addition to thermal contraction can generate polygonal patterns at varying scales on Earth and Mars including lava lakes, columnar joints, karst, diagenesis, ice wedge polygons (periglaciation), desiccation (mud cracks), evaporation (salt pans), and polygonal fault systems (PFS). The first four generate polygons on the metre scale, smaller than can be resolved in Magellan imagery. The next three can generate polygons from metres up to a few hundred metres across and may therefore have generated the smaller polygons observed on Venus. PFS have so far only been identified in some terrestrial sedimentary basins [4], but they do generate polygons up to several kilometres across, similar to the larger polygons observed on Venus.
PFS form networks of small‐displacement normal faults forming laterally extensive layer‑bound polygonal patterns. They occur in fine-grained, smectite-rich sediments, usually within epicontinental marine basins [5]. Their initiation appears to depend on syneresis of smectite-rich clay gels during early diagenesis [6], while hydraulic fracturing by over-pressured pore fluids [5], aided by the low shearing resistance of clays [7], enables them to propagate and grow into larger polygonal shear faults several kilometres across. Initiation and propagation are confined within sediments buried at <1500 m depth. At greater depths, propagating fractures sense the regional stress field and generate more orthogonal patterns – a possible explanation for the rectilinear polygons observed on Venus.
In rapidly deposited, underconsolidated submarine muds, PFS can propagate to the sea floor [8]. The Grenada Basin in the Caribbean Sea has a large area of sea floor polygons, forming regular patterns in the north but downslope creep of the smectite-rich clays causes more elongate patterns in the south [9], offering an alternative mechanism for the formation of rectilinear polygons on Venus.
Since the presence of large polygonally-fractured terrain seems to require a marine sedimentary origin, we conclude that Venus must once have had oceans. Even so, extensive periglacial conditions appear unlikely and given the current surface conditions, those oceans must have evaporated under runaway greenhouse conditions. The smaller polygonal fractures (e.g. Type 1 Mesh Polygons) most like represent a combination of desiccated clay-rich marine sediments and evaporites. While terrestrial desiccation cracks most commonly occur as small-scale mud cracks, polygons up to 350 m across have been identified in desiccated lake sediments on Mars [10], while salt polygons up to ~250 m occur on Earth (Figure 2)
While not all polygons will have originated in the same way, a likely formation scenario for many is that they initiated as polygonal fault systems within a rapidly accumulating sediment pile in shallow seas. These PFS propagated to the sea floor as those seas evaporated under a runaway greenhouse. Salts would have precipitated from the increasingly briny seawater. Once the seas were gone, the wet saline sediments desiccated, forming smaller polygons within the larger PFS structures. Rising temperatures first lithified and then metamorphosed the clay-rich sediments into micaceous shales, baking in the polygonal patterns we observe today.
References
1. S. E. Smrekar, P. Moreels, and B. J. Franklin, J. Geophys. Res. Planets 107, 8 (2002)
2. C. L. Johnson and D. T. Sandwell, J. Geophys. Res. 97, 13601 (1992)
3. F. S. Anderson and S. E. Smrekar, J. Geophys. Res. 104, 30743 (1999)
4. J. A. Cartwright, Mar. Pet. Geol. 11, 587 (1994)
5. J. A. Cartwright and L. Lonergan, Basin Research 8, 183 (1996)
6. D. N. Dewhurst, J. A. Cartwright, and L. Lonergan, Mar. Pet. Geol. 16, 793 (1999)
7. J. Cartwright, Mar. Pet. Geol. 28, 1593 (2011)
8. A. Gay, M. Lopez, P. Cochonat, and G. Sermondadaz, Basin Research 16, 101 (2004)
9. A. Gay, C. Padron, S. Meyer, D. Beaufort, E. Oliot, S. Lallemand, B. Marcaillou, M. Philippon, J. J. Cornée, F. Audemard, J. F. Lebrun, F. Klingelhoefer, B. Mercier de Lepinay, P. Münch, C. Garrocq, M. Boucard, and L. Schenini, Geochemistry, Geophysics, Geosystems 22, e2021GC009809 (2021)
10. M. R. El Maarry, W. J. Markiewicz, M. T. Mellon, W. Goetz, J. M. Dohm, and A. Pack, J. Geophys. Res. Planets 115, (2010)
Figures
Figure 1. Type examples for six classes of polygon, all shown at the same comparative scale. Indistinct or otherwise unclassifiable polygons are grouped into a seventh class for mapping purposes but there is no type example. The scale bar is 10 km in each case.
Figure 2 Salt polygons in Lake Natron, Africa. Left Sentinel-2 optical image. Right Sentinel-1 SAR image. Polygons are usually obscured by a thin water layer in radar images. Scale bar is 1 km.
How to cite: Crouch, E., Ghail, R., and Mason, P.: Terrestrial Analogues for Polygonal Terrain on Venus, Europlanet Science Congress 2026, The Hague, The Netherlands, 7–11 Sep 2026, EPSC2026-1082, https://doi.org/10.5194/epsc2026-1082, 2026.
Introduction
The three space missions by ESA and NASA (Veritas, DAVINCI and EnVision) underscore the growing scientific interest to understand our closest neighbour, Venus. It has a young (McKinnon et al., 1997) but poorly constrained (~350-1 Ga) and seemingly uniform surface age determined by the random distribution of ~950 impact craters (Herrick & Phillips, 1994) (Fig 1). The apparent random distribution of impact craters on the surface suggests an equilibrium resurfacing model of the crust (Phillips et al., 1992). Previous studies (e.g., Ivanov & Head, 2011) have determined relative ages of geological units based on superposition principles. The spatial distribution of craters and the geological units defined by Ivanov & Head (2011) have not been combined previously.
This study aims at investigating the spatial distribution, timing and statistical significance of impact craters and the stratigraphy mapped by Ivanov & Head (2011). Based on the database by Herrick & Phillips (1994), we added parameters, where each impact crater was characterised based on the time of formation, target unit, and an improved degradation classification.
We are testing different statistical methods, such as Kolmogorov–Smirnov (KS) test, to find correlation between the classification parameters and the geological units.

Fig 1. Geological map of Venus in Robinson projection based on Ivanov & Head (2011) with the spatial distribution of impact craters and their diameters. Colour bar shows the variation in diameter in log scale.
Results
The improved weathering index was obtained by:
Wi = (central structure diameter) / (total diameter) * (degradation state) / (rim completeness)
Where the degradation state assumes values 1 for pristine craters with ejecta, 2 for craters with partially preserved ejecta and 3 for heavily degraded craters without ejecta blanket (Herrick & Phillips, 1994).
The spatial distribution of the weathering index was then plotted on the topography (Fig 2a). The degradation state that was previously mapped by Herrick & Phillips (1994) shows a strong correlation with altitude (Fig 2b).

Fig 2. Spatial distribution of the degree of weathering with topography by us (a) and by Herrick & Phillips (1994) (b). c. crater density on different stratigraphical units
The p-value in the KS clustering analysis shows a range from 0.0168 to 0.6707 between the crater size frequency distribution in the different stratigraphic units.
References
Herrick, R. R., & Phillips, R. J. (1994). Implications of a Global Survey of Venusian Impact Craters. Icarus, 111(2), 387–416. https://doi.org/10.1006/ICAR.1994.1152
Ivanov, M. A., & Head, J. W. (2011). Global geological map of Venus. Planetary and Space Science, 59(13), 1559–1600. https://doi.org/10.1016/J.PSS.2011.07.008
McKinnon, W. B., Zahnle, K. J., Ivanov, B. A., & Melosh, H. J. (1997). Cratering on Venus: Models and Observations. Veii, 969. https://ui.adsabs.harvard.edu/abs/1997veii.conf..969M/abstract
Phillips, R. J., Raubertas, R. F., Arvidson, R. E., Sarkar, I. C., Herrick, R. R., Izenberg, N., & Grimm, R. E. (1992). Impact craters and Venus resurfacing history. Journal of Geophysical Research, 97(E10), 15923–15948. https://doi.org/10.1029/92JE01696;JOURNAL:JOURNAL:21562202E;WGROUP:STRING:PUBLICATION
How to cite: Das, R., Kenkmann, T., Karagoz, O., and Hergarten, S.: The impact cratering inventory on Venus: time resolved size-frequency distributions, Europlanet Science Congress 2026, The Hague, The Netherlands, 7–11 Sep 2026, EPSC2026-1174, https://doi.org/10.5194/epsc2026-1174, 2026.
In preparation for the Envision mission to Venus, multi-frequency airborne Synthetic Aperture Radar (SAR) data collected in August 2023 over Iceland, by the DLR for NASA JPL and the VERITAS mission team (using the F-SAR system) [2-5], has been analysed across a series of basaltic lava flows of differing ages. Fieldwork in July-August 2026 in the Reykjanes Peninsula has provided some vital ground-truth (surface roughness and very high-resolution topography) for our analysis. Our investigations are aimed at better understanding the scales and scattering characteristics of young basaltic volcanic landscapes, and SAR data-processing algorithms applied to volcanic terrain data.
Analysis of the 2023 F-SAR data at Askja enabled characterisation of seven lava flow units from 1961 (Vikrahraun) to >6100 yr BP using the full-polarimetric X-, S-, and L-band SAR with paired pin-profilometer and drone Digital Elevation Model (DEM) data (Figure 1). Across the Askja flow sequence, mean backscatter decreases systematically with flow age, and decomposition techniques partitions the flows sequence by facies. We now extend this framework to the Reykjanes Peninsula. 
Figure 1. Representative surface units. Left: field photos; centre: drone orthomosaics; right: drone-derived DEMs. (A) Inflated pāhoehoe with pressure ridges; (B) a'ā-pāhoehoe contact; (C) tephra plain with aeolian bedforms. Horizontal scale bars and DEM elevation ranges (m a.s.l.) shown per row.
Complementary analysis of field data across the fresher flows at the Reykjanes Peninsula enables bare-versus-mantled backscatter comparison of several flow units because of the occurrence of moss/lichen colonisation in a slightly warmer climate (Figure 2). Five age groups have been sampled: the Sundhnúkur-Svartsengi system, with nine flows emplaced between December 2023 to August 2025 along a c. 10 km fissure north of Grindavík (fieldwork ages 1-2.5 yr [6]); the Fagradalsfjall system comprising the 2021 Geldingadalir flow (5 yr [7]); the Skollahraun and younger Afstapahraun lavas (c. 2000 yr [8]); the Litla Eldborg flow field (>4000 yr [8]); and the Þráinsskjöldur shield (c. 12,500-14,100 yr [8]). The older three groups carry progressively thicker moss and lichen coverage. This combination delivers a bare versus mantled comparison at matched ages within a single field area at near-uniform basaltic composition, and supports lava-flow facies analysis within each flow field. 
Figure 2 Field morphology and flow-age contrasts. (A) Direct contact between younger a'ā and older moss-covered pāhoehoe; foreground field of view c.3 m. (B) Examples of morphological end-members: rubbly a'ā, inflated pāhoehoe, and sheet pāhoehoe; foreground field of view c.2 m.
Our 2026 field investigations yielded a series of important datasets: facies maps of the Sundhnúkur sequence at 1:5000 scale (classifying pāhoehoe, rubbly pāhoehoe, slabby/platy, spiny, and ʻaʻā facies on selected flows); pin-profilometer surface roughness measurements across the Reykjanes flows (distributed by facies, age, and surface-cover) (Figure 3), and drone-derived DEMs spanning the different facies and ages for scaling roughness statistics up to the scale of the spatial resolution of the F-SAR data (2 m). Together, these measurements deliver fine-scale topography (slopes at cm, dm, and m scales) linking millimetre-scale surface roughness to SAR backscatter at S- and X-band, and enable the quantification of fine-scale morphology (channels, breakouts, tumuli, rubble margins) for direct correlation with radar backscatter. Combined with the existing Askja results, these datasets deliver age sequences of basaltic lava flows with bare and mantled patches, co-located ground-truth from mm to m scale, all tied to multi-frequency polarimetric F-SAR data.
Figure 3 Ground-truth surface roughness characterisation. (A) Ropy pāhoehoe close-up with lens cap (c.7 cm diameter) for scale. (B) Penn Industries M5-S pin profilometer (1 mm pin spacing) capturing a transverse profile across pāhoehoe ropes.
The combined F-SAR and field dataset has supported four types of analysis: (i) comparison of Mascolo dual-pol [9] and Freeman-Durden quad-pol [10] decompositions across the facies and age, across Askja and Reykjanes flow sequences; (2) Comparison of bare and mantled flows to test penetration by long wavelengths through dry mantling materials into lava-roughness scattering; (3) integrated analysis of multi-temporal airborne F-SAR scenes and with; and (iv) progressive degradation of F-SAR products from 2 m to 10 m, 30 m to simulate VenSAR imagery and evaluate the effect of spatial resolution on scattering characteristics.
Venus is a barren basaltic landscape where surface modification is driven by chemical weathering and cementation from basalt–atmosphere interactions at 460°C and 92 bar [11], rather than by the rapid aeolian and biological processes that dominate Earth's basaltic surfaces. These reactions progressively modify surface texture and dielectric properties relevant to radar scattering. This terrestrial analogue work cannot directly emulate Venusian weathering, but it can rigorously partition modification mechanisms on Earth and demonstrate systematic backscatter patterns across them.
The analysis yields a multi-frequency polarimetric scattering library resolved by flow age and facies at the VenSAR pixel scale, with bare-versus-mantled comparisons of flows of various ages, and a quad-pol versus dual-pol decomposition comparison tuned to VenSAR’s HH+HV configuration. In addition, a quantitative framework is built which links mm- and cm- scale topography to m- and dm- scale backscatter, slopes, and polarimetric signatures over basaltic volcanic landscapes, supporting sub-pixel detection of surface properties.
References. [1] EnVision Red Book, ESA-SCI-DIR-RP-003. [2] Keller et al., EUSAR 2024. [3] Hensley et al., LPSC 2024 #1137. [4] Mastrogiuseppe et al., LPSC 2024 #1447. [5] Nunes et al., LPSC 2024 #1681. [6] Pinter et al., Nat Hazards 2026. [7] Pedersen et al., GRL 2022. [8] Sæmundsson et al., Jarðfræðikort af Suðvesturlandi 1:100,000 (2nd ed.), Íslenskar orkurannsóknir, 2016. [9] Mascolo et al., IEEE TGRS 2021. [10] Freeman & Durden, IEEE TGRS 1998. [11] Filiberto et al., Sci Adv 2020.
How to cite: Davidova, N., Gallardo i Peres, G., Gao, Y., Awasthi, S., Ghail, R., Moreira, A., Jaeger, M., Benedikter, A., and Mason, P.: Multi-scale surface characterisation of recently erupted lava flows on the Reykjanes Peninsula: a 2026 field campaign in support of EnVision mission science development, Europlanet Science Congress 2026, The Hague, The Netherlands, 7–11 Sep 2026, EPSC2026-858, https://doi.org/10.5194/epsc2026-858, 2026.
Based on Earth’s dynamics, water is often considered as a key-ingredient to allow subduction, Plate Tectonics and the continuous resurfacing of a planet, because it softens rocks rheology and lubricates faults and the subduction interface. However, there is another way to strongly localize deformation: two-phase flow
Subduction and Plate Tectonics require the strong localization of deformation. Based on Earth’s dynamics, water is often considered as a key-ingredient since it softens rocks rheology and lubricates faults and the subduction interface. Bands of small-size grains such as mylonites have also been proposed. But melt is also ubiquitous around Earth’s plate boundaries. So we studied if and how deformation was localizing in a diphasic fluid using laboratory experiments and DEM (Discrete Element Methods) modeling.
As a model system, we used convection-evaporation in Ludox colloidal dispersions. These fluids are constituted of water, ions and nanoparticles of silica. As the solute (water) is removed, a skeleton of nanoparticles aggregates develops (Gerardi et al, 2026). Therefore as water content decreases, the fluid density increases and its rheology changes from newtonian to visco-elasto-plastic to brittle (Di Giuseppe et al, 2012). Under evaporation, such a system develops solutal convection under a denser and more viscous skin, analogous to the denser and more viscous lithosphere on a planet undergoing thermal convection. The experimental lithosphere is heterogeneous at the meso-scale, with the presence of particle aggregates and free water channels. This results in a highly non-linear rheology at the large scale, capable of producing sufficient shear localization to generate self-consistently asymmetric subduction and rifting.
This suggests that a liquid-solid mixture such as melt-rock could allow subduction on a rocky planet.
That could explain why Venus offers evidences of subduction around some large coronae despite the absence of a water ocean on its surface: pervasive melt could do the trick. Indeed, the surface of Venus is littered by volcanoes, suggesting the presence of melt almost everywhere, and lava flows are observed in the trenches of the subduction candidates. Not only water, but melt could also serve as a lubricant of plates interfaces.
How to cite: Davaille, A. and Gerardi, G.: On the importance of melt to localize large-scale deformation on Venus, Europlanet Science Congress 2026, The Hague, The Netherlands, 7–11 Sep 2026, EPSC2026-772, https://doi.org/10.5194/epsc2026-772, 2026.
The Venus orbiter Akatsuki has accumulated observational data over a long period from 2015 to 2024. Horizontal winds derived from cloud tracking using the onboard Ultraviolet Imager (UVI) have revealed that the super-rotation speed exhibits both faster and slower phases (Horinouchi et al., 2024) [1].
Fujisawa et al. (2022) [2] produced an objective analysis dataset of the Venusian atmosphere by assimilating horizontal winds derived from Akatsuki observations using the Venus general circulation model AFES-Venus (Sugimoto et al., 2014) [3] and the data assimilation system ALEDAS-V (Sugimoto et al., 2017) [4]. This dataset successfully corrects the phase bias of thermal tides and the super-rotation speed (zonal-mean zonal wind) in AFES-Venus, bringing them closer to observations of the real Venusian atmosphere. The dataset was constructed by assimilating observations from September to December 2018, including an intensive observation period of Akatsuki.
In this study, we selected five epochs with characteristic super-rotation speeds during the long-term observation period of Akatsuki and constructed objective analysis datasets for each epoch. The figure shows the latitudinal distribution of the zonal-mean zonal wind near the cloud-top altitude (~69 km). Solid lines indicate the objective analysis, while dashed lines represent observations. Compared with the free run forecast without data assimilation (FRF), the super-rotation speeds in all epochs are substantially reduced when observational data are assimilated. Furthermore, the reproduced wind fields show good agreement with observations, including the meridional asymmetry. These results demonstrate that the data assimilation system successfully reproduces the observed wind structures. The resulting objective analysis datasets are expected to be useful for investigating the mechanisms underlying the long-term variability of Venusian super-rotation.
[1] Horinouchi, T., et al. (2024) J. Geophys. Res. Planets 129, e2023JE008221.
[2] Fujisawa, Y., et al. (2022) Sci. Rep. 12, 14577.
[3] Sugimoto, N., et al. (2014) J. Geophys. Res. Planets 119, 1950–1968.
[4] Sugimoto, N., et al. (2017) Sci. Rep. 7(1), 9321.
How to cite: Fujisawa, Y., Sugimoto, N., Komori, N., Murakami, S., Ando, H., Takagi, M., Imamura, T., Horinouchi, T., Hashimoto, G. L., Ishiwatari, M., Enomoto, T., Miyoshi, T., Maejima, Y., Kashimura, H., and Hayashi, Y.-Y.: An Objective Analysis Dataset for Long-Term Variability of Venusian Super-Rotation Using Akatsuki Wind Assimilation, Europlanet Science Congress 2026, The Hague, The Netherlands, 7–11 Sep 2026, EPSC2026-57, https://doi.org/10.5194/epsc2026-57, 2026.
Introduction
Venus has long been interpreted as a stagnant-lid planet, yet its surface preserves a widespread record of tectonic deformation, including more than 500 trench-bearing coronae and evidence for ongoing deformation at several of them [1,3]. This inventory is difficult to reconcile with a fully stagnant lithosphere. Recent numerical models suggest that Venus may be evolving from a stagnant-lid regime toward a plutonic squishy-lid regime [3,4], in which a thermally weakened lid recycles through localized foundering rather than through plate boundaries. How this transition is expressed mechanically at the surface, especially where the lithosphere has been thermally softened, remains unclear.
Here, using scaled three-dimensional analogue experiments performed at the Planetary Analogue Laboratory, University of Freiburg, we test how a thermally weakened lithosphere founders above a thickened thermal boundary layer. The experimental stratigraphy consists of an upper crust of dry quartz sand with an internal friction angle of ϕ = 25°, representing the brittle uppermost lithosphere, overlying lower-crustal and mantle-lithospheric layers made of polydimethylsiloxane (PDMS), plasticine mixtures that reproduce the viscous strength of the deeper ductile lid. A pure PDMS layer represents the asthenosphere. Together, these layers form an analogue stagnant lid with brittle and viscous strength overlying a weaker interior. Localized foundering is initiated by a hemispherical density anomaly at the base of the lower crust. The viscosity scaling factor is 2.75 × 10⁻¹⁷, so that an experimental lithosphere viscosity of about 103 Pa s corresponds to a Venus-equivalent viscosity of about 1019 Pa s. This value is two to three orders of magnitude lower than estimates for cold, dry lithosphere and represents a thermally softened state expected where long-lived mantle plumes heat the base of the lid over geological timescales [6]. Internal deformation is resolved by dual-synchronous particle image velocimetry, while surface deformation is reconstructed by continuous stereo photogrammetry at a vertical resolution of 0.05 cm.
Results
Above the imposed basal density anomaly, gravitational instability first develops as a localized drip with a head and a trailing tail. As descent proceeds, the tail no longer remains axisymmetric. It progressively flattens and elongates into a sheet-like downwelling whose long axis exceeds its short axis by more than a factor of four. A comparable geometry has been documented in three-dimensional mantle convection simulations with yield-stress rheology [7] and has also been proposed as a recycling mode for the early Earth before the establishment of plate tectonics [8]. Above each foundering event, the lid bends but does not fragment. The surface develops the characteristic corona morphology, including a central depression, an annular topographic rise, and a deep arcuate trench. The trench forms by viscous flexure of the intact lid above the descending sheet, rather than by plate-boundary subduction. Morphological screening of Venus coronae catalogued from Magellan radar and gravity data identifies candidates that match successive experimental stages, including Artemis, Atahensik, and Nightingale coronae.
Implications
These experiments do not represent the global state of Venus. Instead, they isolate the mechanical response of a lithosphere whose viscosity has been reduced to about 10¹⁹ Pa s. In this regime, the lid yields viscously to underlying gravitational instabilities rather than failing by brittle plate-boundary processes. The thickened thermal boundary layer descends as a sheet, the overlying lid bends to accommodate removal, and a corona with an arcuate trench is preserved at the surface. This mechanism offers an alternative to plume-induced subduction [2] for the formation of arcuate trenches around large coronae. Combined with the global distribution of trench-bearing coronae and recent evidence for ongoing volcanic and tectonic activity, the results are consistent with Venus being in transition from a fully stagnant lid toward a plutonic squishy-lid mode of mantle heat loss. Thermally softened regions above long-lived mantle plumes are the most likely sites where this transition should be expressed at the surface. Scaled analogue experiments, therefore, capture the mechanical signature of local lithospheric foundering during a possible squishy-lid transition on Venus. Foundering of a thermally softened lithosphere provides a single plate-independent mechanism for trench-bearing coronae and offers testable predictions for upcoming VERITAS, EnVision, and DAVINCI observations.
Acknowledgements. This work was supported by the Freiburg Institute for Advanced Studies (FRIAS) under Grant 2100574001F1058.
References [1] Stofan, E. R. et al. (1992) JGR 97, 13347. [2] Davaille, A. et al. (2017) Nat. Geosci. 10, 349. [3] Gülcher, A. et al. (2020) Nat. Geosci. 13, 547. [4] Lourenço, D. L. et al. (2020) Geochem. Geophys. Geosyst. 21. [5] Cascioli, G. et al. (2025) Sci. Adv. 11, eadt5932. [6] Adams, A. C. et al. (2023) JGR Planets 128, e2023JE007879. [7] Trompert, R. & Hansen, U. (1998) Nature 395, 686. [8] Sizova, E. et al. (2010) Lithos 116, 209.
How to cite: Karagoz, O., Carboni, F., and Kenkmann, T.: Thermally weakened lithospheric foundering on Venus, analogue evidence consistent with a stagnant to plutonic squishy-lid transition, Europlanet Science Congress 2026, The Hague, The Netherlands, 7–11 Sep 2026, EPSC2026-471, https://doi.org/10.5194/epsc2026-471, 2026.
An outstanding question in Venus’ history is whether there was a dynamo magnetic field. While evidently not present now, such a dynamo in the past could have left an imprint in rocks, much like the ‘stripes’ of alternating magnetic signatures in our sea floor. While Venus is hot enough to demagnetize some minerals, a number are below their Curie point on Venus today, so it is possible that crustal fields may be retained in surface and near-surface rocks.
The sensitivity to magnetism falls off rapidly with distance, so the constraints established by orbital measurements at Venus are not severely binding, and we may recall that in fact the crustal magnetic fields were only discovered at Mars thanks to the low altitudes required for aerobraking of Mars Global Surveyor. A magnetic survey at modest altitude (~50km) by a balloon has been considered as a promising framework, with signatures about an order of magnitude higher than those sensed by orbiters.
A descent probe like DAVINCI will not traverse a large horizontal distance, even with Venus’ strong zonal winds. However, by taking data down to near-zero altitude, it offers much higher sensitivity to crustal fields than a balloon. Accommodation of a traditional magnetometer is not practical, however : a boom to separate the instrument from the platform is not aerodynamically or structurally feasible, and the high-temperature environment would be challenging for typical instrument designs. An instrument mounted inside the titanium pressure vessel hull of a probe would be able to detect an external field, but will be substantially perturbed by the fields generated by equipment on the probe such as solenoid valves in gas analysis instrumentation, shutter or filter wheel actuators, and switching currents to various systems.
Despite these unpromising factors, the prospects for detection of a crustal magnetic signature on a Venus probe may be substantially improved by the fact that a typical probe spins as it descends, with a period of a few seconds to tens of seconds. Thus, the horizontal component of an external field is sinusoidally-modulated at a known frequency by the spin, which facilitates the rejection of noise that varies on short timescales. It is additionally the case that the sensed component of a crustal field will characteristically increase during descent, as the vehicle approaches the surface.
The inclusion of even rudimentary magnetic sensing (and ‘magnetometer-on-a-chip’ devices, both fluxgate and magnetoresistive, are readily available and have negligible resource footprints) on a descent probe therefore offers substantial discovery potential. In addition, the ‘noise’ provides a potentially-useful diagnostic on the operation of probe equipment, and the operation of magnetic instrumentation during the hypersonic entry prior to descent may yield insights into the magnetohydrodynamics of the shock layer plasma flows which are responsible for the ‘entry blackout’ that suppresses radio communication. Thus, magnetic sensing contributes to NASA Engineering Science Investigation objectives. The data processing unit of the Venus Atmospheric Structure Investigation (VASI) on DAVINCI accommodates a magnetic sensor.
How to cite: Lorenz, R.: Detecting Crustal Magnetic Fields on Venus from a Descending Probe, Europlanet Science Congress 2026, The Hague, The Netherlands, 7–11 Sep 2026, EPSC2026-717, https://doi.org/10.5194/epsc2026-717, 2026.
With 1 Venusian day lasting 243 Earth days, Venus is the slowest-spinning planet in the Solar System and its rotational bulge is anomalously small. A rotational bulge (flattening) is the excess mass around the equator that stabilizes the orientation of planets. Having only a tiny stabilizer, the rotational pole of Venus is expected to easily separate from the figure pole (main inertia axis of the planet, MIA), which has been used to explain why both poles are observed to be 0.5° apart (Konopliv et al., 1999), several orders of magnitude more than on other terrestrial bodies.
One possible explanation for the 0.5° spin-figure axes (ω-MIA) offset is mantle convection (Spada et al., 1996). Here, we couple 3D mantle-convection simulations and polar motion dynamics to explore how mantle flow, and in particular surface mobilization, drives Venus’s polar motion. We provide a predictive framework for polar motion on slow rotators and show that the spin-figure pole separation (or offset) follows a simple law: it scales with the figure-axis drift rate times the planet’s Chandler period (Fig. 1b). However, in models matching Venus’s geoid, the figure-axis drift rate reaches only up to a few degrees per Myr (Fig. 1c), which is too slow compared to ca. 60°/Myr that is needed to excite the observed 0.5° offset (Patočka et al., 2025).
Another possibility is that it is the torque exerted on the solid Venus by its atmosphere that drives the ω-MIA offset. The atmosphere of Venus is extremely dense, with pressures reaching 93 bar at the surface, and its 4-day superrotation remains enigmatic. Several studies suggest that significant torques could result from the friction accommodating the interaction between atmospheric circulation and the topography of Venus (Navarro et al., 2018; Navarro and Schubert, 2024). Length of day variations suggest that the relative angular momentum of Venus’s atmosphere varies over time with diurnal and semidiurnal frequencies (Margot et al., 2021). To understand the role of torques exerted by the atmosphere on solid Venus, we solve the polar motion dynamics equations for arbitrarily prescribed surface forcing and investigate how the spin and figure axes separate during the excited polar motion. Both time-constant and time-varying torques are applied, mimicking different possible mechanisms of angular momentum transfer between the atmosphere and solid Venus. The results help in understanding the link between the atmospheric and polar motion dynamics of Venus and can be used to constrain the transfer of angular momentum between the atmosphere and the solid surface.

Figure 1: Polar motion response of Venus. a,b) Synthetic tests in which the loading is artificially prescribed: inertia axis of the load is first moving at the rate of 5°/Myr (polar motion is scalloped) and then abruptly slowing down to 1.2°/Myr (the change induces wobbling). The imposed difference between the main and the minor moments of inertia (C−A) is 2 orders of magnitude larger than C−A of the rotational bulge, similarly to values obtained from the observed geoid. In
steady state, the angular offset between the spin and figure axes α follows our scaling law, shown by the orange dashed line and described in the legend. c-d) Mantle convection simulation with moderate surface mobility. Paths of the rotational and figure poles on the globe (c), the evolution of Chandler period, as computed from the mantle flow-induced geoid (d), and the time evolution of the spin-figure axes offset, compared with our scaling law (panel e, blue vs. orange lines). The average angular separation of the figure and rotation axes is two orders of magnitude below the observed value (gray
dashed line). Adopted from (Patočka et al., 2025).
References
Konopliv, A., Banerdt, W., Sjogren, W., 1999. Venus gravity: 180th degree and order model. Icarus 139, 3–18.
doi:10.1006/icar.1999.6086.
Margot, J.L., Campbell, D.B., Giorgini, J.D., Jao, J.S., Snedeker, L.G., Ghigo, F.D., Bonsall, A., 2021. Spin state and
moment of inertia of venus. Nat. Astro. 5, 676–683. doi:10.1038/s41550-021-01339-7.
Navarro, T., Schubert, G., 2024. Mountain waves in the upper atmosphere of venus. Geophys. Res. Lett. 51,
e2023GL104922. doi:10.1029/2023GL104922
Navarro, T., Schubert, G., Lebonnois, S., 2018. Atmospheric mountain wave generation on venus and its influence on the
solid planet’s rotation rate. Nat. Geo. 11, 487+. doi:10.1038/s41561-018-0157-x.
Patočka, V., Maia, J., Plesa, A.C., 2025. Polar motion dynamics on slow-rotating venus: Signatures of mantle flow. AGU
Advances 6, e2025AV001976. doi:10.1029/2025AV001976.
Spada, G., Sabadini, R., Boschi, E., 1996. Long-term rotation and mantle dynamics of the Earth, Mars, and Venus.
J. Geophys. Res. Planets 101, 2253–2266. doi:10.1029/95JE03222.
How to cite: Patočka, V., Maia, J., and Plesa, A.-C.: Mantle and atmospheric drivers of the 0.5° offset between the spin and figure axes of Venus, Europlanet Science Congress 2026, The Hague, The Netherlands, 7–11 Sep 2026, EPSC2026-786, https://doi.org/10.5194/epsc2026-786, 2026.
In the absence of seismic measurements, a powerful method that can be used to probe the interior structure of Venus is the joint analysis of gravitational and topographic data (see Wieczorek, 2015a for a review). Several studies have used gravity and topography data to construct global crustal thickness maps of Venus over the past two decades (Anderson and Smrekar, 2006; James et al., 2013; Jiménez-Díaz et al., 2015; Yang et al., 2016; Zampa et al., 2018; Batov et al., 2023; Broquet et al., 2025), with differences in crustal thickness values associated with differences in the method and/or assumptions in the crustal thickness modeling. These studies found that the crustal thickness of Venus varies from 0 to >90 km. It is important to note that the assumptions in the crustal thickness modeling may lead to significant changes in the obtained results. The most important of these assumptions is the density contrast between the mantle and crust, which affects both the overall average crustal thickness as well as the amplitude of crustal variations in our model. In addition, it is required either to assume a mean crustal thickness or to anchor the inverted crustal thickness to a given value at a specific location (Wieczorek, 2015a).
For example, Jiménez-Díaz et al. (2015) constructed a global crustal thickness map assuming a mean crustal thickness of 25 km, and crust and mantle densities of 2900 and 3300 kg m-3, respectively. They found that the Venusian crust is usually 20–25 km thick with a thicker crust under the highlands. Since the crust-mantle density contrast was constrained to be 400 kg m-3 in their analysis, the assumed average crustal thickness of 25 km played an important role in the crustal thickness distribution. They found that the minimum and the maximum crustal thickness increase as the assumed average crustal thickness increases; also, the amplitude of crustal variations increases slightly with the average crustal thickness. In this study, we expand upon that work by exploring in more detail the density dependence of the crustal structure of Venus.
Global crustal thickness models were obtained from gravity and topography following the procedure described in Wieczorek and Phillips (1998) and Wieczorek (2015a). The topography and gravity data were obtained from the spherical harmonic models VenusTopo719 (Wieczorek, 2015b) and MGNP180U (Konopliv et al., 1999) respectively. The spherical harmonic coefficients have been truncated beyond degree 70 for all models.
Figure 1 shows how the assumed average crustal thickness affects the minimum and the maximum thickness of our global crustal thickness models. Furthermore, we consider the effects of the assumed density structure of the crust. Figure 2 shows the average and maximum crustal thicknesses as a function of crustal density. For each of our crustal thickness inversions, we assume a mantle density of 3300 kg m−3.
Finally, crustal plateaus, which are the largest tessera occurrences, have been proposed to be made up of differentiated crust with a continental-like composition (Romeo and Turcotte, 2008). A felsic composition for tessera terrain has been favored by infrared emissivity observations (Hashimoto et al., 2008; Helbert et al., 2008; Gilmore et al., 2015) and structural studies (Romeo & Capote, 2011; Resor et al., 2021). In order to account for lateral variations in crustal density (see Wieczorek et al., 2022), we have constructed a density model considering two densities, 2900 kg m−3 for the basaltic crust and 2800 kg m−3 for crustal plateaus considering them as felsic crust in our analysis (Figures 3 and 4). Note that we have included as differentiated crust Lakshmi Planum and the surrounding montes (including Maxwell Montes) for the purpose of discussion.

Figure 1. (a) Minimum (thin dashed lines) and maximum (thick solid lines) crustal thickness as a function of the average crustal thickness. Each colored curve corresponds to a different crustal density, ranging from 2600 to 2900 kg m−3. (b) Histograms of crustal thickness for an average crustal thickness of 15 and 50 km, respectively. For these specific models, the crustal density is 2900 kg m−3.

Figure 2. (a) Average and maximum crustal thickness as a function of crustal density. For this suite of models, the minimum crustal thickness is constrained to 1 km. (b) Histograms of crustal thickness for a crustal density of 2600 and 3100 kg m−3, respectively.

Figure 3. (a) Topography of Venus from the spherical harmonic model VenusTopo719 (Wieczorek, 2015b), referenced to the mean planetary radius. (b) Reference crustal density model.

Figure 4. (a) Crustal thickness model for Venus with a constant density crust. For this specific model, the crustal density is everywhere 2900 kg m−3, the mantle density is 3300 kg m−3, and the minimum crustal thickness is constrained to 1 km. (b) Global crustal thickness model that considers a lower crustal density for the crustal plateaus (2800 kg m−3) than for the surrounding plains and lowland regions (2900 kg m−3).
References:
Anderson, F.S., & Smrekar, S.E. (2006). J. Geophys. Res., 111(E8), E08006.
Batov, A.V., et al. (2023). Sol. Syst. Res. 57, 25–34.
Broquet, A., et al. (2025). J. Geophys. Res.: Planets, 130, e2025JE009139.
Gilmore, M. S., et al. (2015). Icarus, 254, 350-361.
Hashimoto, G.L., et al. (2008). J. Geophys. Res.: Planets, 113, E00B24.
Helbert, J., et al. (2008). Geophys. Res. Lett. 35, L11201.
James, P.B., et al. (2013). J. Geophys. Res.: Planets, 118(4), 859–875.
Jiménez-Díaz, A., et al. (2015). Icarus, 260, 215–231.
Konopliv, A.S., et al. (1999). Icarus, 139(1), 3–18.
Resor, P.G., et al. (2021). J. Geophys. Res.: Planets, 126, e2020JE006642.
Romeo, I. & Turcotte, D.L. (2008). Earth Plan. Sci. Let., 276, 85-97.
Romeo, I., & Capote, R. (2011). Planet. Spa. Sci., 59, 1428-1445.
Wieczorek, M.A. (2015a). In T. Spohn & G. Schubert (Eds.) Treatise on geophysics (2nd ed.), 10, 153–193. Elsevier.
Wieczorek, M.A. (2015b). Spherical harmonic model of the planet Venus: VenusTopo719 [Dataset]. Zenodo.
Wieczorek, M.A., et al. (2022). J. Geophys. Res.: Planets, 127, e2022JE007298.
Yang, A., et al. (2016). Planet. Space. Sci., 129, 24–31.
Zampa, L.S., et al. (2018). Planet. Space Sci., 157, 48–62.
How to cite: Jiménez-Díaz, A., Álvarez-Lozano, J., Egea-González, I., Wieczorek, M. A., Romeo, I., and Ruiz, J.: Effect of crust density in global crustal thickness inversions on Venus, Europlanet Science Congress 2026, The Hague, The Netherlands, 7–11 Sep 2026, EPSC2026-953, https://doi.org/10.5194/epsc2026-953, 2026.
Increasing observational evidence and recent geodynamical modelling indicate that Venus may have experienced or may still experience tectonic-like processes (Sulcanese et al., 2024; Gülcher et al., 2025). In fact, surface deformation is believed to be driven primarily by mantle convection and plume-lithosphere interactions, producing a wide range of tectono-volcanic features (Smrekar et al., 2023). A key expression of this deep dynamics is the global network of rifts (chasmata), which extends for thousands of kilometres (Graff et al., 2018; Brossier et al., 2022). However, their driving mechanisms, temporal evolution, and lithospheric structure remain poorly constrained as a result of limited observational data. Therefore, constraining the evolution of Venusian chasmata is essential to understanding the interior dynamics of the planet and its evolution.
In this study, we used forward 2D numerical models to constrain the rates, durations, and lithospheric structures of extensional processes, integrating observational evidence from topography and gravity anomalies to improve our understanding of Venusian rifting. In particular, we tested different extensional velocities and lithospheric and crustal thicknesses.
For comparison with topographic and gravity observation, we extracted 12 topographic cross-sections along 28 Venusian rift axis. To minimize 3D effects when compared with our 2D numerical models, we evaluated the longitudinal variability of topography by grouping three or more adjacent cross-sections and computing their mean profiles. Only portions of the rifts that did not show statistically significant variations in topography were considered for our com-
parison. We then compared the mean topography of these rift portions with the topography predicted by the models. Finally, we compared the gravity anomalies derived from the selected rift portions with the gravity anomalies extracted by the models.
We observed that extensional velocities between 0.5 and 2 cm yr−1 reproduce the observed topography well, while lower velocities often do not allow for the development of rifting structures. In addition, models with a lithospheric thickness of 100 km and a crustal thickness of 15 km show the best topographic fit with observations. Finally, comparing the observations with the evolution of the models at different times allows us to recognize an asynchronous evolution in the Diana chasma, with differences of approximately 1 Myr along its axis.
References
J. Brossier, M. S. Gilmore, and J. W. Head. Extended rift-associated volcanism in ganis chasma, Venus detected from magellan radar emissivity. Geophysical Research Letters, 49 (15):e2022GL099765, 2022. doi:10.1029/2022GL099765.
J. Graff, R. Ernst, and C. Samson. Evidence for triple-junction rifting focussed on local magmatic centres along parga chasma, Venus. Icarus, 306:122–138, 2018.
doi:10.1016/j.icarus.2018.02.010.
A. J. Gülcher, M. Gurnis, and S. E. Smrekar. Dynamics of venusian rifts and their interactions with plumes and intrusions. Earth and Planetary Science Letters, 667:119514, 2025. doi:10.1016/j.epsl.2025.119514.
S. E. Smrekar, C. Ostberg, and J. G. O’Rourke. Earth-like lithospheric thickness and heat flow on Venus consistent with active rifting. Nature Geoscience, 16:13–18, 2023. doi:10.1038/s41561-022-01068-0.
D. Sulcanese, G. Mitri, and M. Mastrogiuseppe. Evidence of ongoing volcanic activity on Venus revealed by Magellan radar. Nature Astronomy, 8:973–982, 2024. doi:10.1038/s41550-024-02272-1.
How to cite: Regorda, A., van Zelst, I., Maia, J., Erdős, Z., and Thieulot, C.: Constraining the evolution of Venusian rifts: an integratedobservation and modelling approach, Europlanet Science Congress 2026, The Hague, The Netherlands, 7–11 Sep 2026, EPSC2026-441, https://doi.org/10.5194/epsc2026-441, 2026.
Introduction: The geochemical behavior of C and S has strongly influenced Venus’ evolution. Their degassing from the interior shaped the present greenhouse atmosphere and clouds [1,2], while they may also contribute to the low-viscosity melts responsible for surface features such as canali channels [e.g. 3,4] and the formation of surface coatings [5]. C and S further affect core properties and the potential for thermochemical convection within Venus’ interior. However, Venus’ interior and core composition remain poorly constrained. Ref. [6] examined permissible core mass fractions and O and Si contents based on geochemical modeling and moment of inertia, but did not consider C and assumed very high S contents (<22 wt.%), whose compatibility with current bulk Venus composition estimates remains uncertain.
Methods: Constraints on the C and S fluxes during accretion of Venus requires constraints on the chemical composition of bulk Venus. There is a significant degree of chemical similarity between bulk Venus and bulk Earth [7]. Venera and VEGA chemical data indicate that the K/Th and K/U ratios of Venusian basalts, which are considered representative of the bulk planet given the incompatibility and lithophile behavior of K [8], could point to similar abundance of volatile elements in both planets. However, estimates of 1–3.1 wt.% S have been inferred for bulk Venus, based on equilibrium condensation models [9]. This is up to 5 times higher than bulk Earth [10]. Instead, Venus likely has a similar volatile element budget compared to Earth, for example reflected by N and C estimates [11,12]. Mass balance considerations and dynamical models both point to volatile element homogenization of the Earth and Venus region [13]. For bulk Venus, bulk Earth values for C and S are thus assumed (2650±2220 µg/g C, 6100±1465 µg/g S [10]). This estimate also takes a potential depletion of S in bulk Venus relative to bulk Earth into account (Fig. 1). The available geophysical and geochemical models indicate a relative core mass of 22 to 38 mass % [6] which is the range that will be explored here.
To quantify the C and S budget of the core and co-existing silicate magma ocean, partition coefficients (D's) are required. The D's and solubilities of C and S were calculated along the estimated liquidus temperature of terrestrial pyrolite [16,17] using existing high-pressure models [18–20] that are calibrated up to pressures largely relevant for Venus’ mantle. Crystallization of an outer magma ocean on Venus likely occurs bottom upwards [7], with a maximum (average) core equilibration pressure of 80 GPa [21,22]. A basal magma ocean could have existed on Venus [22], which would have evolved largely isolated from the outer magma ocean, thereby not affecting the subsequent evolution of C and S in the outer magma ocean. Accretion models of Venus indicate a peak temperature of metal equilibration of 3750 K and 71 GPa [e.g. 21]. Using the assumed bulk S and C content, the degree to which both C and S partitioned into the core and mantle was calculated assuming (1) a simplified single-stage and full equilibration model [6,18] assuming an ‘’average’’ core formation pressure or (2) by implementing the results of multi-stage accretion models [18,21] for Venus.
Fig. 1: Bulk planet S abundances [10,14,15] versus heliocentric distance
Results: In this abstract, we only report results on the single-stage accretion model. For the considered CMF range, the mantle FeO content was re-calculated to ensure internal consistency (Fig. 2). For example, for a bulk Venus composition with 31.2 wt. % Fe [10], comprising a 90 wt.% Fe core, a CMF of ~0.22 corresponds with a FeO mantle content of 20 wt.%. For the latter composition, the maximum CMF is ~0.35.

Fig. 2 Venus’ CMF versus mantle FeO, MgO for a bulk Earth composition. Vertical shaded bar represents the considered core mass fractions in this study [e.g. 6].
The resulting core and mantle composition for element i was then calculated using a simple mass balance approach [23]. The calculations suggest a bulk Venus core composition of 0.1–2.2 wt.% C and 1.2–3.4 wt.% S. Despite the many uncertainties related to Venus, several commonly assumed core compositions can be ruled out based on plausible geochemical constraints. The S content inferred for the core is generally lower than considered in previous studies: the calculations exclude intermediate or S-rich core compositions as proposed in previous work [6]. Unless bulk Venus was significantly enriched in S, which does not agree with existing geochemical or dynamical models of the inner solar system, the Venusian core is relatively S-poor, regardless of the accretion scenario considered. More modeling results will be reported at the meeting.
Fig. 3 Calculated bulk core and mantle C and S content assuming single-stage core formation. Given the overall iron-loving behavior of S and C across a wide range of P-T conditions, the core compositions are (near)-constant across the full P-T range applicable to Venus.
Acknowledgments: ESS acknowledges funding of ERC StG VenusVolAtmos.
References: [1] Gillmann et al. (2022) Space Sci Rev [2] Jorritsma et al. (this meeting) [3] Aerts et al. (this meeting) [4] Jorritsma et al. (2026) LPSC [5] Dyar et al. (2021) Icarus [6] Shah et al. (2022) Astrophys. J. [7] Lammer et al. (2020) Icarus [8] Treiman (2009) Venus Geochemistry: Progress, Prospects, and New Missions [9] Kaula et al. (1981) In: Basaltic volcanism on the terrestrial planets [10] Wang et al. (2018) Icarus [11] Halliday (2013) GCA [12] Lécuyer et al. (2000) EPSL [13] Wetherill (1986) In: Origin of the Moon [14] Lodders & Fegley (1997) Icarus [15] Steenstra et al. (2019) Icarus [16] Fiquet et al. (2010) Science [17] Andrault et al. (2011) EPSL [18] Suer et al. (2017) EPSL [19] Blanchard et al. (2022) ESPL [20] Steenstra et al. (2022) GPL [21] Rubie et al. (2015) Icarus [22] Trønnes et al. (2019) Tectonophys [23] Steenstra and van Westrenen (2020) Icarus
How to cite: Steenstra, E. and Suer, T.-A.: The Carbon and Sulfur Cycles during Accretion of Venus and Implications for its Enigmatic Evolution , Europlanet Science Congress 2026, The Hague, The Netherlands, 7–11 Sep 2026, EPSC2026-784, https://doi.org/10.5194/epsc2026-784, 2026.
Introduction: The possibility of oceans on early Venus remains at the centre of a wider debate about the evolution of climate divergence with Earth. Modern Venus’s atmosphere presents low water vapour abundance (e.g.,Bézard et al., 2011; Cottini et al., 2015; Encrenaz et al., 2015) and a substantially enriched deuterium-to-hydrogen D/H ratio relative to Earth (Fedorova et al., 2008; Taylor & Grinspoon, 2009; Krasnopolsky et al., 2013; Encrenaz et al., 2015; Wilson et al., 2021; Westall et al., 2023; Mahieux et al., 2024). This high D/H ratio might constitute evidence for loss of a substantial water reservoir (Taylor & Grinspoon, 2009; Way et al., 2016; Gillmann et al., 2020; Wilson et al., 2021). Climate modelling studies have also shown two possible scenarios. Some models argue that a temperate climate is possible from the combination of slow rotation and dayside cloud-albedo feedback (Yang et al., 2014; Way et al., 2016; 2020). Other models suggest that water condensation from the steam atmosphere was prevented by nightside stratospheric clouds (Turbet et al., 2021). Another line of evidence comes from tidal dissipation in a putative ocean. Green et al., 2019 showed a similar magnitude effect to the present-day torque exerted by the modern dense atmosphere can be produced by ocean tides on Venus in a 330-m mean depth ocean. Here, we explore a possible evolutionary branch on early Venus, assuming water condensation from the steam atmosphere, to examine ocean circulation, tides, and their transfer of angular momentum from the ocean to the solid body.
Ocean circulation: Assuming water condensation from the steam atmosphere, we will explore the ocean circulation and heat redistribution on a putative ocean on Venus at 2.9 Ga. We simulate the ocean using the 3D General Circulation Model (GCM), the ROCKE-3D (Resolving Orbital and Climate Keys of Earth and Extraterrestrial Environments with Dynamics), developed at the NASA Goddard Institute for Space Studies (Way et al., 2017). We use a spatial resolution of 4º x 5º (latitude by longitude), a 40-layer atmosphere (top pressure, 0.1 hPa), and a 13-layer fully dynamic ocean (Russel et al., 1995) coupled to the atmosphere. All simulations use an isolation of 2001 W/m2, 1.47x times that of modern Earth, representing conditions at 2.9 Ga. Atmospheric composition is Earth-like, with a 1-bar N2 atmosphere (400 ppm CO2 and 1 ppm CH4) (Way et al., 2020). Modern values of Venus’s surface gravity, radius, obliquity, eccentricity and rotation rate (retrograde slow-rotator: -243 days) are used (Way et al., 2016).
Here we present results of four ocean scenarios, with different global equivalent layers (GEL): two using a modern Venus-like topography, 310-m and 1000-m, provided by the NASA/Magellan archive; one with a 1360-m bathtub ocean (subareal topography equal to the 310-m Venus, no bathymetry); and a 158-m aquaplanet. In the 310-m scenario (reference), the ocean covers about 60% of the surface and has a volume of 1.4 x 10¹⁷ m3, one order of magnitude below that of modern Earth’s Ocean or 10% its volume (Way et al., 2016). The 1000-m scenario explores a deeper ocean on Venus, with a volume of 35% of Earth’s Ocean and a surface area of about 88%. The 1360-m bathtub Venus explores the impacts of bathymetry and land distribution on the ocean circulation. The 158-m aquaplanet is used as a control case. Main results show a significant monthly-long diurnal cycle, leading to the day-night reversal of ocean and atmospheric circulations (see Figure 1) in all cases.

Figure 1. Coupled Ocean-Atmosphere stream functions for the four ocean scenarios. The left (right) part of each diagram depicts the day (night) circulation. The yellow circle represents the ocean surface.
This diurnal cycle also leads to the development of a considerable mixed layer at the equator, largely impacting global patterns of subsidence and upwelling. Our results also show that, due to the albedo feedback, lower sea surface area, the 310-m Venus has a colder global temperature: 15ºC colder than the 158-m Aquaplanet despite having the same water volume, highlighting the importance of land/sea surface in controlling climate and the longevity of this climate state. In the case of the 310-m Venus, a highly saline Southern Ocean forms controlled by a mass balance favouring evaporation and limited exchange with the remaining global ocean.
Ocean tides: Tides on a Venusian ocean are simulated using the Oregon State University Tidal Inversion Software (OTIS), which solves the linearised shallow-water equations (Egbert et al., 2004), and is extensively used to simulate tides on Earth (Green et al., 2017; 2018; Wilmes et al., 2017). Previous simulations assume a modern topography on Venus (Green et al., 2019). However, the present-day volcanic topographic rises might not have formed on early Venus, as geodynamic studies suggest (e.g.,Tian et al., 2023). In this work, we replace the volcanic rises with topography generated by geodynamic model evolution, while keeping the highlands as Aphrodite and Ishtar Terrae (see Figure 2). We explore the impact of multiple rotation rates (from prograde to retrograde, including fast- and slow-rotator cases), stratification, and ocean depth.

Figure 2. (Left) NASA/Magellan topography. (Right) New topography with the removal of volcanic topographic rises.
References: Bézard B, et al.,2011.Icarus.216:173 --Cottini et al.,2015.Space Sci.113:219 --Egbert, G.D., et al.,2004.JGRC,109,C03003 --Encrenaz T, et al.,2015. Space Sci.113:275 --Fedorova,A, et al.,2008.JGR:Planets, 113,E5 --Gillmann, C, et al.,2020.Nat Geosci,13,4 --Green, J., et al.,2017.E&PSL, 461,46 --Green, et al.,2018.GeoRL, 45, 3568 --Green, et al.,2019.ApJL,876, L22 --Krasnopolsky V, et al.,2013.Icarus.224:57 --Mahieux, A, et al.,2024.PNAS, 121,34 --Russell G.L., et al.,1995.Atmos-Ocean.33:683 --Taylor, F & Grinspoon, D,2009.JGR:Planets,114,E9 --Tian, J., et al.,2023.Icarus, 399, 115539 --Turbet M., et al.,2021.Nature.598:276 --Way M.J., et al.,2016.GRL.43 --Way M.J., et al.,2017.ApJS.213:12 --Way M.J. & Del Genio A.D. 2020.JGR:Planets.125 --Way M, et al.,2022. Sci. J.3:92 --Westall, F,2023.Space Sci Rev, 219, 2, 17 --Wilmes, S.-B.,2017.JGRC, 122, 8354 --Wilson, C.F., et al.,2022.Exp Astron, 54,2 --Yang J, et al., 2014.ApJL., 787, L2.
Funding: DQ acknowledges this work to be supported by FCT - Fundação para a Ciência e Tecnologia, I.P. by project reference and DOI identifier 10.54499/2023.05220.BD
How to cite: Quirino, D., Green, J. M., Way, M. J., Duarte, J. C., Machado, P., Gillmann, C., and Lourenço, D. L.: Tides and Ocean Circulation on a temperate ancient Venus , Europlanet Science Congress 2026, The Hague, The Netherlands, 7–11 Sep 2026, EPSC2026-1039, https://doi.org/10.5194/epsc2026-1039, 2026.
Please decide on your access
Please use the buttons below to download the supplementary material or to visit the external website where the presentation is linked. Regarding the external link, please note that Copernicus Meetings cannot accept any liability for the content and the website you will visit.
Forward to presentation link
You are going to open an external link to the presentation as indicated by the authors. Copernicus Meetings cannot accept any liability for the content and the website you will visit.
We are sorry, but presentations are only available for conference attendees. Please register for the conference first. Thank you.
You have already stored your personal programme. Please decide:
the present selections with my stored personal programmemy stored personal programme with the present selections
Please decide on your access
Please use the buttons below to download the supplementary material or to visit the external website where the presentation is linked. Regarding the external link, please note that Copernicus Meetings cannot accept any liability for the content and the website you will visit.
Forward to session asset
You are going to open an external link to the asset as indicated by the session. Copernicus Meetings cannot accept any liability for the content and the website you will visit.
We are sorry, but presentations are only available for conference attendees. Please register for the conference first. Thank you.