TP12 | Sediment Transport Processes in the Solar System

TP12

Sediment Transport Processes in the Solar System
Convener: Giulia Magnarini | Co-conveners: Lonneke Roelofs, Lisanne Braat, Sharon Diamant, Zach Dickeson
Orals FRI3
| Fri, 11 Sep, 14:00–15:30 (CEST)|Room Jupiter (Jazz 1 & 2)
Posters THU-POS
| Attendance Thu, 10 Sep, 18:00–19:30 (CEST) | Display Thu, 10 Sep, 08:30–19:30|Foyer 2, F2.42–49
Fri, 14:00
Thu, 18:00
Sediment transport processes are fundamental for shaping the surfaces of rocky and icy bodies in the Solar System. These processes are varied; from mass-wasting on hillslopes, to the transport of sediment in water- and non-water-based systems, to aeolian processes across a wide range of surfaces and atmospheres. Much of the fundamentals of these processes remain poorly understood in the varying surface environments of the planetary bodies in our Solar System: from the mobility of landslides and debris flows on Mars, to the dynamics of deltas and fluvial systems on Mars and Titan, to aeolian bedform morphology and dynamics on Mars, Titan, Pluto, as well as asteroids and cometary bodies.

The aim of this session is to bring together researchers from different disciplines such as geomorphology and sedimentology to stimulate knowledge exchange based on the broad topic of sediment transport processes under varying planetary conditions, rather than one planetary environment.

We encourage contributions based on, but not limited to, mass-wasting processes (landslides and debris flows), sediment transport environments (rivers and deltas) on Earth, Mars, and Titan, and aeolian bedforms under different surface atmospheric interaction conditions (from rocky and icy planetary bodies to small solar system bodies). We welcome a broad range of approaches: remote sensing (geomorphological, geophysical and compositional analysis), laboratory experiments, numerical modelling, as well as analogue studies.

Orals: Fri, 11 Sep, 14:00–15:30 | Room Jupiter (Jazz 1 & 2)

Chairpersons: Giulia Magnarini, Lonneke Roelofs, Sharon Diamant
14:00–14:03
Aeolian Processes
14:03–14:18
|
EPSC2026-655
|
ECP
|
solicited
|
On-site presentation
Elena Favaro

Every Grain Tells a Story: Deciphering Planetary Processes Through Sediment Transport on Earth, Mars, and Beyond 

Introduction

Across the solar system, granular material - from microns to meters across - moves through air, water, and materials in between. This fluid-, gravity-, impact-, and sublimation/volatile-driven transport represents fundamental geological and geomorphological processes responsible for shaping surfaces of rocky and icy worlds across our solar system. And yet, despite the importance and ubiquity of sediment transport, our ability to observe, predict, and model these processes beyond Earth remains difficult. 

Mars represents a natural laboratory on which we can refine terrestrial-derived and validated sediment transport equations, assumptions, and limitations with orbital images and in situ observations. However, the translation from Earth to Mars (indeed, any other solar system body) is not straightforward. Differences in atmospheric density, gravity, grain properties, and the absence of liquid water under present conditions mean that terrestrial models cannot be applied uncritically. 

Scales of the Problem

Mars Global circulation models (MGCMs), mesoscale models, and large eddy simulations (LES) of near-surface winds and vorticity are approximated from our ‘best guess’ of atmospheric dynamics on Mars, which take into account, among many factors, past and present-day obliquity, orbital eccentricity, turbulence, ice reserves, dust loading, atmospheric density, gravity, and the precession of perihelion. We apply these models to synoptic, regional, local, and site-specific locations which, in turn, have their own landscape-level factors (such as topography and sediment supply) to consider [1]. Determining how these elements interact requires a careful consideration and balance between evidence, hypotheses, and speculation. 

The surface of Mars preserves extensive evidence of aeolian modification across a wide range of spatial and temporal scales. Dust and granular features such as centimetre-scale ripples [2,3],  meter- to decimetre-scale transverse aeolian ridges [4], decimetre- to kilometre-scale dust devils (whose columns can extend for kilometres into the atmosphere) [5], and kilometre-scale dunes, dune fields, and unconsolidated sand-sheets [1,6-7], speak to the active and/or contemporary (geologically-speaking) sediment transport shaping Mars on observable timescales. Consolidated features such as centimetre- to meter-scale ventifacts and stratigraphic exposures [8-9], meter- to decimetre-scale periodic bedrock ridges [10-11], and kilometre-scale yardangs [12] speak to old much older (geologically speaking), perhaps inactive, or otherwise static features whose morphology and orientation speak to much older climatic regimes. Taken together, Martian features encode information about contemporary and palaeoclimatic (wind) regimes, erosion rates, and sediment production, availability, and flux [13-14]. Reading these signals is therefore critical to understanding the Martian environment across spatial and temporal scales, and for the safe and efficient operation of surface missions.

Decoding Transport Signals in Practice

In this presentation, I will draw on decades’ worth of sediment transport work on Mars, with a special emphasis on recent work at Oxia Planum, the 2030 landing site of the ExoMars Rosalind Franklin rover. I will highlight the work undertaken to piece together the complicated surficial and climatic history of the landing site, and Mars in general. I will discuss our recent morphometric work on TARs [15-16] , PBRs [11,15-16] , dust devils [15,17], and wind streaks [18] and highlight the MGCM, mesoscale, and LES modelling results that continually challenge our interpretations, not only of the landscape, but of our modelling assumptions as well.

I will also draw on fieldwork from the Puna Plateau of Northwestern Argentina [19] (a high-altitude, hyper-arid, vegetation-free landscape, with strong diurnal temperature swings), Lake Askja, Iceland [20] (a basaltic landscape at the foot of an active volcano in the central highlands in Vatnajökull National Park), and Scoraig, Scotland [21] (a remote site hosting an exceptionally preserved deltaic succession that coincided with the emergence of life on Earth) to review the ways in which we apply terrestrial understanding to Martian landscapes.

Beyond Mars

Atmospheric modelling, interpretation of orbital images and in situ observations, and leveraging terrestrial analogues, all illustrate a broader principle: sediment transport, and the features created, are archives of environmental conditions in absence of large-scale site-specific atmospheric, climatic, geologic, and geomorphologic data on Mars. Interpreting these archives requires an understanding of the full chain of processes, from atmospheric forcing to grain-scale interaction. On Earth, we can observe each link in that chain. On Mars, we often only observe endpoints or snapshots of processes; intermediate conditions must be inferred. As we extend our sights elsewhere in the solar system - from the dense winds of Venus, to the methane rivers of Titan, or to the electrostatically charged surfaces of airless bodies - even those endpoints become difficult to decipher. Continuing work on Mars, informed by research conducted on Earth, provides us with a dynamic template on how to approach sediment transport studies on other bodies. Fundamentally, we all want to know the same thing: what moved this material, and what does its surface expression tell us about the world it sits on? 


[1] Chojnacki et al., 2019. Geology, 47(5); [2] Lapotre et al., 2019. Science, 353(6294); [3] Lapotre et al., 2018. GRL (45)19; [4] Balme et al., 2008. Geomorphology, 101(4); [5] Reiss et al., 2017. Dust Devils; [6] Thomas et al., 1981. Icarus (45)1; [7] Runyon et al., 2017. EPSL 457; [8] Herkenhoff et al., 2023. JGR: P, 128(3); [9] Banham et al., 2026. Geology; [10] Montgomery et al., 2012. JGR 117(E3); [11] Favaro et al., 2024. EPSL 626; [12] Mandt et al., 2008. JGR 113; [13] Davis et al., 2020. Earth and Space Sci. 7; [14] Swann et al., 2020. GRL 47(3); [15] Favaro et al., 2021. JGR: P, 126(4); [16] Silvestro et al., 2021. GRL, 48(4); [17] Grindrod et al., 2025. EPSC-DPS 2025 Meeting; [18] Silvestro et al., 2026. EGU26-11725; [19] Favaro et al., 2020. Icarus, 113765; [20] Favaro et al., 2023. 54th LPSC; [21] Banham et al., 2023. 54th LPSC.

How to cite: Favaro, E.: Every Grain Tells a Story: Deciphering Planetary Processes Through Sediment Transport on Earth, Mars, and Beyond , Europlanet Science Congress 2026, The Hague, The Netherlands, 7–11 Sep 2026, EPSC2026-655, https://doi.org/10.5194/epsc2026-655, 2026.

14:18–14:30
|
EPSC2026-233
|
On-site presentation
Alexander M. Barrett, Matthew R. Balme, Elena A. Favaro, Kylash Rajendran, Mark J. Woods, Laila Elsarky, Mateusz Malinowski, James A. Holmes, Lori-Ann Foley, and Manish R. Patel

Transverse Aeolian Ridges (TARs)1 are decametre scale bedforms, common across the martian mid-latitudes. TARs are armoured by a layer of granule sized clasts. Intense gusts of wind mobilise the armouring layer, initiating the movement of the bedforms and causing TARs to align transverse to prevailing peak winds. Since the majority of mid latitude TARs show little to no movement in the present day2, TAR orientations provide a geomorphic record of historic wind vectors, in the epoch when large scale sediment transport last occurred.

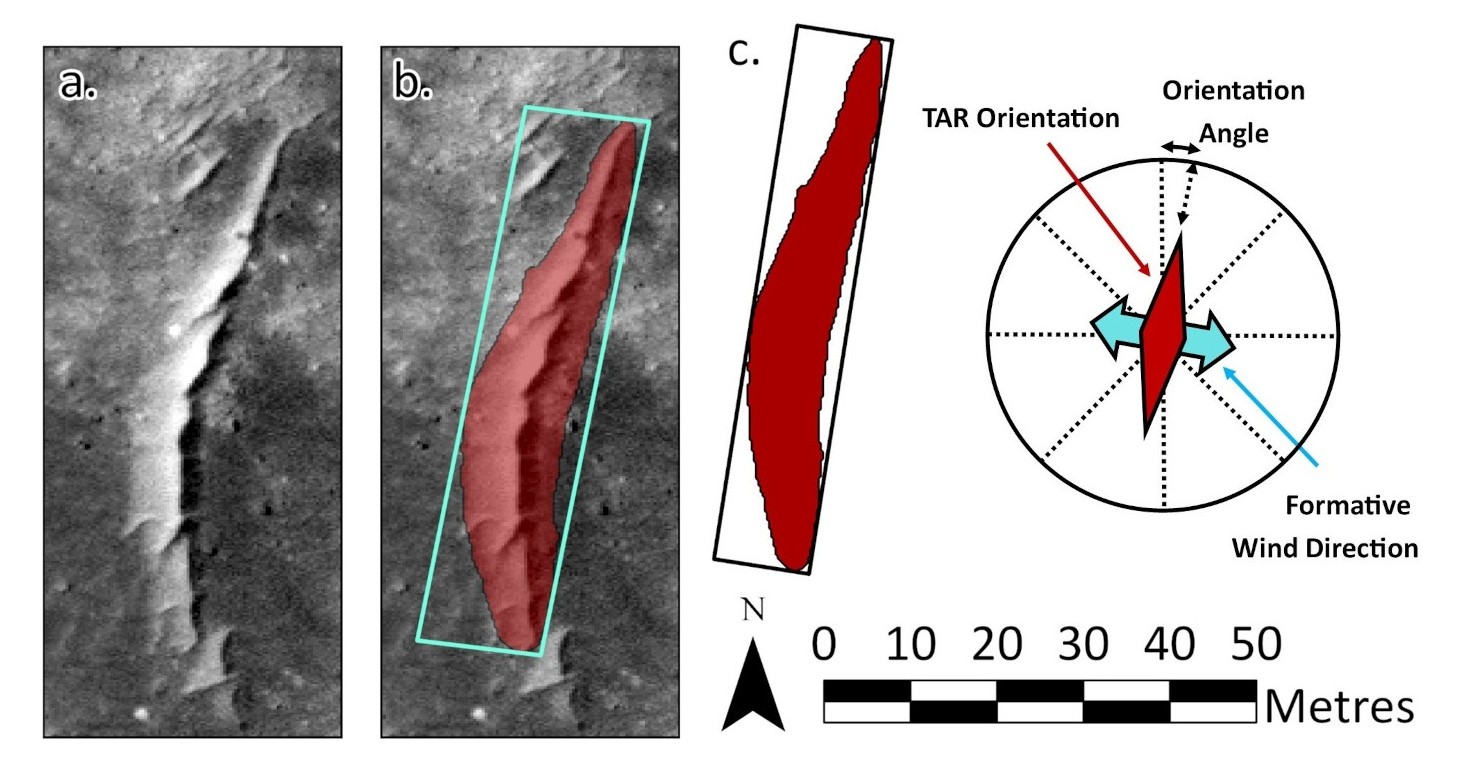
A deep learning approach3 was used to segment TARs in ~10,000 HiRISE Images4 (e.g. Fig 1). A Mask R-CNN model with a ResNet 50 backbone was trained on ~5000 manually digitised TARs from six representative images. Once segmented, candidate TARs were cleaned and measured using an ArcPy-based postprocessing pipeline which recorded their orientation. The network performed well, producing comparable orientation results to manually mapped TARs.

Figure 1: a) A TAR in HiRISE image ESP_ 057724_1390, b) the TAR is detected by the network (red segmentation mask) and a rotated bounding box (turquoise) is fitted to it using the ArcGIS “minimum bounding geometry” tool  c) the long axis of the bounding box provides a proxy for TAR orientation. The formative wind direction is inferred to be perpendicular to this, blowing across the feature. There is a 180° ambiguity when since the stoss and lee slopes cannot be distinguished automatically.

Most images contained a few tens of false positives, however, since thousands of true positive TARs were present, the TAR signal was easily distinguishable from this “noise”.  Sites with <1000 detections seldom contained real TAR populations and were removed from the dataset. False negatives occurred frequently and randomly. While they reduced the overall sample size, they were found to not introduce a systematic bias into the orientation measurements, and did not adversely affect the results.

Using this approach, ~20 million TARs were digitised, allowing TAR orientation to be characterised over an unprecedentedly large area. Global orientation trends were examined, while regional analysis focused on an area covering Isidis, Elysium, and the southern half of Utopia Planitia, and adjoining highlands in Syrtis Major and along the Dichotomy Boundary.

Low relief plains were found to exhibit spatially coherent TAR alignments which extend across dozens of adjacent HiRISE images. This provides a strong signal for wind direction during TAR forming epochs. In rugged areas, local relief preferentially controlled TAR formation, yielding heterogeneous or multimodal orientations. Larger scale topographic control was found in outflow channels, or impact craters. These sites were identified by manually comparing the regional TAR orientation trends to topographic maps from the Mars Orbiter Laser Altimeter (MOLA).5

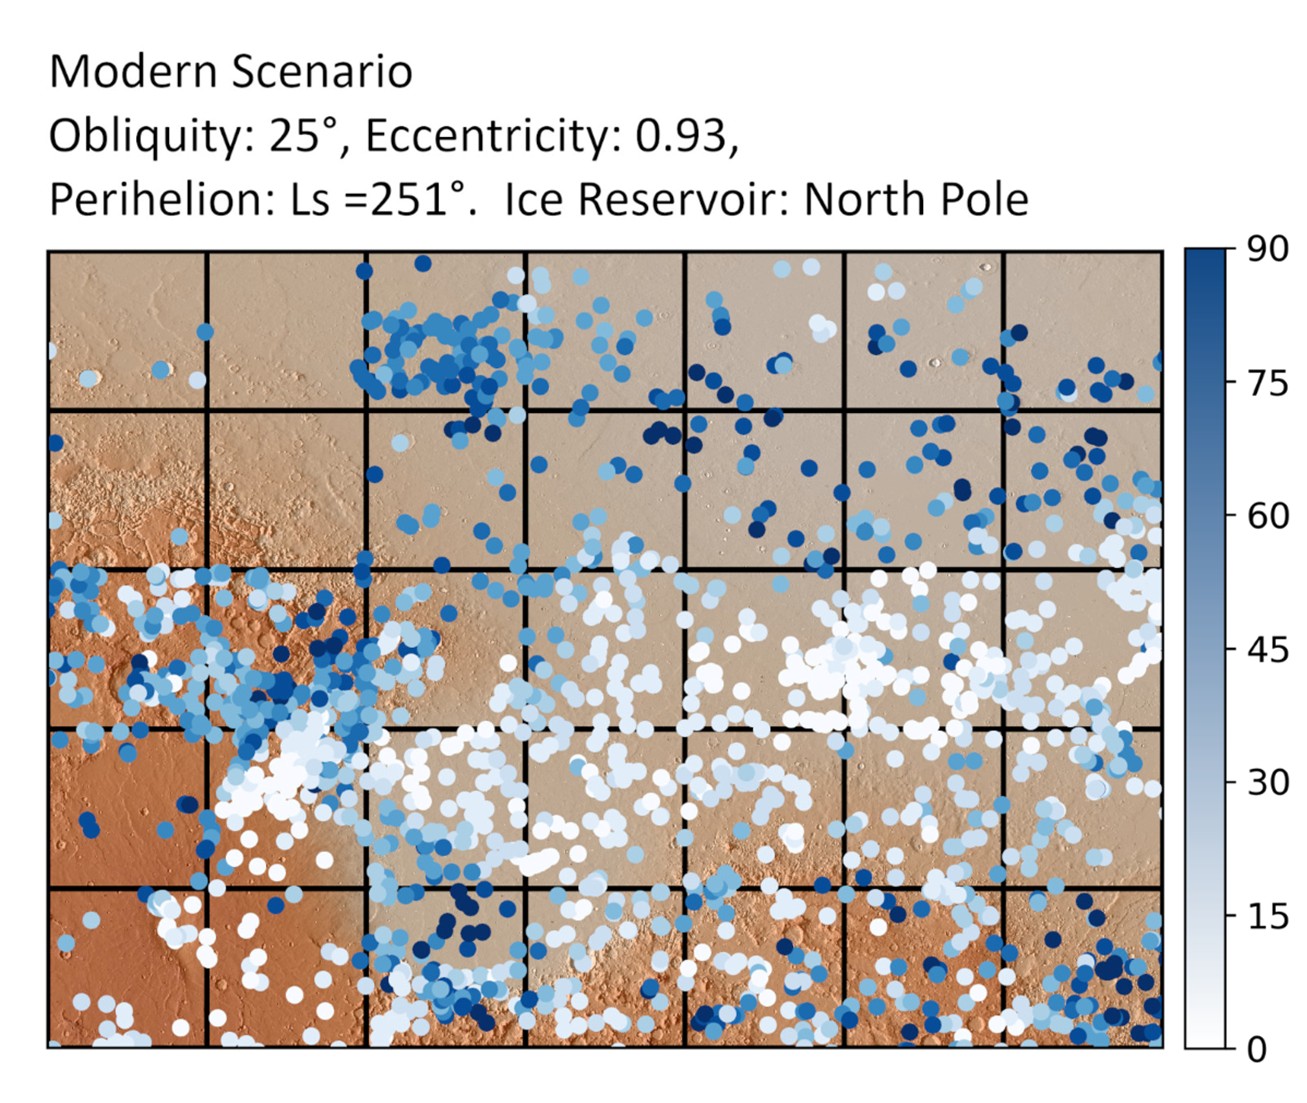
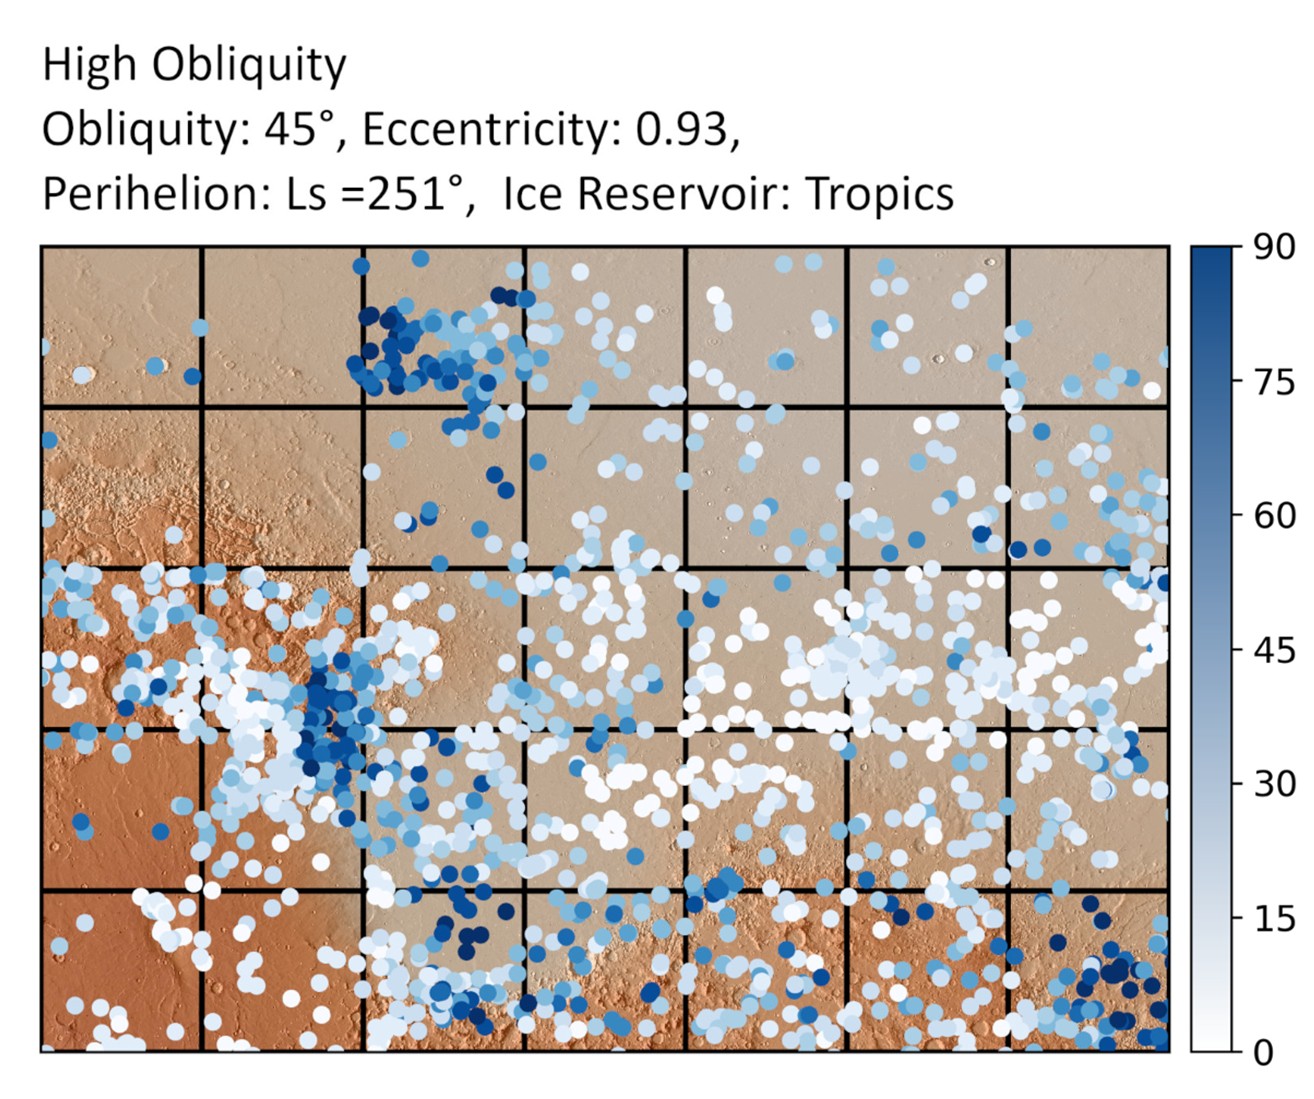
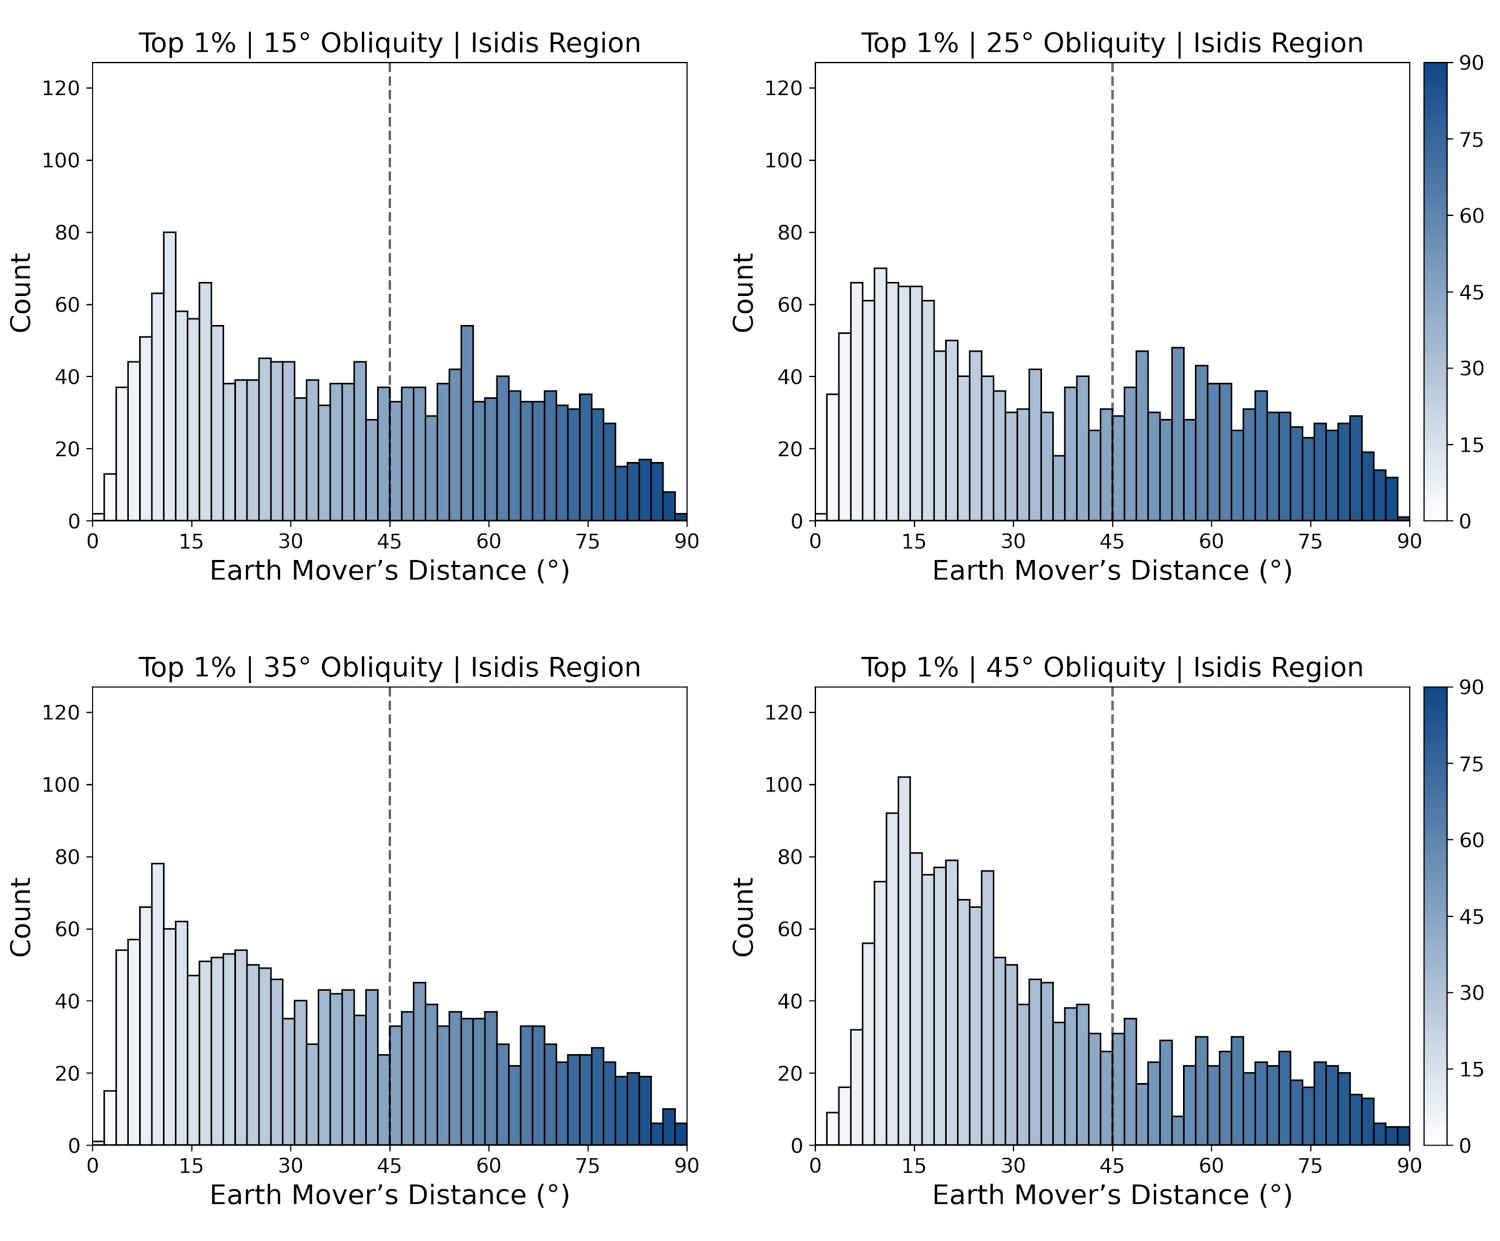
The distribution of TAR forming wind vectors within each HiRISE image was compared to simulated wind regimes from a Global Circulation Model (GCM)6. Obliquity scenarios representing the most prevalent conditions during the last twenty million years were simulated. Agreement to the TARs was quantified using Earth Movers Distance (EMD)7, a metric of dissimilarity between histograms. The higher the EMD the more dissimilar the distributions, to a maximum of 90°.

Figure 2: EMD (°) comparing the distribution of modern GCM wind vectors to TAR forming winds. Each point represents all TAR orientations in a single HiRISE image. White = close match (low EMD), blue = poor match (high EMD). A central low EMD region starts in Syrtis Major and covers the northern part of Isidis and most of Elysium Planitia. There are poorer matches on the Dichotomy Boundary, and in Utopia Planitia.

Several regions exhibit directional stability across all scenarios, suggesting that peak wind vector is not sensitive to obliquity in these areas. In most such regions, the modelled results are always a good match for TAR orientations, suggesting that conditions here have consistently favoured TAR formation throughout the geological history of Mars. Some regions never show alignment between the observed TARs and modelled wind vectors. This occurs most in regions where TAR populations are topographically controlled.

Figure 3: EMD (°) comparing high obliquity GCM wind vectors to the distribution of TAR forming winds. Low EMD values occur across the study area. Utopia Planitia matches much better in this scenario, although high EMD remains in some scattered regions.

In regions where simulated wind vectors diverge strongly between obliquity scenarios, such as Utopia Planitia, observed TAR orientations are most consistent with formation under a high obliquity scenario with axial tilt of 45° (fig 3) and a tropical ice reservoir. 15°, 25° (fig 2), and 35° obliquity scenarios showed a poor match to TAR orientations in these high variance regions, as did a GCM run simulating the known conditions during Mars Year 35.

Figure 4: Histograms summarising EMD for four climate scenarios in the Isidis Region. They show the minimum EMD between TAR forming and GCM modelled wind vectors for the top 1% of modelled wind speeds (i.e. the peak winds). All climate model scenarios exhibit a peak at 10-15°, where stable areas yield a good match to the TARs. This peak is largest in the 45° obliquity scenario, which also shows the fewest sites with an EMD above the 45° threshold for acceptable correspondence between modelled and observed wind vectors.

The most recent 45° obliquity excursion occurred 5.5 million years before the present8. TARs in the high variance regions were likely last active at this time. It is plausible that TARs in low variance regions also formed at this time. However, since their wind vectors remain consistent through most obliquity excursions, TAR formation at a later time cannot be ruled out.

[1] Balme et al., 2008, Geomorphology; [2] Bridges et al., 2013, Aeolian Research; [3] Barrett et al., 2026, Icarus; [4] McEwen et al., 2007, JGR Planets; [5] Smith et al., 2001, JGR Planets; [6] Holmes et al., 2020, PSS [7] Rubner et al., 1998, Sixth International Conference on Computer Vision;; [8] Laskar et al., 2004, Icarus.

How to cite: Barrett, A. M., Balme, M. R., Favaro, E. A., Rajendran, K., Woods, M. J., Elsarky, L., Malinowski, M., Holmes, J. A., Foley, L.-A., and Patel, M. R.: Transverse Aeolian Ridges on Mars: A geomorphic marker for past climate regimes., Europlanet Science Congress 2026, The Hague, The Netherlands, 7–11 Sep 2026, EPSC2026-233, https://doi.org/10.5194/epsc2026-233, 2026.

14:30–14:42
|
EPSC2026-1301
|
ECP
|
On-site presentation
Rick Roodenburg and Daan Beelen

This study investigates whether the geometry of Martian barchan dunes can be used to estimate sediment flux, migration rates, and local wind conditions. Time-separated HiRISE imagery from five Martian dune fields was analyzed to measure dune geometries and crest displacements over multi-year timescales. From these measurements, migration rates and sediment volume fluxes were derived for 214 dunes across 5 dunefields.

An analytics terrestrial dune migration model was adapted to Martian environmental conditions by incorporating Martian values for gravity, atmospheric density, sediment density, grain size, and transport efficiency. Relationships between dune geometry, migration rate, sediment flux, and wind shear were subsequently predicted and validated with measurements.

The results show a positive correlation between stoss-side gradient and volume flux across all investigated dune fields. These relationships are consistent with trends previously observed for terrestrial barchan dunes, indicating that similar geometric controls on dune migration operate under Martian conditions. However, Martian dunes exhibit sediment fluxes approximately one order of magnitude lower than terrestrial dunes with comparable stoss-side gradients, reflecting the influence of Mars’ distinct atmospheric and gravitational environment.

Migration rates predicted from dune geometry reproduce the observed order of magnitude of dune movement, despite significant scatter for individual dunes caused by slow migration rates, limited measurable displacement, and uncertainties in environmental parameters. Using the derived sediment fluxes and dune geometries, local wind shear conditions were additionally estimated, suggesting that orbital dune observations may be used as proxies for atmospheric forcing on Mars or other planets.

How to cite: Roodenburg, R. and Beelen, D.: Predicting migration rates and windspeeds from Martian barchan dune geometries, Europlanet Science Congress 2026, The Hague, The Netherlands, 7–11 Sep 2026, EPSC2026-1301, https://doi.org/10.5194/epsc2026-1301, 2026.

Flow Impact on Landscape
14:42–14:54
|
EPSC2026-761
|
ECP
|
On-site presentation
Sharissa Thompson, Frances Rivera-Hernández, and Jacob Adler

Introduction: Several recent studies have investigated how laboratory analog, Mars sediment flow experiments would be influenced by the extreme surface conditions on Mars, with low pressure and temperature affecting morphology and sedimentology in ways not seen on Earth [1,2,3,4,5,6,7,8]. With low pressures, greater length-to-width ratios (L:W), vug quantity, levee height, and roughness are observed in the morphology, and more convoluted bedding is observed in the sedimentology. These differences are mainly due to vaporization (boiling) at low pressures, which leads to several key processes: levitation via the Leidenfrost effect, grain sputtering, and evaporative cooling. While these studies explored pressure effects on sediment flows, one question that has not been addressed is the magnitude of these effects for basaltic sediment flows with lower sediment-to-water ratios and varying grain size, which is the focus of this study. In this study, we demonstrate how water content and grain size affect deposit morphology and stratigraphy under present-day, Mars-relevant pressures (~ 7 mbar). 

Methods: We performed sediment transport experiments of basaltic sediments at present-day Mars average pressures (7-mbar) in a pressure chamber at the Open University, U.K. The sediment-water mixtures (blended inside the chamber) were poured onto a 10° inclined test bed of warm (293 K), unconsolidated sand to simulate gravity-driven flows over loose regolith. We systematically varied parameters across 10 experiments, each consisting of basaltic sediments of two grain size regimes mixed with different amounts of deionized water to create a range of sediment:water mixture ratios (30:70, 40:60, 50:50, 60:40, 65:35, and 70:30). We used two basaltic grain size types: a fine-grain basalt sediment sourced from volcanic deposits in British Columbia and a coarse-grain basalt sediment sourced from the Colombia Plateau River Flood Basalt in Washington. For each run, videos were recorded from top-down, front-facing, and 45° side-view angles to document the morphological evolution of the flows along the test bed. Final deposit morphologies were imaged with a DSLR camera, and digital elevation models (DEMs) were created using a standard Structure-from-Motion photogrammetry workflow in Agisoft Metashape. We also collected cross-sectional images for stratigraphy using a cell phone camera to measure longitudinal flow thickness and bedding geometry, and used a Mastersizer 3000 to measure grain size and sorting trends with grain size distribution data.

Results: At 7 mbar, water content had a greater effect on deposit morphology and stratigraphic characteristics. As water content increases, trends differ in the two grain-size regimes. Fine-grained flow deposits show more constant increases. In contrast, coarse-grained deposits show less constant, step-wise increases. Higher water content causes L:W values to increase for fine-grained sediments and slightly decrease for coarse-grained sediments. The number of lobes generally decreases as water content increases for both sediment types. While vug quantity and levee height increase for both sample types at higher water content. These variations result from different magnitudes of low-pressure processes. We observed bubbling and vaporization in both basaltic sediments for all sediment-to-water ratios. Levitation (the Leidenfrost effect) decreased as water content dropped in both sample types. Grain sputtering also decreased as water content decreased. In general, as water content decreases, the magnitude of low-pressure processes declines. This decline yields flow deposits with shorter runout distances, more lobes, fewer vugs (pits), smaller levees, and lower roughness values.

We also observe stratigraphic characteristics trends, such as bedding thickness and geometry, median grain size, and sorting, across increasing water content for two grain-size regimes. We did not observe any systematic trends in bedding thickness and geometry with water content and grain size. However, we did observe trends in the grain-size distribution of the flows. As water content increases, the median grain size and sorting level increase for both grain-size types. This reflects greater vaporization with higher water content. Downslope trends occur only for low-water-content flows, for which we observe an increase in median grain size and sorting further downslope. The increase in median grain-size and sorting is greater for CGB flows than for FGB flows.

Conclusion: Results from this study provide a framework for characterizing martian sedimentary deposits and landforms that formed under varying water and sediment availability conditions at present Mars-relevant pressures. Results indicate that we can distinguish between flows with low and high water volumes. With higher water content, we expect more pronounced processes, such as vaporization, that impact surface morphology (i.e.,higher L:W, vug quantity, and levee height) and vice versa for lower water content. Additionally, sediment grain size can influence some morphological characteristics; for example, vug quantity is consistently higher in fine-grained deposits than in coarse-grained deposits. However, for some stratigraphic characteristics, we also observe no prevailing trend in bedding geometry and thickness across the various water contents and sediment types tested, whereas smaller-scale changes are evident in grain-size distributions (i.e., median and sorting values).  Ultimately, this work establishes usable constraints on how we can detect current water availability on Mars. While we expect flows to be affected by low-pressure processes regardless of other factors, the extent to which these pressures affect flow deposits will vary with regolith characteristics, such as water content and grain size.

References:

[1] J. B. Adler et al., (2025)  Commun Earth Environ, vol. 6, no. 1, p. 841

[2] P. Brož et al., (2020) EPSL, vol. 545, p. 116406

[3] P. Brož et al., (2020) Nat. Geosci., vol. 13, no. 6, pp. 403–407

[4] M. Massé et al., (2016) Nature Geosci, vol. 9, no. 6

[5] S. J. Conway et al., (2011) Icarus, vol. 211, no. 1, pp. 443–457

[6] J. Raack, et al., (2017) Nat Commun, vol. 8, no. 1, p. 1151

[7] C. Herny, et al.,  (2019) Geological Society, London, Special Publications, vol. 467, no. 1, pp. 373–410

[8] A. S. Bargery, et al., (2010) Icarus, vol. 210, no. 1, pp. 488–506

How to cite: Thompson, S., Rivera-Hernández, F., and Adler, J.: Impacts of water volume and sediment characteristics on deposit morphology and stratigraphy as records of Amazonian flows on Mars, Europlanet Science Congress 2026, The Hague, The Netherlands, 7–11 Sep 2026, EPSC2026-761, https://doi.org/10.5194/epsc2026-761, 2026.

14:54–15:06
|
EPSC2026-128
|
ECP
|
On-site presentation
Ondřej Krýza, Petr Brož, Věra Pěnkavová, Jaromír Havlica, Mária Zedníková, Zoe Emerland, Manish Patel, and Matthew Sylvest

Mars's present-day surface lies at an average atmospheric pressure of ~6 mbar, close to the triple point of water — a regime in which any exposed liquid water rapidly boils, evaporatively cools, and may freeze [1-4]. Similar metastable conditions may also have occurred episodically on ancient Mars, even if atmospheric pressures were locally or temporarily higher than today. These coupled phase transitions fundamentally alter water's ability to entrain and transport sediment relative to terrestrial conditions, yet they remain poorly constrained as a function of both pressure and grain size. Reconstructing Mars's surface evolution requires closing this gap, because early Mars likely sustained higher atmospheric pressures under which water could persist in a metastable, boilable state for substantially longer, with correspondingly different transport efficiencies.

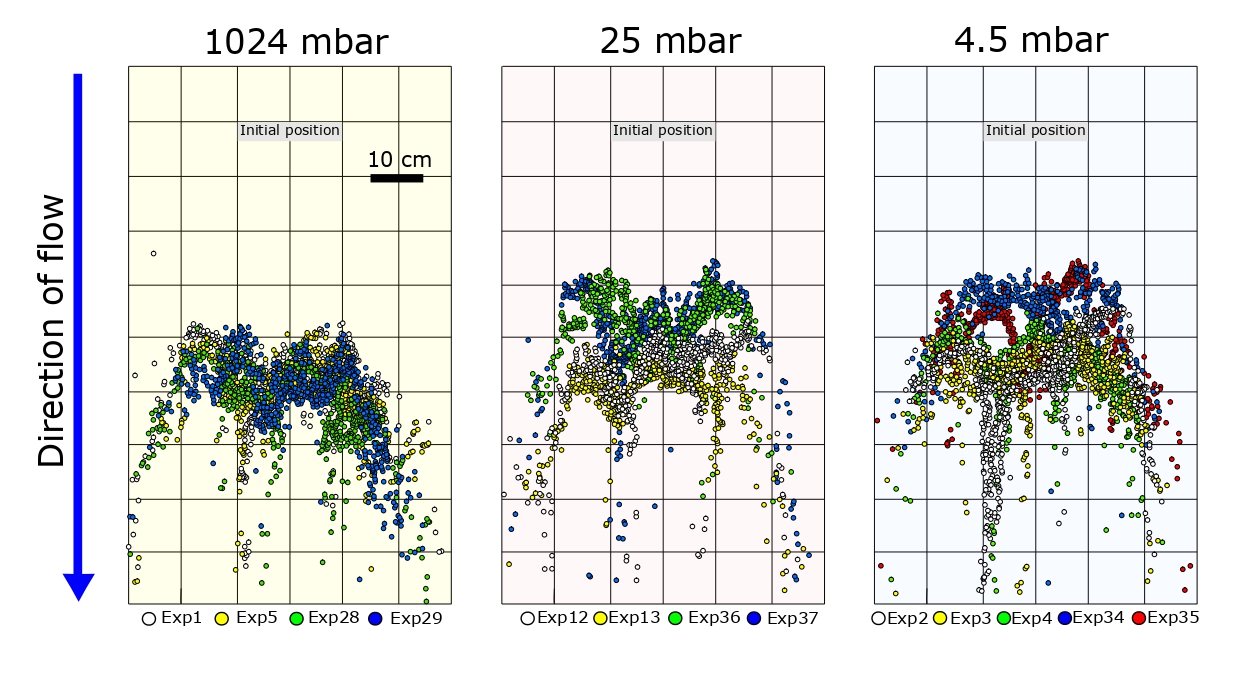
Here, we present laboratory experiments that quantify how water instability modulates sediment transport across the relevant Martian pressure range, with a focus on phase-transition effects on millimetre-sized grains. Water is released onto a shallow inclined metal plate within a low-pressure chamber, producing a thin sheet-flow regime that mimics downslope transport by transient liquid films — a process invoked for a range of Martian slope features. Calcite grains (2–4 mm) serve as the test sediment, and runs span terrestrial reference conditions (1024 mbar), the liquid–vapor phase transition near 25 mbar (T ≈ 21 °C), and two reduced pressures (25 and 4.5 mbar) under which water is unstable. Selected pressures were chosen to account for the uncertainty of atmospheric conditions during the Amazonian period. In addition, the tests focused on pressures near the threshold where water shows significant signs of instability. Transport efficiency was quantified using grain runout distance, transport area, bulk velocity data, and grain-density distributions derived from image analysis of repeated experimental runs performed under identical boundary conditions. 

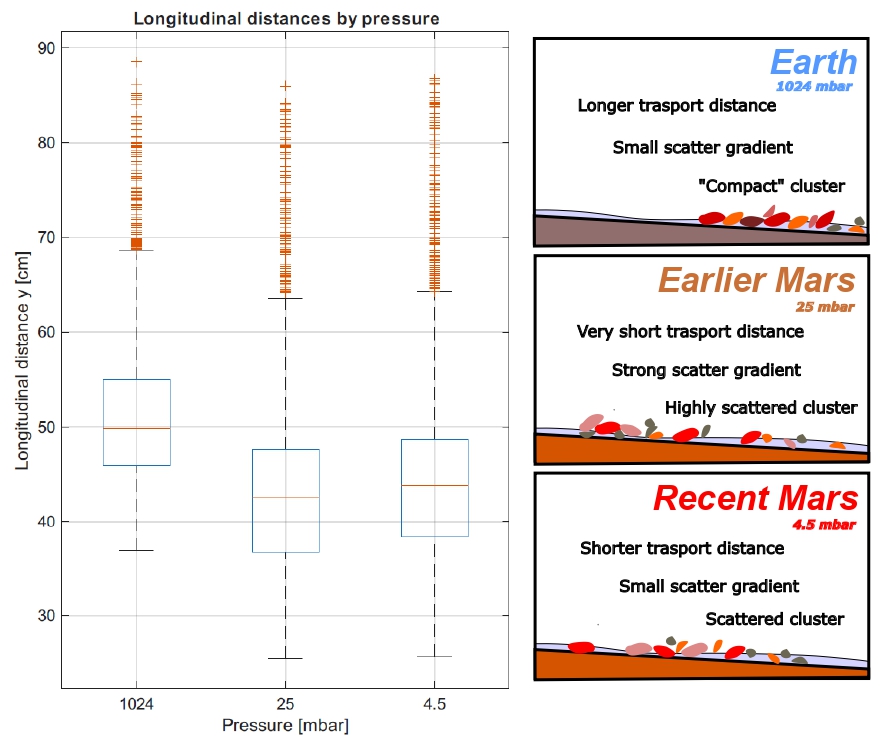
We find that transport efficiency for these larger grains is reduced at both low-pressure conditions relative to the terrestrial reference, but the two regimes are physically distinct (Fig. 1, 2) and the response with decreasing pressure is non-monotonic. Near the phase-transition pressure (~25 mbar), transport reaches its lowest efficiency: vigorous bubble nucleation and growth within the sheet disrupt the flow, and grain dispersal becomes asymmetric and chaotic, with strong run-to-run variability. The experiments show that boiling-induced flow destabilisation dominates sediment transport under these intermediate pressures.  At the lowest tested pressure (~5 mbar), the behaviour shifts qualitatively. Rapid evaporation cools the water and partially stabilises it — slowing the flow but suppressing the violent bubbling characteristic of the 25 mbar regime — so that grain transport partially recovers and proceeds in a more coherent, reproducible manner, though still well below terrestrial efficiency. The dominant control thus migrates from boiling-driven flow disruption near the phase transition to evaporation-driven cooling and partial flow stabilisation at lower pressures (Fig. 2).

Figure 1: Results of experimentalruns conducted at pressures of 1024 mbar (4 experiments), 25 mbar (4 experiments), and 4.5 mbar (5 experiments). Each point represents the final position of a calcite grain, with the initial grain accumulation indicated by the shaded rectangle. Different colors of points correspond to individual experiments, allowing comparison between runs.

Critically, this pattern for 2–4 mm grains is opposite to the behaviour reported in previous experiments on sub-millimetre particles, where boiling-enhanced ejection can locally enhance transport [5]. Together, these results imply a grain-size threshold across which the net effect of water instability on transport reverses sign — a finding with direct consequences for how grain populations are sorted, redistributed, and ultimately deposited on Martian slopes.

Figure 2: Box-plot diagrams (left panel) showing the longitudinal transport distances reached by individual grains as a function of driving pressure. A minimum transport distance is recorded at 25 mbar, with a slight recovery at 4.5 mbar reflecting partial restoration of transport efficiency. The grain deposit geometry is interpreted in terms of transport regime (right panel), spanning conditions from stable (1024 mbar) to highly unstable (25 mbar) water flow. 

Our results provide quantitative constraints on sheet-flow sediment transport under both past and present Martian atmospheric pressures, advancing understanding of sediment dynamics in low-pressure, low-gravity environments. They also underline a broader caution: terrestrial analog studies cannot be straightforwardly extrapolated to Mars, because the coupling between water-phase behaviour and grain size produces transport regimes with no direct Earth equivalent. Interpreting morphological evidence for past liquid-water activity on Mars therefore requires explicit accounting for the metastable-water regime in which any such activity must have unfolded.

References

[1] Hecht et al. (2002), Icarus, 156, 373–386 [2] Bargery et al. (2010), Icarus, 210, 488–506

[3] Brož et al., 2025, EPSL, [4] Patočka et al., 2026, EPSL. [5] Conway et al., 2011, Icarus, 211(1), 443-457 

How to cite: Krýza, O., Brož, P., Pěnkavová, V., Havlica, J., Zedníková, M., Emerland, Z., Patel, M., and Sylvest, M.: Effect of Unstable Water Flow on Grain Transport: Insights from Laboratory Experiments under Reduced Atmospheric Pressure, Europlanet Science Congress 2026, The Hague, The Netherlands, 7–11 Sep 2026, EPSC2026-128, https://doi.org/10.5194/epsc2026-128, 2026.

15:06–15:18
|
EPSC2026-809
|
On-site presentation
Maarten Kleinhans and Edgar Steenstra

Sinuous channels on the terrestrial planets indicate formation by a fluid. One of the longest continuous channels in the solar system, measuring over 7000 km, is Baltis Vallis on Venus (Fig. 1, Baker et al. 1992, Bray et al. 2007). The sinuous nature of this and many other channels has been used to infer formative conditions in the past through comparison of channel and bend geometry with meandering rivers on Earth and lava channels on Earth and the Moon. The viscosity of the flow is inferred to determine meander properties (Baker et al. 1992). In particular, the radius of curvature increases faster with wavelength for lava channels and rilles on Earth, Venus and Mars than for aqueous channels on Earth and Mars (Bray et al. 2007). This data has been used to infer the viscosity of lava flow on Venus and the formative mechanism of channels such as Baltis Vallis. However, these inferences are based on outdated concepts of meandering rivers on Earth, while the processual analogies between collapsed lava tubes, erosional lava flows and meandering rivers are weak at best. Here we develop testable hypotheses from existing theories and a preliminary design of landscape experiments (analogue models) to test such hypotheses based on earlier channel-forming and meandering experiments.

Recent work on river meandering (see for review Kleinhans et al. 2024) shows that a meandering channel shows evidence of lateral migration, whereas a sinuous channel does not. Meandering channels, such as also found on Mars, erode outer-bend banks, which is matched by sedimentation on the inner bank such that the channel maintains an approximately constant width over a large length. Moreover, the wavelength of the meanders, while highly variable, is correlated with channel width. This is explained by physics-based theory for bar and bend formation as a function of channel width-to-depth ratio, as data compared to numerical models and landscape experiments demonstrate (Kleinhans et al. 2024). Finally, some protection against cutoff through the inner bend is required, which can be any form of apparent cohesion, such as caused by vegetation, mud, permafrost or something else. The absence of any evidence of lateral migration in Baltis Vallis indicates that meandering mechanisms do not explain the bends. We must therefore turn to different mechanisms that can form sinuous channels.

Lava tubes and eroding lava both require a fluid, perhaps even turbulent flow. Moreover, explaining the bends requires either a mechanism analogous to the nonlinear sediment transport processes in meandering rivers that lead to bar and bend growth and cutoff, or a certain topographic or subsurface variability on the planetary surface in which a flow path is formed. To start with the first: there are currently no theories known that can explain lateral ‘bar’ in stability in a flow that is much more viscous than water. Moreover, this would require much wider and shallower channels than found on Venus. Our earlier experiments demonstrate several different options, such as nonlinear erosion by a flow which forms irregular bends (Marra et al. 2014) or selection of a non-random path by a flow where its momentum determines the sharpest bends that are taken around the topographic or subsurface variability (Kleinhans et al. 2009).

This brief sketch of theory and reasoning leads to a first design of experiments enabling testing of formation of bends by viscous flows in analogue models in the laboratory. First, the flow must either contain a variation of particle sizes or be turbulent for bed erosion to occur. Second, the flow must be so viscous, or dense, that its width-to-depth ratio is lower than in meandering rivers. Our work on debris flow experiments shows that this can be accomplished with poorly sorted sediments and water. Alternatively, a flow path forms by fluidization within a plain of static but otherwise the same material. Pilots show that this can be accomplished with hyperconcentrated flows in low-density plastic materials. Third, the flows cannot be strong enough to erode outer banks. This is the most critical point. If successful, experiments with provide morphological indications of flow-bank interactions with different mechanisms, ultimately allowing evidence-based inference of channel-forming conditions on Venus.

Figure 1. A 300 km segment of Baltis Vallis showing a sinuous channel in north-eastern direction. The channel is about 2 km wide. Topographic gradient is from left to right. Source: Magellan radar data, contrast-enhanced for visualization. 

Funded by NWO grant 19823

References

Baker, V. R., G. Komatsu, T. J. Parker, V. C. Gulick, J. S. Kargel, and J. S. Lewis (1992), Channels and valleys on Venus: Preliminary analysis of Magellan data, J. Geophys. Res., 97(E8), 13,421– 13,444.

Bray, V. J., D. B. J. Bussey, R. C. Ghail, A. P. Jones, and K. T. Pickering (2007), Meander geometry of Venusian canali: Constraints on flow regime and formation time, J. Geophys. Res., 112, E04S05, doi:10.1029/2006JE002785.

Kleinhans, M.G., Schuurman, F., Bakx, W. and Markies, H. (2009). Meandering channel dynamics in highly cohesive sediment on an intertidal mud flat in the Westerschelde estuary, the Netherlands. Geomorphology, 105, 261–276, https://doi.org/10.1016/j.geomorph.2008.10.005

Kleinhans, M.G., McMahon, W.J. and Davies, N.S. (2023), What even is a meandering river? A philosophy-enhanced synthesis of multi-level causes and systemic interactions contributing to river meandering. Geological Society, London, Special Publications 540, https://doi.org/10.1144/SP540-2022-138

Marra, W. A., Braat, L., Baar, A. W. and Kleinhans, M. G. (2014), Valley formation by groundwater seepage, pressurized groundwater outbursts and crater-lake overflow in flume experiments with implications for Mars. Icarus 232, 97-117, http://dx.doi.org/10.1016/j.icarus.2013.12.026

How to cite: Kleinhans, M. and Steenstra, E.: The sinuous Baltis Vallis on Venus: potential mechanisms of formation and design of an analogue model, Europlanet Science Congress 2026, The Hague, The Netherlands, 7–11 Sep 2026, EPSC2026-809, https://doi.org/10.5194/epsc2026-809, 2026.

Planetary Geodynamics
15:18–15:30

Posters: Thu, 10 Sep, 18:00–19:30 | Foyer 2

Display time: Thu, 10 Sep, 08:30–19:30
Chairpersons: Zach Dickeson, Sharon Diamant, Lisanne Braat
F2.42
|
EPSC2026-60
|
On-site presentation
Heng Zhang

Yigong Lake, formed by a landslide in 1900, remained stable until a second landslide in 2000 breached the dam, causing significant economic losses and devastating downstream disasters. Located in the active convergence zone of Tibetan Plateau, the lake's shallow structure is crucial for assessing geohazards and advancing research on sedimentation and geodynamics. This study uses Distributed Acoustic Sensing (DAS) technique to image the lakebed sedimentary layers. By deploying fiber-optic cable, including 725 meters buried beneath the lakebed, we identified three layers: a uniform upper layer of unconsolidated sediments, a laterally thickening middle layer with variable compaction and deposition from multiple processes, and a deepest layer with relatively low velocities, compacted sediments reaching depths of 110 meters but not extending to bedrock. Forward modeling confirmed the accuracy of our results, providing valuable insights into landslide-dammed lake dynamics and hazard mitigation, while also demonstrating portable DAS’s reliability in remote, complex environments.

How to cite: Zhang, H.: Revealing lakebed sedimentary history in Yigong Lake, Tibetan Plateau using distributed acoustic sensing, Europlanet Science Congress 2026, The Hague, The Netherlands, 7–11 Sep 2026, EPSC2026-60, https://doi.org/10.5194/epsc2026-60, 2026.

F2.43
|
EPSC2026-361
|
ECP
|
On-site presentation
Arlen Parmentier, Nicolas Mangold, Daniel Cordier, and Gabriel Tobie

Titan is the only known body to possess an active hydrological cycle besides the Earth, involving instead of liquid water hydrocarbons, mostly methane and ethane, and some dissolved nitrogen from the atmosphere [1]. Observations by the Cassini-Huygens mission revealed the presence of hydrocarbons polar lakes, widespread river channels, clouds and rains on Titan [1]. On Earth, rivers transport sediments that can be deposited at the mouth of the rivers, into the lakes or seas, in the form of a river delta [2]. However, despite numerous rivers entering lakes in the polar regions, sedimentary deposits at the mouth of the rivers are almost absent on Titan. Only one delta was identified at Ontario Lacus in the south pole [3], and Birch et al. [4] showed their global scarcity is not due to the Cassini RADAR resolution. If the sediment transport on Titan was similar to that of the Earth, more deltas should be seen. Still, the lack of deltas on Titan is not yet understood. Our work aims to improve the understanding of Titan’s hydrological cycle by investigating the specificities of Titan’s sediment transport and thus the processes that could explain the apparent lack of deltas on Titan.

The presence or absence of deltas on Earth is linked to several processes such as the presence and quantity of river bedload, or effects of waves and tides [5], but also to sea-level variation [6] or density contrasts between the rivers and the lakes or seas [7]. Dissolution of surface material was proposed on Titan’s polar terrains [8], and could also be of effect to dissolve sediments or erode deltas. The identification of one delta and many alluvial fans [3, 9], plus numerical work [10], suggest that transport and deposition of river bedload is possible on Titan. The importance of all processes on the bedload sediment deposition and reworking will need to be assessed. We start by investigating the effects of density contrasts at the river mouth on delta formation on Titan. The river flow is called hyperpycnal when its density is higher than the lake fluid, and hypopycnal when it is the inverse [7]. We begin this study by the case of hyperpycnal flows, for which sediments (both bedload and suspended load) could be transported by the river to the bottom of the lakes, making the sediment deposits invisible to the Cassini RADAR and explaining the apparent lack of deltas on Titan.

To investigate in which conditions hyperpycnal flows may develop on Titan, we first review the mixtures of liquids that could exist at the surface of Titan. A particularity of Titan is that rivers and lakes may not be formed by the same mixture of phases, creating density contrasts at the river mouth, and favoring or not hyperpycnal flows. Lakes [11, 12] could contain less or more ethane than the rain feeding the rivers [13, 14], affecting in return the quantity of dissolved nitrogen [15], and therefore their densities. Considering different end-member composition scenarios, we provide constraints on the density of the river flow and the lake, and discuss the concentration and characteristics (composition, grain size) of the suspended load, that permit the onset of hyperpycnal flows. We also discuss the liquid depth required for the hyperpycnal flows to plunge in the lakes [16, 17], in regard to the bathymetry of Titan’s polar lakes. Together, these results provide new constraints on the conditions required for creating river deltas within lakes on Titan.

References

[1] Hayes et al. In: Nature Geoscience 11.5 (2018), pp. 306–313. issn:1752-0908.
[2] Caldwell et al. In: Earth Surface Dynamics 7.3 (2019), pp. 773–787.
[3] Wall et al. In: Geophysical Research Letters 37.5 (2010).
[4] Birch et al. In: Journal of Geophysical Research: Planets 130.3 (2025), e2024JE008737. issn:2169-9100.
[5] Galloway. In: Society of Economic Paleontologists and Mineralogist (SEPM), Special Publication No. 31 (1975), pp. 127–156.
[6] Nienhuis et al. In: Annual Review of Earth and Planetary Sciences 51.Volume 51, 2023 (2023), pp. 79–104. issn: 1545-4495.
[7] Bates. In: AAPG Bulletin 37.9 (1953), pp. 2119–2162. issn: 0149-1423.
[8] Cornet et al. In: Journal of Geophysical Research: Planets 120.6 (2015), pp. 1044–1074.
[9] Birch et al. In: Icarus 270 (2016), pp. 238–247. issn: 0019-1035.
[10] Birch et al. In: Proceedings of the National Academy of Sciences 120.29 (2023), e2206837120.
[11] Mastrogiuseppe et al. In: IEEE Transactions on Geoscience and Remote Sensing 54.10 (2016),
pp. 5646–5656.
[12] Mastrogiuseppe et al. In: Icarus 300 (2018), pp. 203–209. issn: 0019-1035.
[13] Graves et al. In: Planetary and Space Science 56.3 (2008), pp. 346–357. issn: 0032-0633.
[14] Poggiali et al. In: Nature Communications 15.1 (2024), p. 5454. issn: 2041-1723.
[15] Malaska et al. In: Icarus 289 (2017), pp. 94–105. issn: 0019-1035.
[16] Akiyama and Stefan. In: Journal of Hydraulic Engineering 110.4 (1984), pp. 484–499.
[17] Lamb et al. In: GSA Bulletin 122.9-10 (2010), pp. 1389–1400. issn: 0016-7606.

How to cite: Parmentier, A., Mangold, N., Cordier, D., and Tobie, G.: Constraints on the presence or absence of river deltas on Titan, Europlanet Science Congress 2026, The Hague, The Netherlands, 7–11 Sep 2026, EPSC2026-361, https://doi.org/10.5194/epsc2026-361, 2026.

F2.44
|
EPSC2026-398
|
ECP
|
On-site presentation
Judith Dechavanne, Nicolas Mahoume, Gabrielle Vaugeois, and Anna Grau Galofre

Introduction: 

Identifying and characterizing glacial-lake megafloods is key to understand the rapid evolution of the affected landscapes, and offers us a unique view as to what landform assemblages can be identified in Mars’ outflow channels. Here we provide field and remote sensing-based reconstructions of a megaflood that followed the catastrophic collapse of former glacial lake Argentino in the Santa Cruz province, Patagonia [1,2].

In detail, we (1) identify possible megaflood landforms within the Santa Cruz river from remote sensing data; (2) describe field observations; (3) provide a geomorphological map, and (4) suggest a chronology of events [2,3]. Like the Channeled Scablands, the classical analogue for Mars’ outflow channels [4,5], the Santa Cruz river megaflood provides an interesting analogue to Kasei Valles on Mars, and allows for a generalization to how megaflood landforms distribute themselves. Our work provides geomorphologic support for catastrophic glacial lake drainage events in Patagonia indicating the role that catastrophic floods played in continental-scale palaeohydrology.

Setting:

The Santa Cruz river sources from the glacial lake Argentino (50.2S, 72W), fed from the Southern Patagonian Ice Sheet (SPIS). Over the course of the Quaternary, the lake Argentino has been dammed repeatedly by terminal moraines, of which five sets correspond to distinct glacial Santages: El Tranquilo II (36.6 kyr) and I (44.5 kyr), Arroyo Verde II (176 kyr) and I (age unknown), and the Fructuosa (age unknown) moraine [1], in order of distance along the river (Fig. 1).


Methods:

Our field observations follow provincial routes 9 and 4 along the Santa Cruz river southern border, from the Argentino lake to Condor Cliff (50.2S, 70.8W). Our study zone is defined by this length, and spans from the northern to the southern valley rim. Field observations include stratigraphy, landform granulometry, relief, flow direction, and local chronologic relationships.

Remote sensing observations use image data from Maxar (30 cm/px) available in ArcPro, and topographic data, available in open format from the government of Argentina. To identify megaflood-related landforms we used analogies with well-characterized forms in the Channeled Scablands [4,5]. We produced a geomorphological map  of the region integrating the field data with the remote sensing data. Our map integrates previous glacial geomorphological data as well as age dates from the diverse river terraces [2,3] into our field and remote sensing observations.

Remote sensing observations:

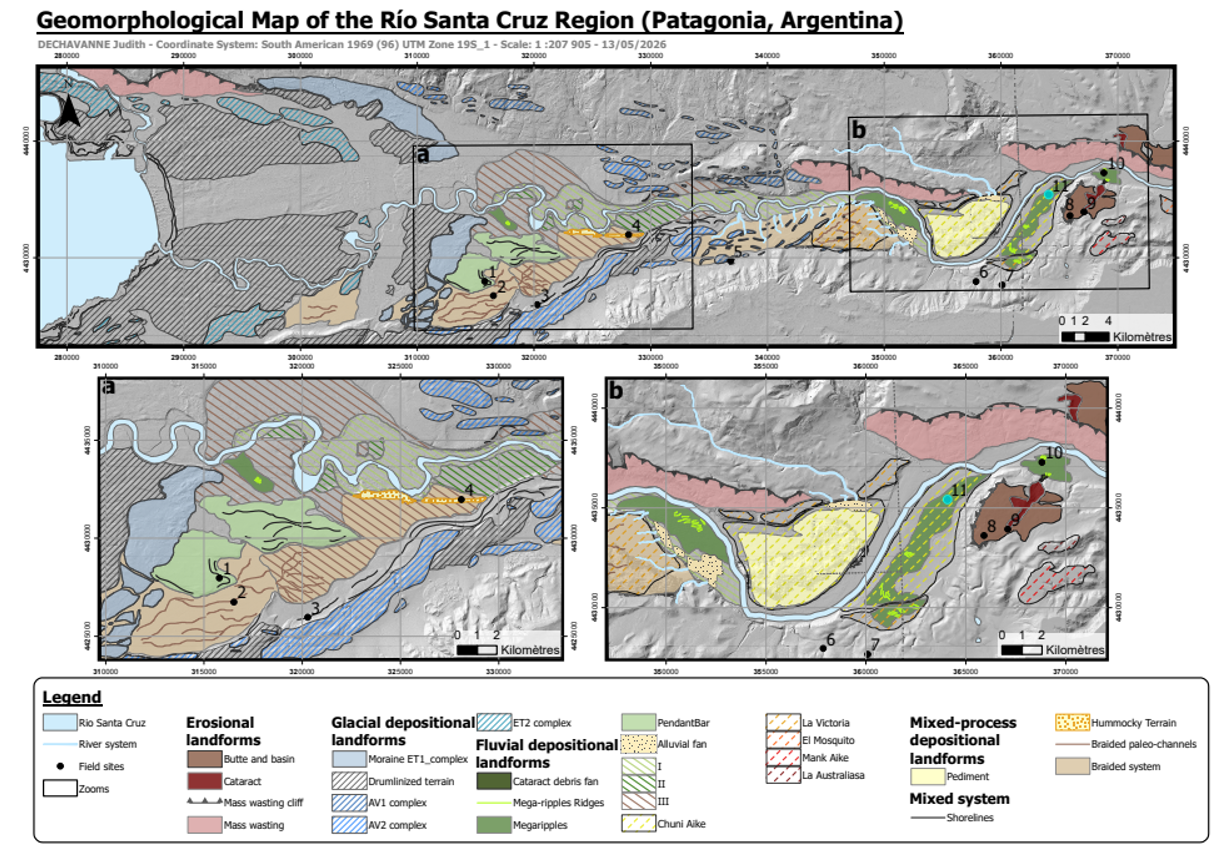
We identified the following megaflood landforms [5] from remote sensing data (Fig. 1):

Megaripples – Mesoscale (~100m wavelength) ripple deposits found transverse to paleoflow direction with granulometry consisting of cyclic gravel, sand, and clay [5].

Longitudinal bars: Streamlined hill macro deposits composed of sand, gravel, and boulders, elongated along flow direction [5].  

Butte and basin topography: small reticulate channels and potholes surrounding buttes and mesas, carved into basaltic bedrock [5]. This landform was carved by steady giant eddies (kolks).

Coulees/ Cataracts: large, steep-walled, theatre-shaped dry canyons, which acted as spillways and flood channels of the overall scabland plexus [5].

Field observations:

Field sites are shown in Fig.1, numbered from 1-11 (landforms). Sites 1-3 targeted a longitudinal bar and its geomorphological context. From bottom to top (~70m), granulometry evolved from sand and loess to gravel and boulders, alternating cyclically upwards. Sites 8-9 were located at the top a ~200m thick basaltic flow incised by potholes and reticulate depressions, leading into a theatre-shaped, dry fall canyon hanging over, and draining into the Santa Cruz river (site 9). Sites 10-11 target cyclic bedforms with wavelengths ~70-90m, displaying changes in granulometry ranging from rounded gravels at the crests to silt and sand in the troughs. Bedform relief is submetric. Sediment deposits delivered from the canyon were both overlying and entrained in these forms. We interpreted sites 1-3 as a longitudinal bar, site 8 as butte and basin topography, site 9 as a cataract/coulee, and sites 10-11 as megaripples.

Fig.1 Geomorphological map of the study region (top) and two zoomed insets in zones (a) and (b).  

We visited 5 road cuts, of which we describe site 3 (Fig. 1). This cut displays a stratigraphy consisting of a massive basal silt deposit with evidence for deformation. We interpret this as a glaciotectonized, glaciolacustrine unit. Separated by an erosional unconformity, we find a horizontal 1-2m thick layer consisting of meter-scale well-rounded boulders, with long-axis pointing downvalley. The matrix is supported by well-rounded gravel and smaller boulders. Conformally overlying this layer we find layers of well-rounded ~30cm boulders, vertically separated by cyclic silt and sand lenses that were not horizontally continuous beyond ~1-2m. We interpreted this outcrop to be megaflood-transported bedload eroding and overlaying a previous glaciolacustrine deposit.    

Discussion and Conclusions:

We next provide chronologic constraints on the timing of this megaflood, based on OSL river terrace dates [3] and Be-10 moraine dates [2]. Megaripples are located in the ‘Chuñi Aike’ river terrace, dated 240 kyr [3]. This age is consistent, within error margins, with the Arroyo Verde II moraines [2], although we cannot discard an Arroyo I event given the lack of age dates.

Our work provides the first complete geomorphological reconstruction and age constrain of the Santa Cruz river megaflood, identifying characteristic megaflood landforms in a different setting than the Channeled Scablands, and offering a clear path of landform assemblages and associations to be expected within Kasei Valles.   

Acknowledgments:

This project has received funding from the European Research Council (ERC) under the European Union’s Horizon Europe research and innovation programme (Grant agreement No. 101165197 ICEFLOODS).

References:

[1] Strelin and Malagnino (2009), Revista de la Asociación Geológica Argentina, 64(1).; [2] Romero et al., (2024) Clim. Past, 20, 1861–1883.; [3] Milanes Fernandez et al., 2025 Geology 54(2), pp.117-122.; [4] Baker and Milton (1974)  Icarus23(1), pp.27-41.; [5] Baker (2009) An. Rev. of Earth and Planetary Sci.37(1), pp.393-411.

How to cite: Dechavanne, J., Mahoume, N., Vaugeois, G., and Grau Galofre, A.: Field evidence for a glacial-lake outburst megaflood in the Santa Cruz River, Patagonia: An analogue for outflow channel formation, Europlanet Science Congress 2026, The Hague, The Netherlands, 7–11 Sep 2026, EPSC2026-398, https://doi.org/10.5194/epsc2026-398, 2026.

F2.45
|
EPSC2026-464
|
On-site presentation
Giulia Magnarini, Joseph McNeil, Roger Stabbins, Peter Grindrod, and Susan Conway and the CaSSIS Science Team

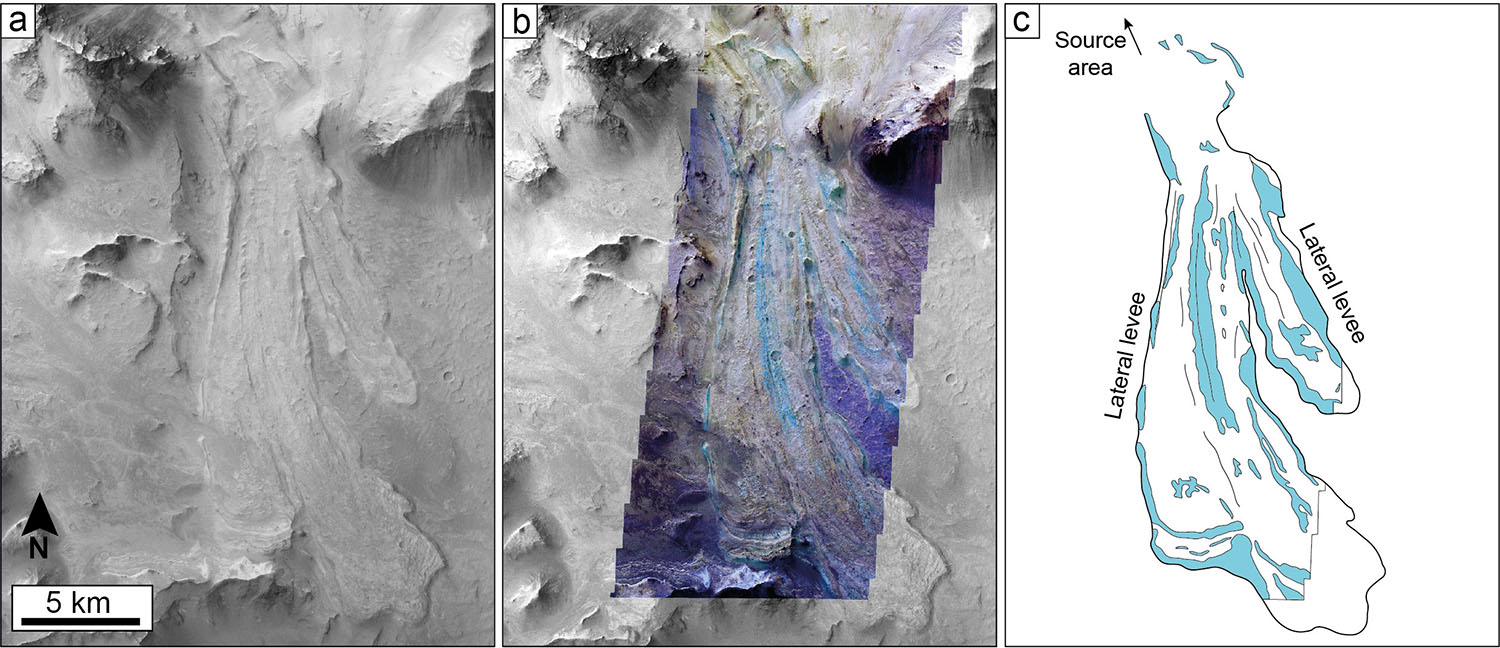
Martian rock-avalanches represent some of the most spectacular instances of highly mobile landslides in the Solar System, and their high level of preservation, combined with availability of high-resolution optical satellite imagery, has been exploited to study both their morphology and morphometry (e.g., Magnarini et al., 2019; Magnarini et al., 2024). The current availability of high-resolution colour images from the Colour and Stereo Surface Imaging System (CaSSIS) multi-spectral camera on board ESA ExoMars Trace Gas Orbiter (TGO) allows us to study the surface unit composition of these well-preserved rock-avalanche deposits. Therefore, using CaSSIS imagery represents a unique opportunity to study the transport and distribution of the debris forming martian rock-avalanche deposits, providing insights into their kinematics.

In analogue experiments of rock-avalanches where materials with contrasting colours were used in the source area, Shea and van Wyk de Vries (2008) were able to trace the deposit units back to their source area and infer the kinematics of the simulated rock-avalanches. In this work, we use a similar approach for the study of rock-avalanches on Mars by using high-spatial-resolution (~4 m/px) colour images from the CaSSIS multi-spectral camera.

We chose six giant, well-preserved, martian rock-avalanches, whose deposits and, where available, headwalls expose units with contrasting colours in CaSSIS NIR-PAN-BLU colour composite images. We mapped the distribution of different units as they crop out on the surface of the deposits. Where possible, we tracked the relative transport from the source area to the deposition.

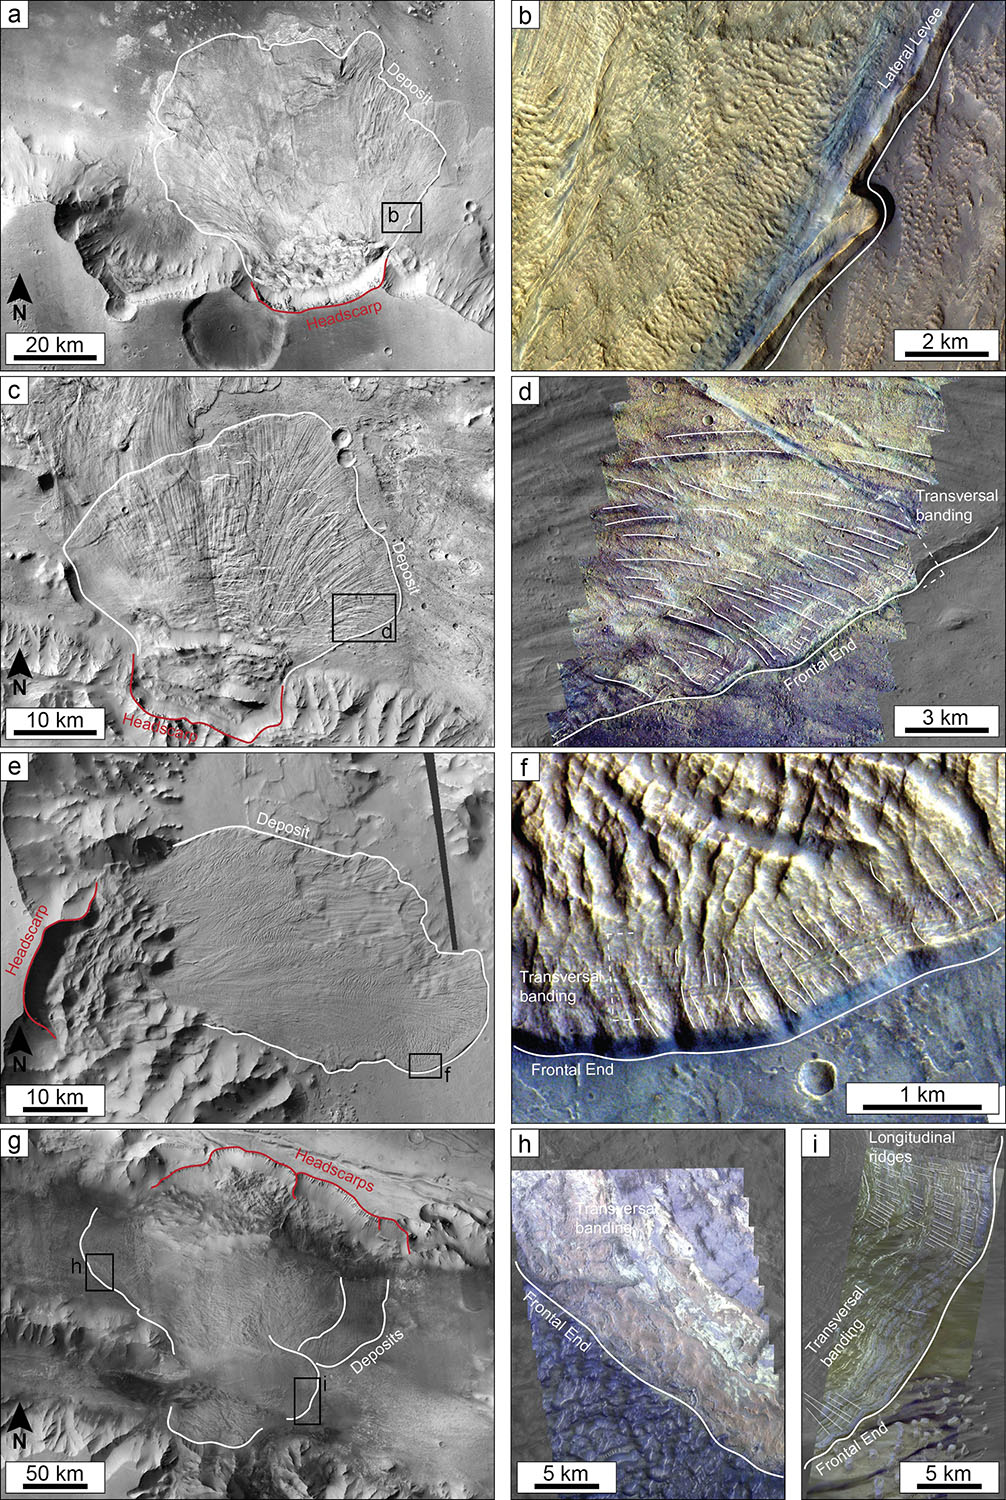
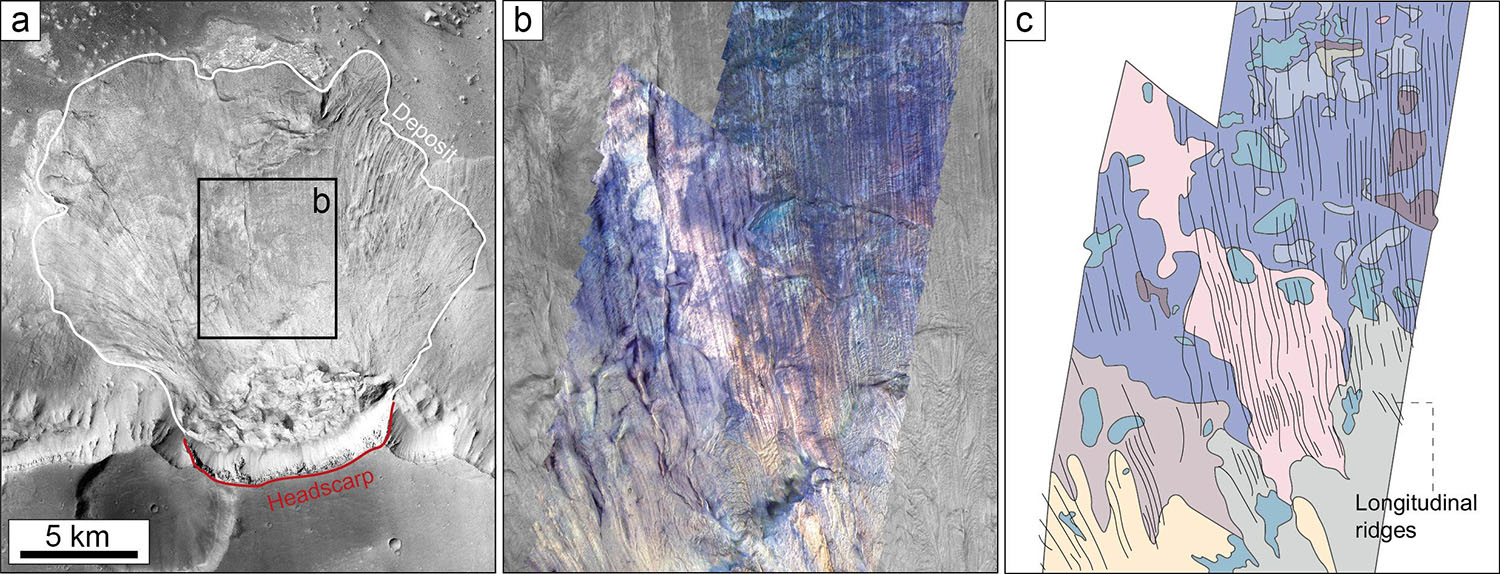
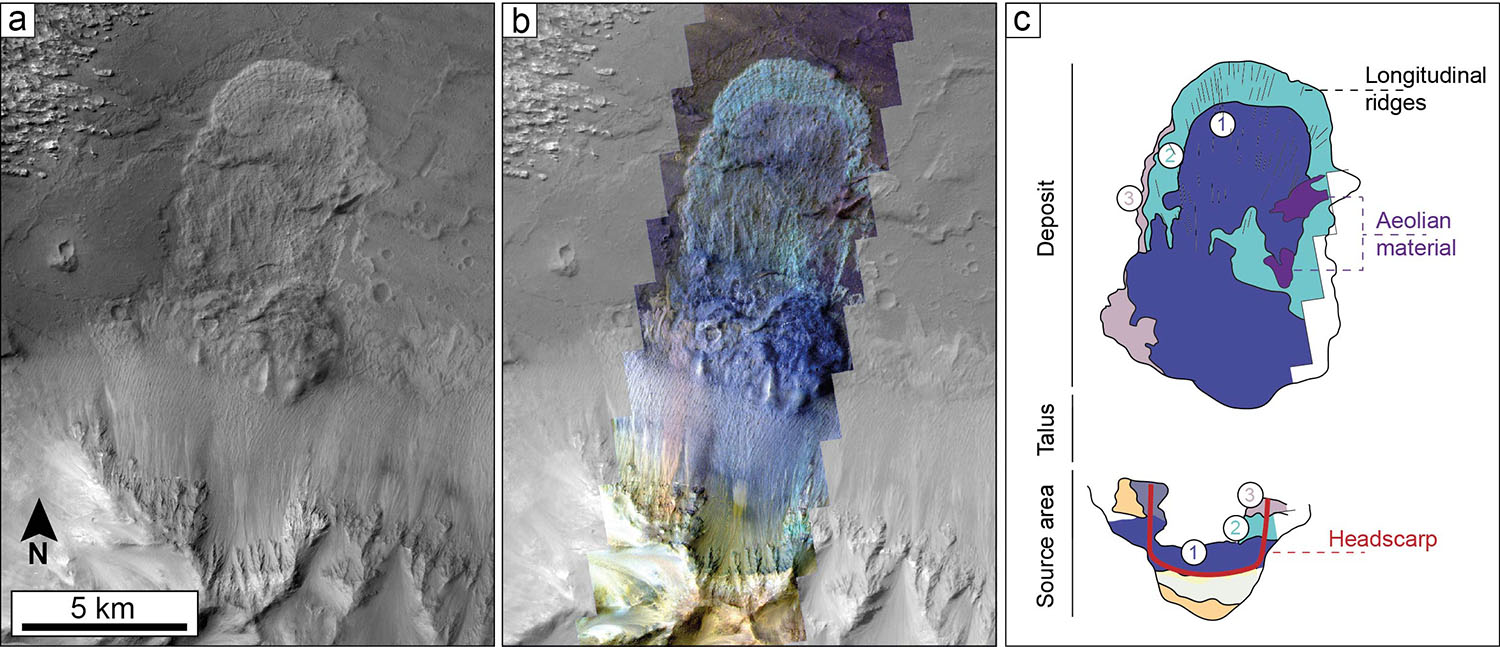
We find different modalities by which the debris is distributed during the emplacement of the rock-avalanches. We describe: 1) a deposit where the stratigraphic order of the lithological units that form the source slope is preserved (Fig. 1); 2) deposits in which specific units are segregated along lateral levees and distinguished from the other units forming the rest of the deposit (Fig. 2 and Fig. 3b); 3) deposits whose distal areas are characterized by transversal banding (Fig. 3d,f,h,i); 4) convolute banding in deposits (Fig. 4); and 5) a lack of relationship between the unit patterns shown in colour and the longitudinal topographic ridges that characterize the surface of several deposits (Fig. 3d,f,i and Fig. 4).

Our investigation of martian rock-avalanche deposits provides novel insights into the kinematics of these catastrophic landslides. Observations demonstrate that rock-avalanches on Mars encompass a diverse suite of kinematics that are reflected by the diverse suite of surface debris distribution patterns and their relationship with morphological features of the deposits. These observations emphasize the complexity of the emplacement of rock-avalanches, suggesting that different mechanisms responsible for their high mobility may exist.

Thanks to the availability of CaSSIS colour imagery, we show that martian rock-avalanches can be approached as field-scale, natural analogue experiments. The critical advantage is that the fundamental property of this type of landslides, which is volume, is not lost because of scale-reduction, which is otherwise inevitable in laboratory experiments. The results from this study can be used to better understand and interpret their terrestrial counterparts.

Figures:

Figure 1 – Rock-avalanche in Central Coprates Chasma, Mars. (a) View of the landslide with CTX imagery. (b) View of the landslide and its headscarp with CaSSIS imagery (image ID MY35_014163_346_0). (c) Map of different rock-avalanche units as they outcrop on the surface of the deposit and at the headwall. The numbers show the three identified units, whose relative stratigraphic order has been maintained from the source area to deposition.

Figure 2 – Rock-avalanche in East Coprates Chasma, Mars. (a) View of the landslide with CTX imagery. (b) view of the landslide with CaSSIS imagery (image ID MY37_029999_344_0); no Cassis image cover the source area. (c) Map of the distinctive turquoise unit consistently found in correspondence of lateral leveed and frontal end of the deposit.

Figure 3 – Examples of segregation of units along lateral levees (b) (CaSSIS image ID MY36_021103_351_0) in a rock avalanche in Ganges Chasma (a). Examples of transversal banding at the terminal part of the deposit in rock-avalanches in West Coprates Chasma (c)(d) ((CaSSIS image ID MY36_014387), in Ganges Chasma (e)(f) (CaSSIS image ID MY36_014436_351_0), and in Ius Chasma (g)(h)(i) (CaSSIS image IDs MY37_026523_188_0 and MY37_022734_349_0). Longitudinal ridges are mapped using thin white lines in (d)(f) and (i), showing a lack of relationship with the unit forming the transversal banding patterns.

Figure 4 – Rock-avalanche in Ganges Chasma, Mars. (a) View of the landslide with CTX imagery. (b) view of the central section of the landslide deposit characterized by extensive longitudinal ridges with CaSSIS imagery (images ID MY38_031504_349_0 and ID MY36_021215_349_0). (c) Map of the distinctive colorful units showing a lack of relationship with the longitudinal topographic ridges that characterize the surface of the deposit (represented by thin black lines).


References:

Magnarini, G. et al. (2019) Longitudinal ridges imparted by high-speed granular flow mechanisms in martian landslides. Nat Commun 10, 4711. https://doi.org/10.1038/s41467-019-12734-0

Magnarini, G. et al. (2014) Long-runout landslides with associated longitudinal ridges in Iceland as analogues of Martian landslide deposits, Earth Surf. Dynam., 12, 657–678, https://doi.org/10.5194/esurf-12-657-2024

Shea, T. and van Wyk de Vries, B (2008) Structural analysis and analogue modeling of the kinematics and dynamics of rockslide avalanches. Geosphere 4, 657–686. doi: https://doi.org/10.1130/GES00131.1

How to cite: Magnarini, G., McNeil, J., Stabbins, R., Grindrod, P., and Conway, S. and the CaSSIS Science Team: Martian Rock-Avalanche Kinematics Revealed by Multi-Spectral Imagery, Europlanet Science Congress 2026, The Hague, The Netherlands, 7–11 Sep 2026, EPSC2026-464, https://doi.org/10.5194/epsc2026-464, 2026.

F2.46
|
EPSC2026-503
|
ECP
|
On-site presentation
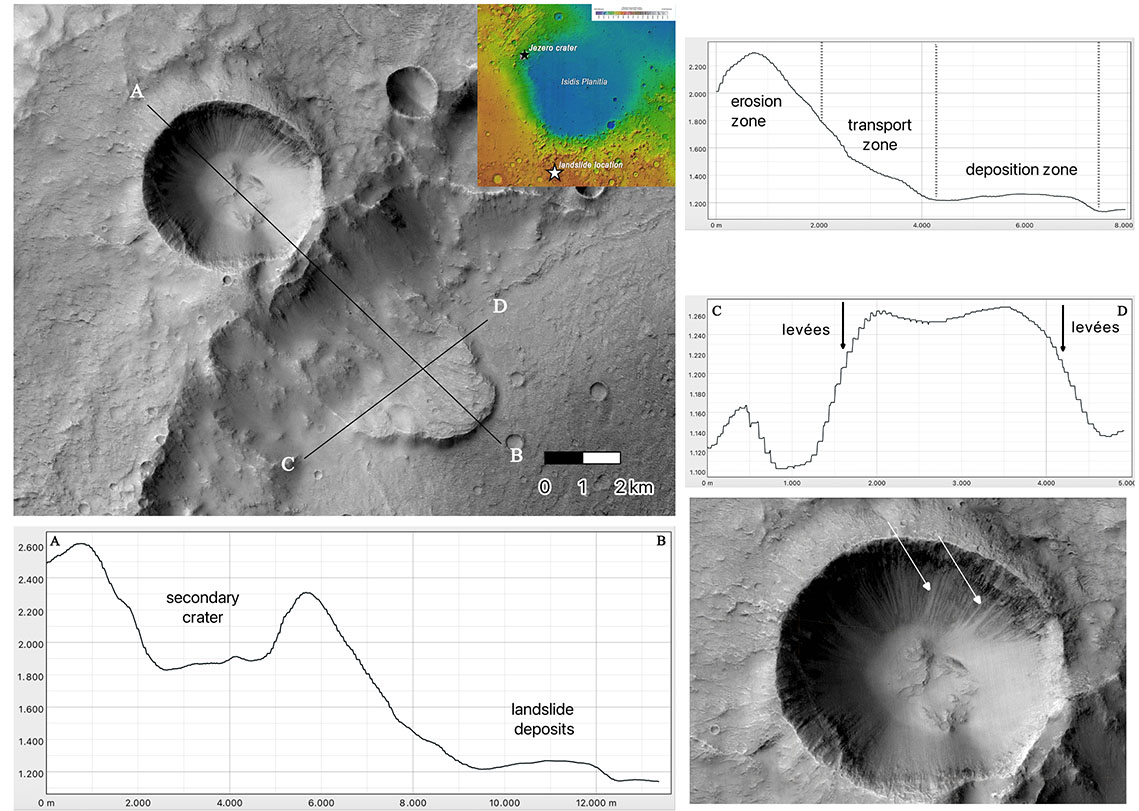
Agnese Caramanico, Luca Lanci, Maria Isabel Herreros, Antonio Molina, Mirko Francioni, and Paolo Stocchi

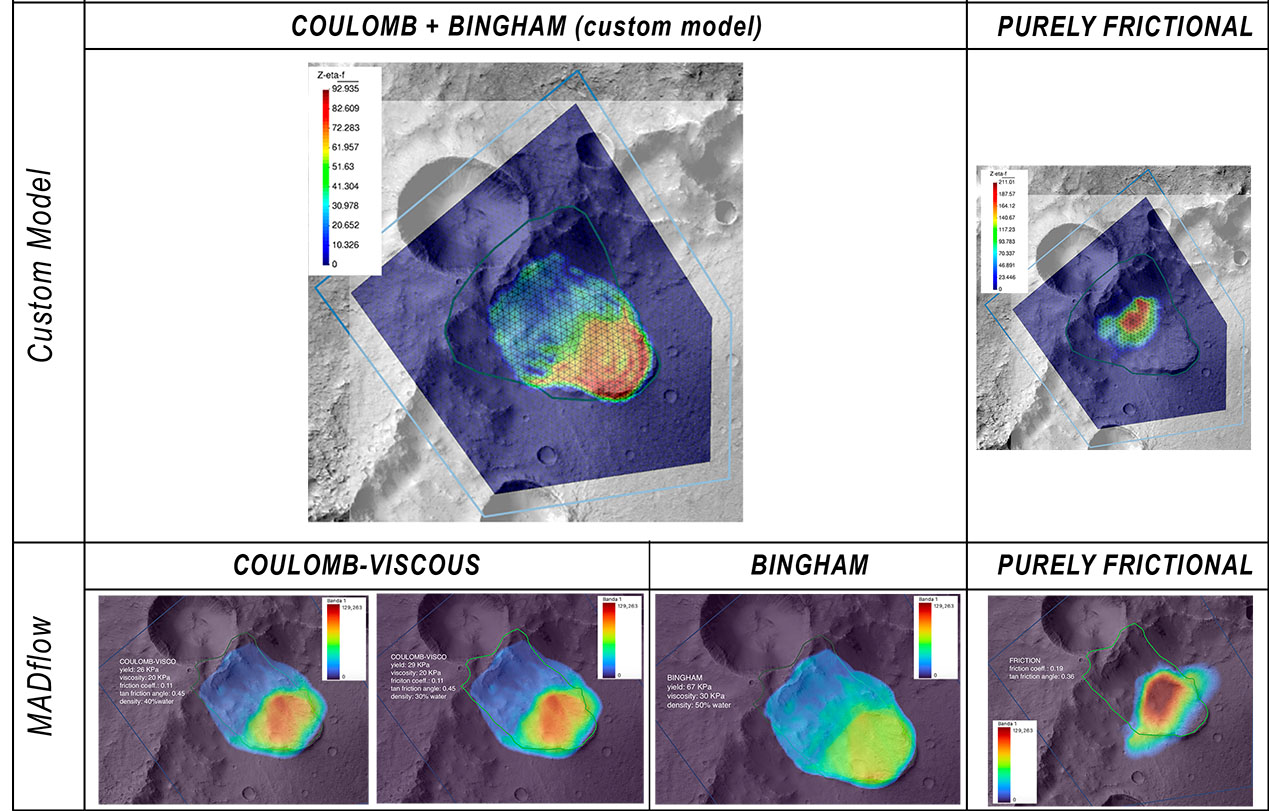
Landslides are common features on the surface of Mars, but the debate regarding their dynamics and the role of water (liquid or frozen) is still ongoing. The low percentage of well characterized landslides on Mars (especially from the mechanical point of view) contributes to the general lack of useful data to solve the issue. Our study provides new data of a ~ 7 km long landslide found in an unnamed impact crater on Noachian highlands (Fig. 1), with the aim to unravel its rheology and mechanical properties.  Numerical modeling approach, based on Chen and Ling (1996) and Chen and Lee (1999), was combined with geomorphological observations performed at CTX (Context Camera) resolution (~ 6 m/px), useful to select the best rheological model to reproduce the characteristic long runout and the lobate shape of the deposits. The reconstruction of pre-event and basal topographies, performed using HRSC (High Resolution Stereo Camera) derived DEM (Digital Elevation Model, up to 10m/px of vertical accuracy), was based on the estimate of the total volume of the landslide (< 1010 m3) and local morphology. To confirm the results of our custom landslide model, we used the commercial software MADflow to model the landslide and compare the best-fit simulations. Crater counting technique was also applied to estimate the age of the landslide and constrain its rheological properties (and the environmental conditions at the time of occurrence) to Mars history.

We found that simulations with a purely frictional model fail to reproduce the observed morphologies of the landslide while the cohesive-frictional, Coulomb-viscous-type rheology produced the best-fit results (Fig. 2). The geological context showed traces of water activity (mineralogy, valley networks, possible “RSL”) in the surroundings of our case study. All these elements highlight the possibility that water may have been involved in the mass wasting phenomenon. 

Fig. 1 : location and altimetric profiles (longitudinal, transversal) of the landslide in the unnamed impact crater; in the bottom right corner, close-up view of some lineations on the wall of a fresh crater on top of the rim of the main one hosting the landslide.


Fig. 2 : summary of simulation results obtained with our custom model and MADflow

How to cite: Caramanico, A., Lanci, L., Herreros, M. I., Molina, A., Francioni, M., and Stocchi, P.: Numerical modeling as a way to assess the mobility and water content in Martian landslides, Europlanet Science Congress 2026, The Hague, The Netherlands, 7–11 Sep 2026, EPSC2026-503, https://doi.org/10.5194/epsc2026-503, 2026.

F2.47
|
EPSC2026-796
|
ECP
|
On-site presentation
Yuna Horie, Cecily Sunday, Seiji Sugita, and Naomi Murdoch

Abstract

This study investigates the influence of grain-scale characteristics, including size, angularity, and bulk density, on the avalanching behavior of two-dimensional granular column collapses on three distinct materials: sand, glass grit, and glass beads. Our results demonstrate that the morphological evolution of the final deposit is fundamentally governed by the initial aspect ratio, a.  A critical regime change of the final deposit was observed at a ~ 0.7 for glass beads and a ~ 1 for angular particles. Scaling laws for the normalized deposit height (Hf/Li) and normalized runout distance ((Lf-Li)/Li) qualitatively follow known power-law behavior. However, our derived exponents indicate a higher sensitivity to the initial aspect ratio compared to previously reported values. These findings suggest that while aspect ratio remains the primary governor of collapse dynamics, grain-scale angularity plays a significant role in determining the timing of regime transitions and the slope angle.


Introduction

Understanding granular flow is essential for interpreting in-situ and remote observations of planetary surfaces, ranging from cm-scale wheel-regolith interactions to km-scale landslides. This study is motivated by the significant diversity in regolith morphology observed across the solar system, where highly angular lunar grains contrast with the rounded particles found on Mars. Although established scaling laws describe post-avalanche deposits based on the initial aspect ratio (a) [1, 2, 3], grain-scale characteristics fundamentally alter mass wasting, and flow behavior remains insufficiently quantified. To address this gap, we expand upon previous works by investigating a diverse range of materials including sand, glass grit, and glass beads, to provide a more comprehensive characterization of the scaling laws governing granular avalanches.


Experiment Setup

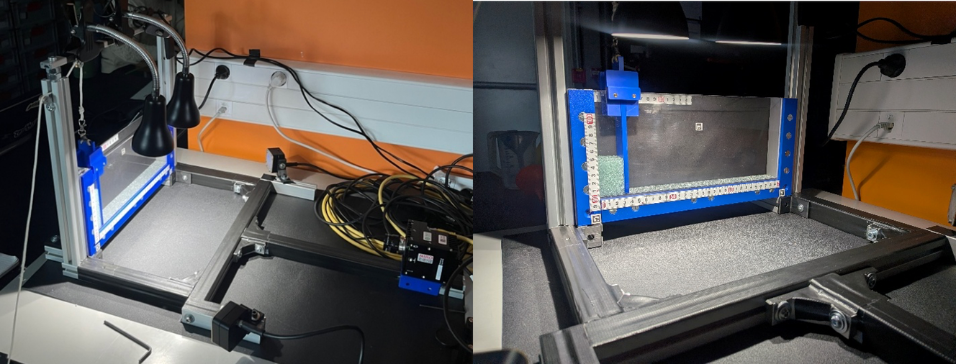
To investigate the role of grain-scale characteristics in avalanching behavior, we conducted a series of controlled column collapse experiments using a polycarbonate rectangular container measuring 100 mm in height by 300 mm in length by 30 mm in width (Fig. 1). The channel width was selected to avoid wall effects on the flow dynamics, while the base features a rough surface to simulate natural boundary conditions. The experimental configuration promotes unidirectional spreading, with the particulate column initially accommodated at one end of the channel. Flow was initiated by the rapid retraction of a frontal gate using a pulley system. Sand, glass grit, and glass beads, with various sizes, grain morphology, and bulk density, were tested. Avalanching processes were recorded using a high-speed camera, providing high-resolution data to characterize runout behavior and the morphological features of the deposits.

Figure 1: Setup for two-dimensional granular column collapse experiments.


Results

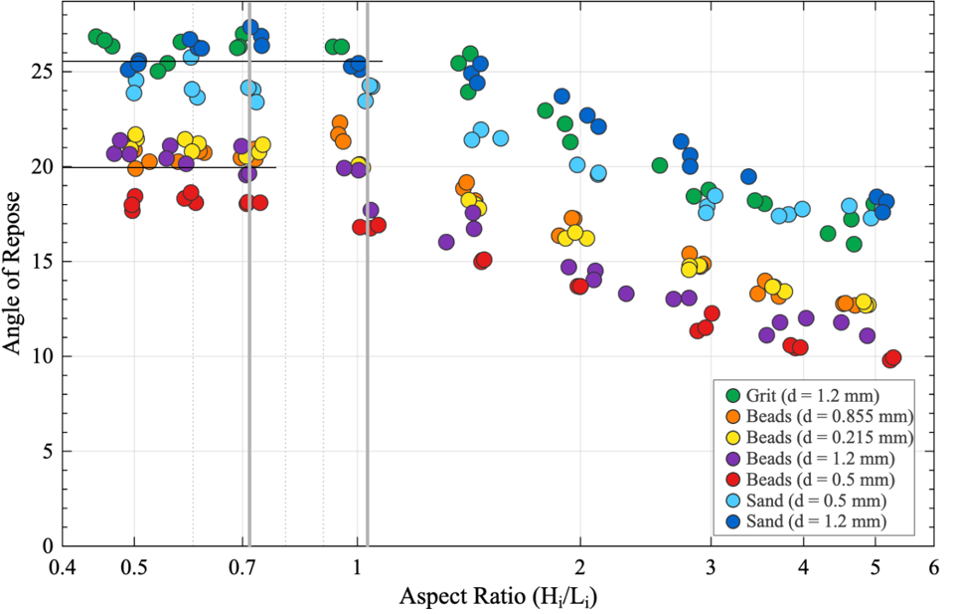
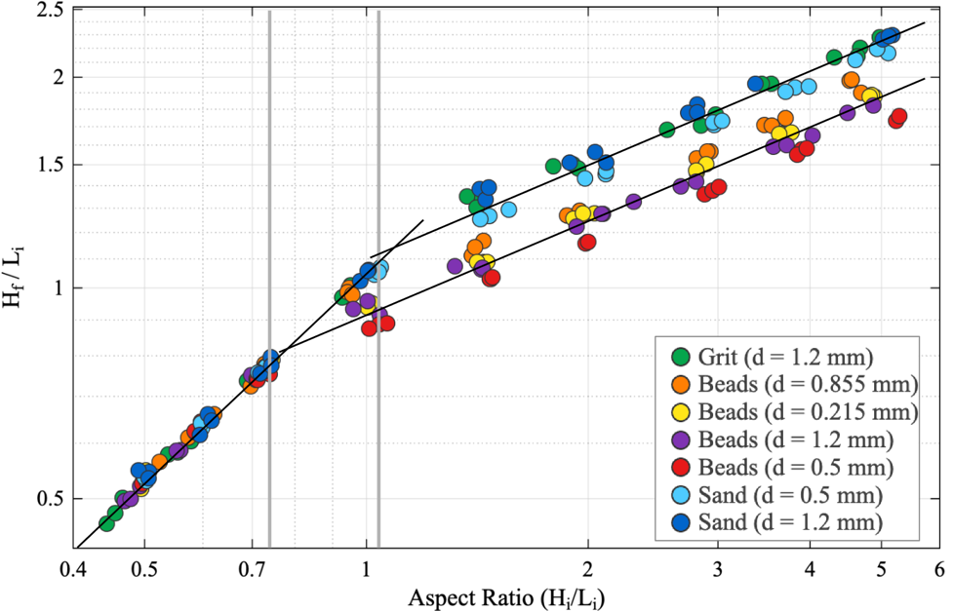
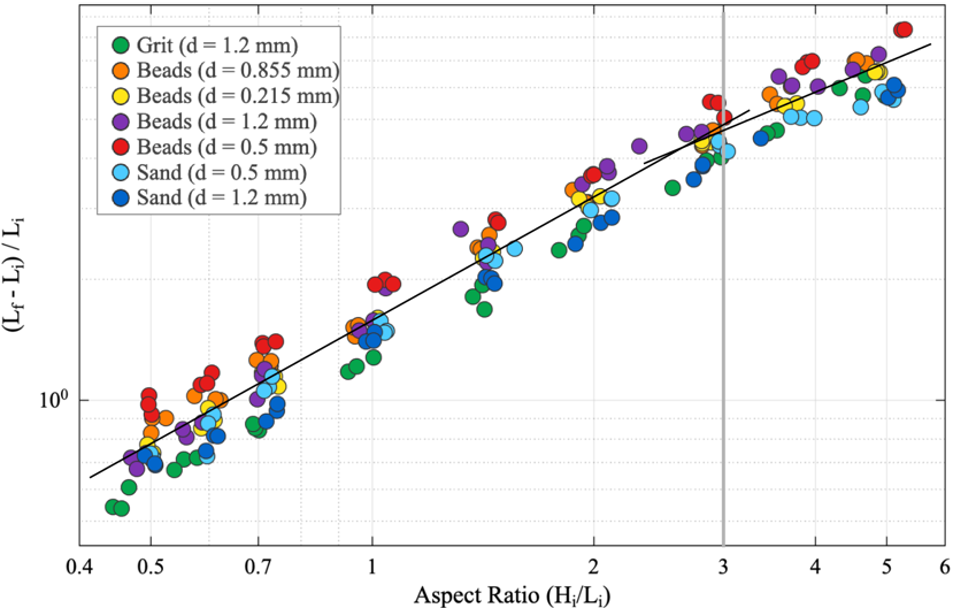
Our experiments confirm that the morphology of a post-avalanche deposit is fundamentally governed by the initial aspect ratio a of a column (Fig. 2). For low aspect ratios (a <= 0.7 for glass beads and a <= 1.0 for angular particles), the deposit retains a motionless plateau with a constant final slope angle, measuring approximately 20 degrees for beads and 25 degrees for angular materials (Fig. 3). The difference in angle of repose is due to grain angularity. As a exceeds these critical values, the column transitions to a vertical collapse mode where initial potential energy is converted into horizontal spreading, resulting in gentler final slopes that exhibit a consistent trend across all tested materials. This morphological transition is reflected in the scaling laws for normalized maximum deposit height (Hf / Li), where a regime change corresponds to the disappearance of the plateau of final deposit (Fig. 4). For angular particles, the power-law exponent shifts from 0.96 +/- 0.03 to 0.43 +/- 0.02 at a = 1, while beads exhibited a similar shift at a = 0.7 from 0.96 +/- 0.03 to 0.43 +/- 0.01. These observations qualitatively align with Lube et al. (2005), who identified a transition for coarse sand at a = 1.15 with an exponent shift from 1 to 0.4, and Lajeunesse et al. (2005), who observed a transition for beads at a = 0.7 to an exponent of 0.33. While our derived exponents are slightly higher, the overall power-law behavior and the timing of the regime transitions show good agreement. Furthermore, the normalized runout distance ((Lf - Li) / Li) displayed a regime change at a ~ 2.5, with power-law transitioning from 1.0 +/- 0.03 to 0.80 +/- 0.12 (Fig. 5).  Although previous studies [1, 2] reported a transition at a ~3 to a 0.67 power law, our results indicate a higher sensitivity to the initial aspect ratio in the large-a regime. These results demonstrate that grain morphology is one critical factor governing regime transitions in granular collapses, providing further constraints for interpreting the surfaces of celestial bodies with varying regolith characteristics. Future work will investigate the effects of material friction and surface gravity, which will be integrated into scaling laws to enable more precise estimations of regolith properties from asteroid imagery.


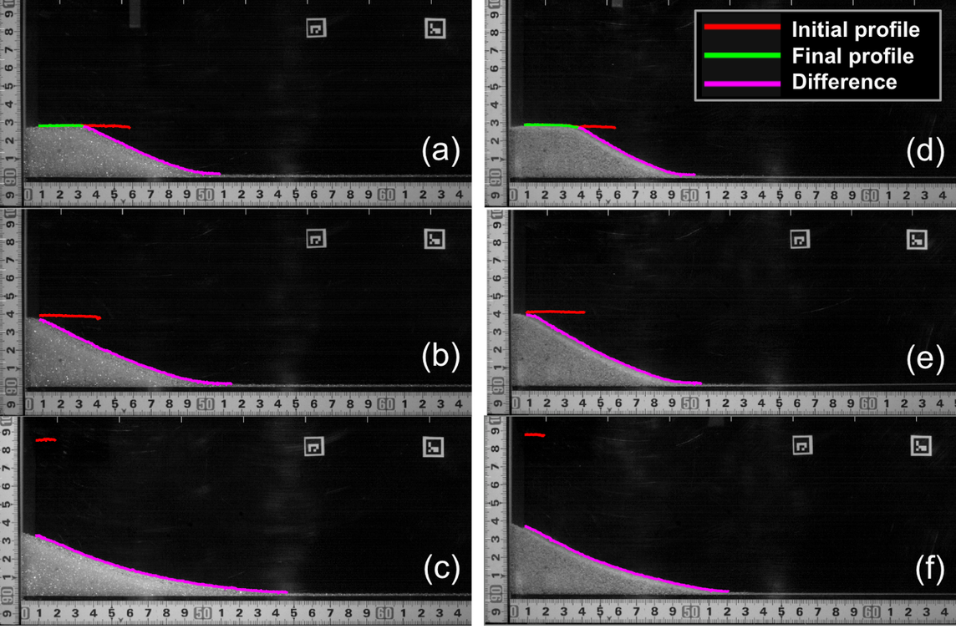
Figure 2: Panels (a–c) show the final deposits of glass beads (diameter = 0.855 mm) for a = 4.5 (a), 0.95 (b), and 0.50 (c). Snapshots (d–f) show sand (diameter = 0.5 mm) at a = 4.6 (d), 1.0 (e), and 0.49 (f). For both materials, a static plateau remains at low aspect ratios (a ~ 1.0), while higher aspect ratios lead to a complete vertical collapse.

Figure 3: Angle of repose vs initial aspect ratio, with the vertical lines showing the first flow transition for glass beads (a = 0.7) and angular particles (a = 1).

Figure 4: Normalized final deposit height vs initial aspect ratio, with the vertical lines showing the first flow transition for glass beads (a = 0.7) and angular particles (a = 1).

Figure 5:  Normalized runout distance vs initial aspect ratio, where the vertical line shows the second regime transition for all materials (a = 3).


Acknowledgement

This work is supported by the European Research Council GRAVITE project (grant N°1087060).


 References

1. Lube, G., et al. PRE 72.4 (2005).

2. Lajeunesse, E., et al. GRL 4 (2006).

3.Roche, O., et al. EPS Letters 311 (2011).

How to cite: Horie, Y., Sunday, C., Sugita, S., and Murdoch, N.: Grain-Scale Morphology and Initial Aspect Ratio Effect on Granular Avalanches, Europlanet Science Congress 2026, The Hague, The Netherlands, 7–11 Sep 2026, EPSC2026-796, https://doi.org/10.5194/epsc2026-796, 2026.

F2.48
|
EPSC2026-801
|
ECP
|
On-site presentation
Liesbeth van Elswijk, Lonneke Roelofs, and Susan Conway

Introduction 

Gullies on Mars are a feature prevalent in the mid-latitudes of Mars [1,2]. They are characterised by a source alcove, transport-channel and terminal depositional apron/fan [3]. They are typically large enough to be reliably identified on ~6 m/pix Context Camera (CTX) images, which has near-global coverage.  Initially, mid-latitude gullies were attributed to processes involving liquid water [4], but the increasing evidence of winter modifications in the last decade [5] has prompted researchers to prefer a mechanism driven by the sublimation of seasonally deposited CO2 ice [6]. The restriction of these features to the mid-latitudes fits with the seasonal distribution of CO2 ice at the present-day. 

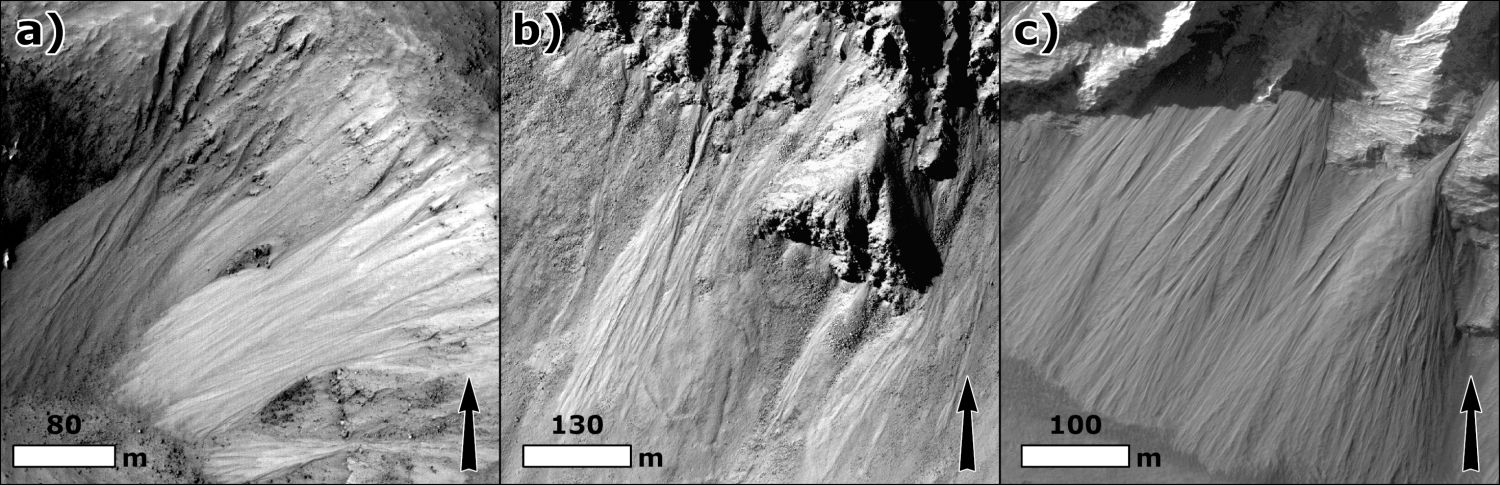
However, several researchers have reported gullies at equatorial latitudes using HiRISE images [7,8] (Figure 1), at 25-50 cm/pix. These have traditionally been separated from mid-latitude gullies because of their smaller size [1,2]. Yet, this separation warrants scrutiny. If they share the same process as mid-latitude gullies, the mechanism of sublimation of seasonally deposited CO2 ice would have to be re-examined. Here, we perform a survey for gullies at the equatorial latitudes using HiRISE images, interrogating their morphology and topographic characteristics to assess the potential formation processes. 

Figure 1: HiRISE examples of equatorial gullies: a) ESP_036987_1825, b) ESP_036209_1720, c) ESP_088659_1715. 

Approach 

We inspect available HiRISE images between 25°S and 25°N containing sloping terrain - identified from a MOLA slope map filtered to terrain exceeding 9° within the HiRISE footprint. Gullies were identified by searching for narrow, elongated, leveed downslope channels with variable alcove and apron development. Each image was tagged, “yes”, “no”, “maybe” or “unusable”. To test spatial clustering while accounting for the non-random distribution of HiRISE images, we performed a hotspot analysis based on Viola and McEwen [9]. 

A subset of the gully sites underwent additional morphological analysis, noting: gully orientation (average azimuth of the gully centreline), alcove depth (“deep”, “intermediate” or “shallow”), bedrock coverage (“low”, “intermediate” or “high”) and morphological expression (“well-developed”, “moderate” or “poor”). 

Finally, we examined digital terrain models (DTMs) derived from stereo pairs of HiRISE images at 1-2 m/pix, sourced from the Planetary Data System, generated by MarsSI (https://marssi.univ-lyon1.fr/) using the Ames Stereo Pipeline [10], or using the ISIS-SocetSet workflow [11]. We extracted the average slope from profiles along the gullied zone, from the slope below the termination and from non-gullied slopes in similar settings.  

Results and discussion 

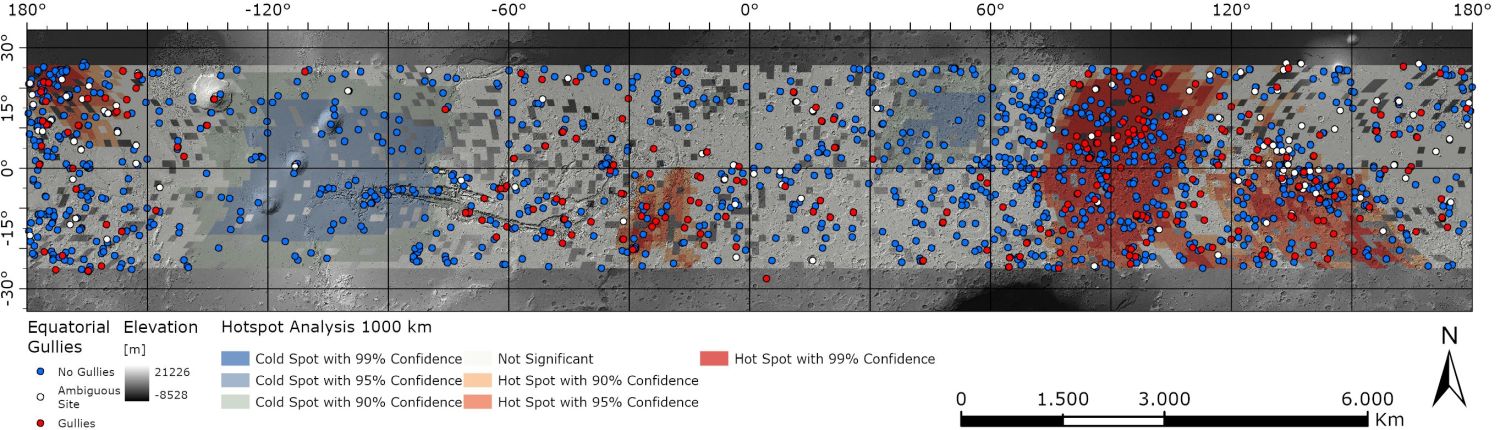
We inspected 1558 HiRISE images between 25°S and 25°N and found 288 containing equatorial gullies (Figure 2). Clustering analysis identifies statistically significant concentrations in southern Erebus Montes, the chaos terrains east of Valles Marineris and the zone spanning from southern Isidis to eastern Hellas, with significant absences in the broad Tharsis Rise region and in Terra Sabea. We found no convincing correlation with dust cover index, thermal inertia, or elevation - such variables should influence their distribution if volatiles were involved [12,13]. 


Figure 2: Distribution of equatorial gully sites (25°S-25°N) overlaid on a MOLA shaded relief and results from the hotspot analysis (fixed distance band of 1000 km). 

Detailed morphological analysis on 89 sites (481 gully fields), revealed no obvious trend in orientation with latitude, such as that found in mid-latitude gullies [14] caused by CO2 sublimation or in rockfalls caused by thermal stress [15]. However, these features may represent the integration of a process occurring over a wide range of orbital conditions that could obscure any obvious latitudinal trend. 


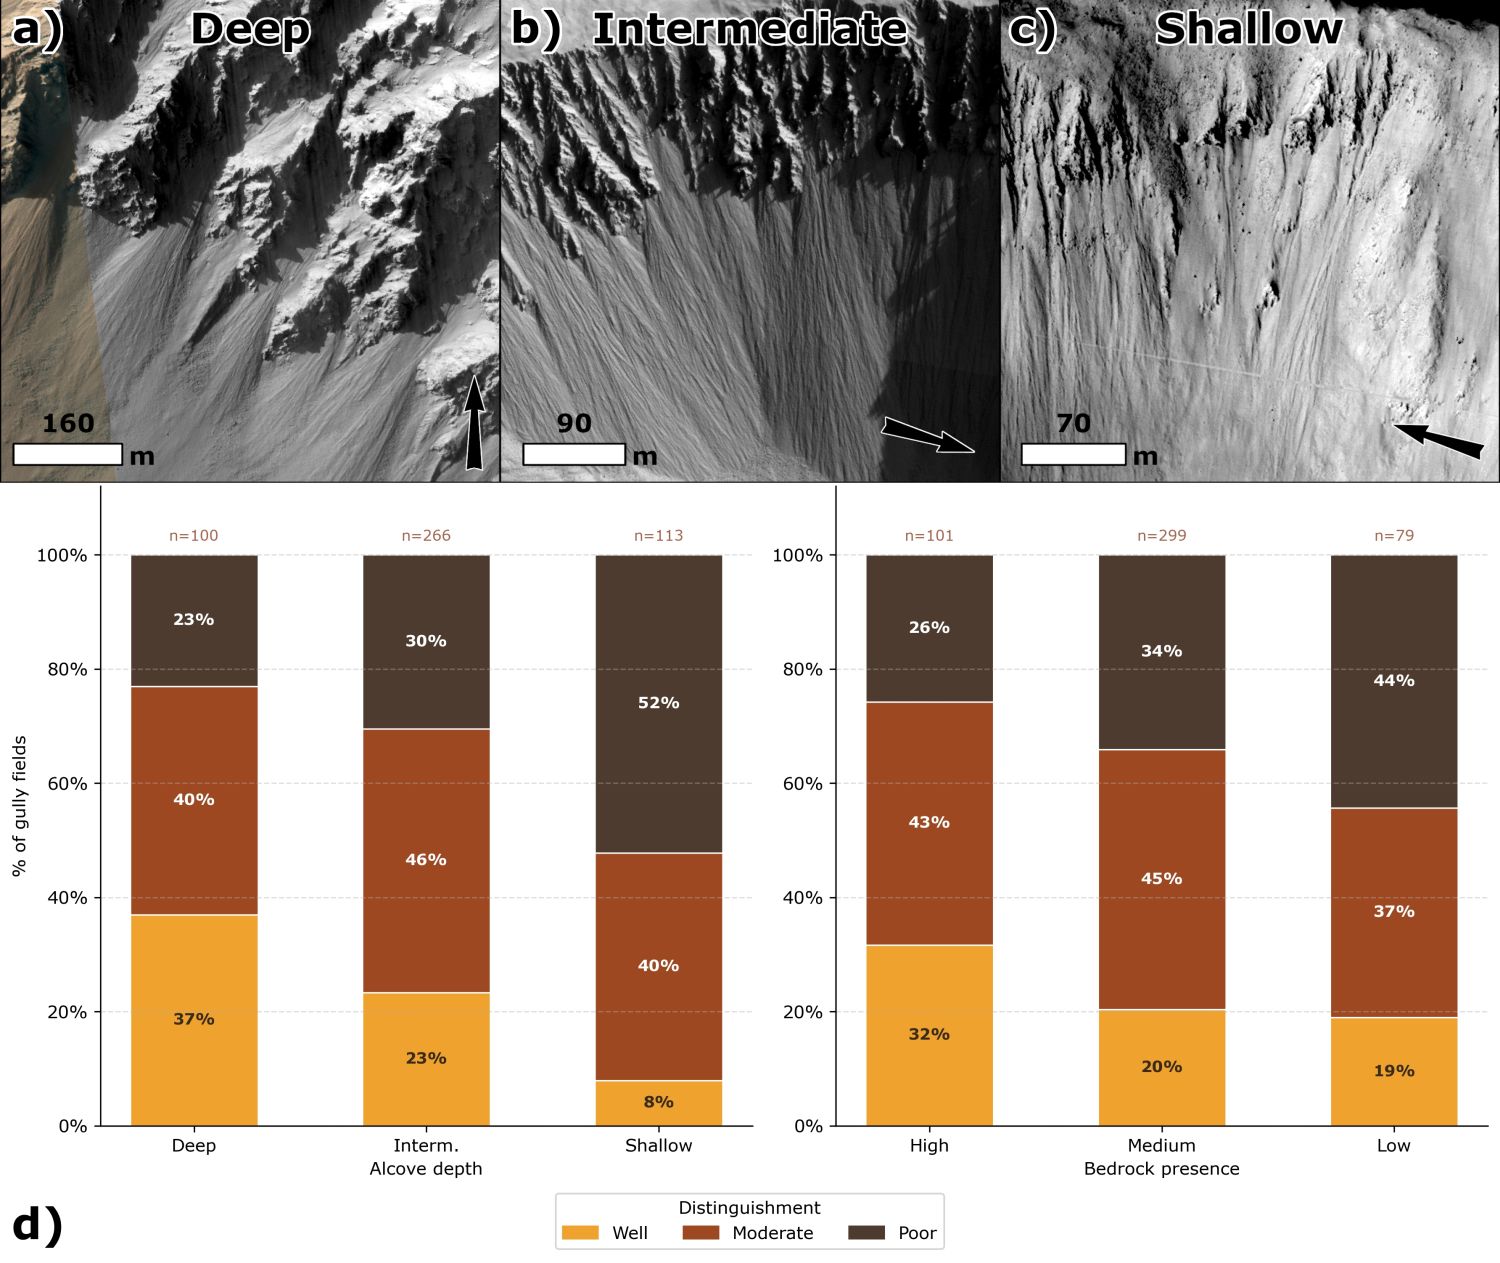
Figure 3: Morphological expression of equatorial gullies by alcove depth and bedrock presence.  HiRISE images of a) deep (ESP_087891_1565), b) intermediate (ESP_088507_1720), and c) shallow (ESP_088930_1735) alcoves. d) Stacked bar charts showing the proportion of gully fields as a function of alcove depth (left) and bedrock presence (right). 

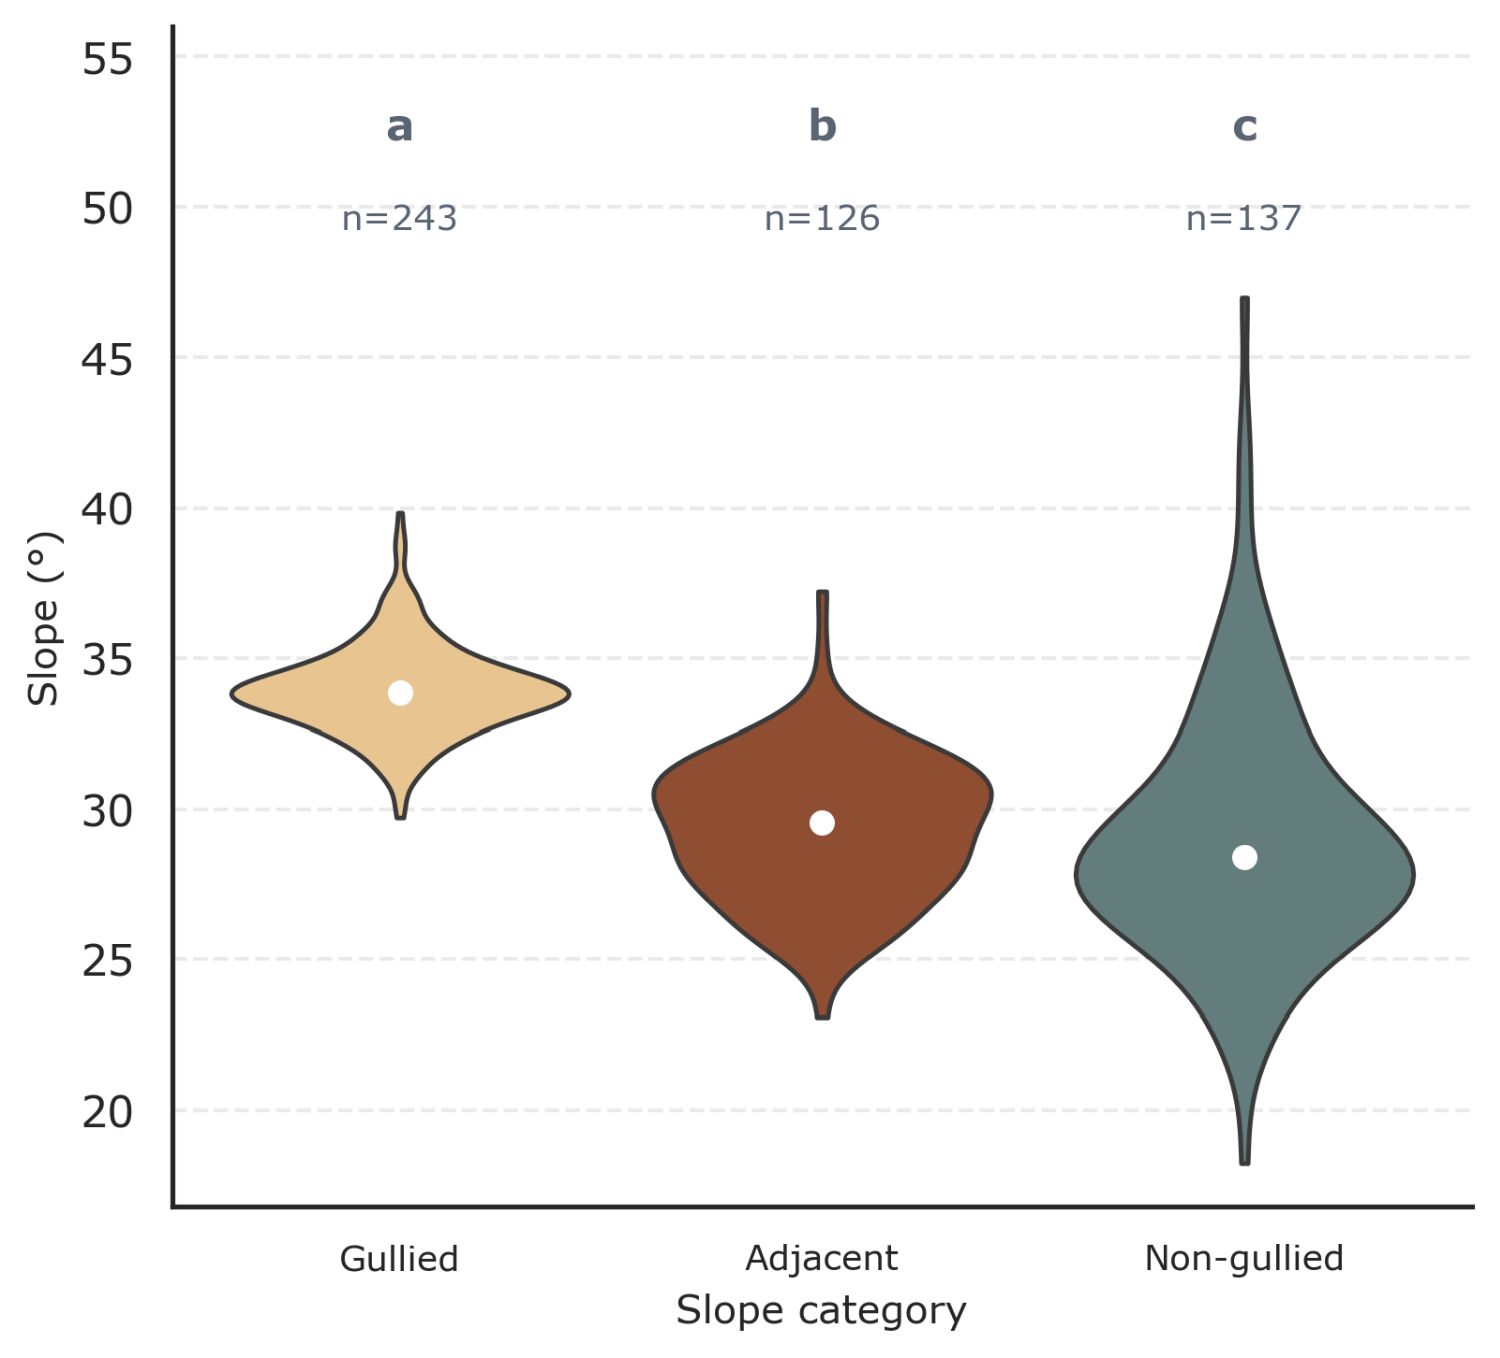
Gullies are more numerous in sites where the bedrock has well-developed alcoves (Figure 3). Analysis of 36 DTMs covering 243 equatorial gullies, 126 adjacent slopes and 137 non-gullied slopes shows that equatorial gullies erode and deposit on slopes of 29.7-39.8°, statistically steeper than non-gullied slopes (Figure 4). This clearly sets equatorial gullies apart from mid-latitude gullies, supporting the assumption made in previous studies. 


Figure 4: Slope angle distributions (°) for (a) gullied, (b) adjacent and (c) non-gullied slopes.  

Conclusions 

  • We present the first systematic catalogue of 288 sites with equatorial gullies on Mars 
  • Equatorial gullies show regional clusters of high and low density, which cannot be linked to variation in surface dust cover, thermal inertia or elevation. Equally no systematic orientation trends are observed with latitude. We would expect the opposite to be the case if volatiles were involved in the process. 
  • We find that equatorial gullies are best developed below deep bedrock alcoves and deposit on slopes generally >29°, setting them apart from mid-latitude gullies.  

References cited: [1] T.N. Harrison et al. (2015) Icarus, 252, 236–254. [2] A. Noblet et al. (2024) Icarus, 418, 116147.  [3] M.C. Malin and K.S. Edgett (2000) Science, 288, 2330–2335. [4] J.L. Heldmann et al. (2005) JGR, 110. [5] C.M. Dundas et al. (2019) GSL, 467. [6] L. Roelofs et al. (2024) Commun. Earth Environ., 5, 125. [7] K.C. Auld and J.C. Dixon (2016) PSS, 131, 88–101. [8] M.F. Thomas et al. (2020) Icarus, 342, 113566. [9] D. Viola and A.S. McEwen (2018) JGR, 123, 262–277. [10] R.A. Beyer et al. (2018) Earth Space Sci., 5, 537–548. [11] S.S. Sutton et al. (2022) Remote Sens., 14, 2403. [12] L. Lange et al. (2023) GRL, 50, e2023GL105177. [13] S. Piqueux et al. (2016) JGR, 121, 1174-1189. [14] S.J. Conway et al. (2019) GSL, 467.  [15] P.-A. Tesson et al. (2020) Icarus, 342, 113503.    

How to cite: van Elswijk, L., Roelofs, L., and Conway, S.: Mapping Equatorial Gullies on Mars, Europlanet Science Congress 2026, The Hague, The Netherlands, 7–11 Sep 2026, EPSC2026-801, https://doi.org/10.5194/epsc2026-801, 2026.

F2.49
|
EPSC2026-983
|
ECP
|
On-site presentation
Ben Kirby, Joel Davis, Sanjeev Gupta, Peter Grindrod, and Gaia Stucky de Quay

Introduction:

Ancient Mars (Noachian to Early Hesperian > ~3.5 Ga1) may have experienced a warm, stable climate conducive to extensive fluvial activity, before transitioning during the younger Hesperian and Amazonian (3.5 – 0 Ga1) to a cold, hyper-arid state2. This climatic shift may have been punctuated by multiple transient warm and wet episodes3. During this transition, catastrophic floods, likely driven by rapid ice melt and/or bursting groundwater aquifers, carved outflow channels independently of global-scale climate forcing, most prominently in the Circum-Chryse region4. Alluvial fans, which record subaerial stream and/or debris flow processes, are widespread in Hesperian and Amazonian-aged impact craters, yet their relationship to outflow channels is largely undocumented5. This study explores whether the formation of Kasei Valles, Mars’ largest outflow channel6, was punctuated by lower-magnitude, local-scale fluvial processes associated with alluvial fan deposition. Using high-resolution orbital datasets (HiRISE, CTX, HRSC and MOLA), we mapped the distribution of alluvial fans, examined their surface morphology, measured surface slope angles and investigated their stratigraphic relationships to the broader channel.

Observations and Interpretations: 

Alluvial Fans in Kasei Valles:

A 4° × 4° survey of Kasei Valles identified a total of 108 deposits, including 58 bajadas and 32 alluvial fans that were previously undocumented (Figure 1). Fan deposits were most prevalent around the Sharanov ejecta blanket, whereas bajadas dominated increasingly channelised terrain, particularly within the southern channel, where steep topography and limited lateral confinement likely promoted fan coalescence. The fan catchments, characterised by spurs and gullies that vary in configuration, scale, and degree of entrenchment, are consistent with fluvial erosion and weathering rather than mass-wasting processes7. The fans also exhibit low-gradient surface slopes, with a median angle of 7.57° derived from 103 deposits. This, together with distributary channels and low-relief ridges, preserved on their surfaces, and sedimentary layering exposed in their margins, supports an alluvial origin for many of the observed fans, with streamflow and/or debris-flow processes likely driving their development8.

Figure 1: Topographic map showing the distribution of alluvial fans and bajadas across Kasei Valles9,10.

Alluvial Fan Deposition between Flooding Events.

The stratigraphic relationships between the alluvial fans and flood-eroded surfaces within Kasei Valles provide insight into the relative chronology of channel incision and fan formation. As an exemplar of this, we present a localised study area centred ~ 22.816°N, -65.954°E in the southern Kasei Valles channel (Figure 2). Here, two sets of flood-eroded surfaces, S1 and S2, are preserved at different elevations along the southernmost channel wall, separated by a flood-incised scarp. The S1 surfaces lie at higher elevations and predate the erosion of the S2 surfaces. A significant portion of the S1 surface is overlain by alluvial fans, hereafter referred to as the F1 fans, which coalesce into bajadas. This relationship, together with the truncated distal margins of the F1 fans delineated by the flood-incised scarp, indicates that the F1 fans were deposited after erosion of the S1 surfaces but prior to the incision of the S2 surfaces. The F1 fans are further dissected by a series of backwasting gullies that function as source catchments for the F2 fans preserved at lower elevations within the channel (i.e., along the current channel floor). The F2 fans coalesce into bajadas that overlie portions of the S2 surface and are distally embayed by flood lavas. This relationship indicates that the F2 fans postdate deposition of the F1 fans and erosion of the S1 and S2 surfaces but predate emplacement of the flood lavas. This stratigraphy suggests that Kasei Valles formed through multiple discrete flooding events, with intervening quiescent periods of sufficient duration to allow alluvial fan formation11.

Figure 2: CTX oblique view of a channel wall in Kasei Valles showing two flood-eroded surfaces overlain by alluvial fans. Dashed lines mark F1 (black) and F2 fans (white), delineate gullies (brown), and trace the truncation of S1 surfaces (blue).

Stratigraphy of the Alluvial Fans, Flood Surfaces, and Flood Lavas.

Similar stratigraphic relationships are preserved at several sites across Kasei Valles, recording multiple, discrete flooding events punctuated by intervals of alluvial fan formation. At these sites, alluvial fans overlie flood-eroded surfaces positioned at various elevations along the channel wall. In some cases, the fans are truncated by flood-incised scarps. A significant proportion of the alluvial fans in Kasei Valles overlie flood-eroded surfaces and exhibit no evidence of truncation by subsequent channel incision, suggesting that their formation postdates the cessation of major flooding activity. Similarly, many alluvial fans on the current channel floor are distally embayed by Late Amazonian flood lavas emplaced between ~128 and 281 Ma12. Together with the cessation of major flooding activity at ~1.0 Ga12, this relationship constrains the formation of alluvial fans on the channel floor to the Middle–Late Amazonian and aligns with proposed timelines for fan formation on Mars13.

Conclusion:

Our findings indicate that Kasei Valles was incised by multiple, temporally discrete catastrophic flooding events, with intervening episodes of alluvial fan formation driven by local-scale, non-catastrophic fluvial processes such as streamflow and debris flows. This juxtaposition highlights the marked contrast between the environmental conditions required for outflow channel erosion and alluvial fan deposition, suggesting that Mars’ climatic transition was punctuated by transient warm and wet periods conducive to alluvial fan formation within an overarching trend of cooling and drying.

References:

[1] Michael, G.G. and Neukum, G. (2010), Earth and Planetary Science Letters, 294, [2] Carr, M.H. and Head III, J.W. (2010), Earth and Planetary Science Letters, 294, [3] Kite, E.S. (2019), Space Science Reviews, 215, [4] Warner et al. (2009), Earth and Planetary Science Letters, 288, [5] Moore, J.M. and Howard, A.D. (2005), Journal of Geophysical Research: Planets, 110, [6] Chapman et al. (2010a), Earth and Planetary Science Letters, 294, [7] Blair, T.C. and McPherson, J.G. (1994), Journal of Sedimentary Research, 64, [8] Davis et al. (2021), Geology, 49, [9] Morgan et al. (2022), Icarus, 385, [10] Mondro et al. (2023) Icarus, 389. [11] Armitage et al. (2011), Geophysical Research Letters, 38, [12] Chapman et al. (2010b), Earth and Planetary Science Letters, 294, [13] Holo et al. (2021), The Planetary Science Journal, 2.

How to cite: Kirby, B., Davis, J., Gupta, S., Grindrod, P., and Stucky de Quay, G.: Multiple, Discrete Channel Incision Episodes in Kasei Valles, Mars, Recorded by Alluvial Fan Stratigraphy , Europlanet Science Congress 2026, The Hague, The Netherlands, 7–11 Sep 2026, EPSC2026-983, https://doi.org/10.5194/epsc2026-983, 2026.