Multiple terms: term1 term2
red apples
returns results with all terms like:
Fructose levels in red and green apples
Precise match in quotes: "term1 term2"
"red apples"
returns results matching exactly like:
Anthocyanin biosynthesis in red apples
Exclude a term with -: term1 -term2
apples -red
returns results containing apples but not red:
Malic acid in green apples
hits for "" in
Network problems
Server timeout
Invalid search term
Too many requests
Empty search term
TP15
This session aims to bring together scientific studies of the lunar surface and subsurface that can help pave the way for upcoming space missions. We welcome studies that support the planning of future missions, including—but not necessarily limited to—remote sensing, geological mapping, in situ measurements, laboratory and analog experiments, sample analyses, and modeling. Topics include:
• Resource potential, including the detection and distribution of OH/H₂O, water ice and other volatiles or mineral resources relevant for future utilization
• Use of spectral, thermal, radar, and geophysical data for lunar surface and subsurface characterization
• Mineralogical and geological characterization of key terrains
• Regolith physical and mechanical properties (e.g., grain size, porosity, density, thermal inertia, mechanical strength)
Introduction
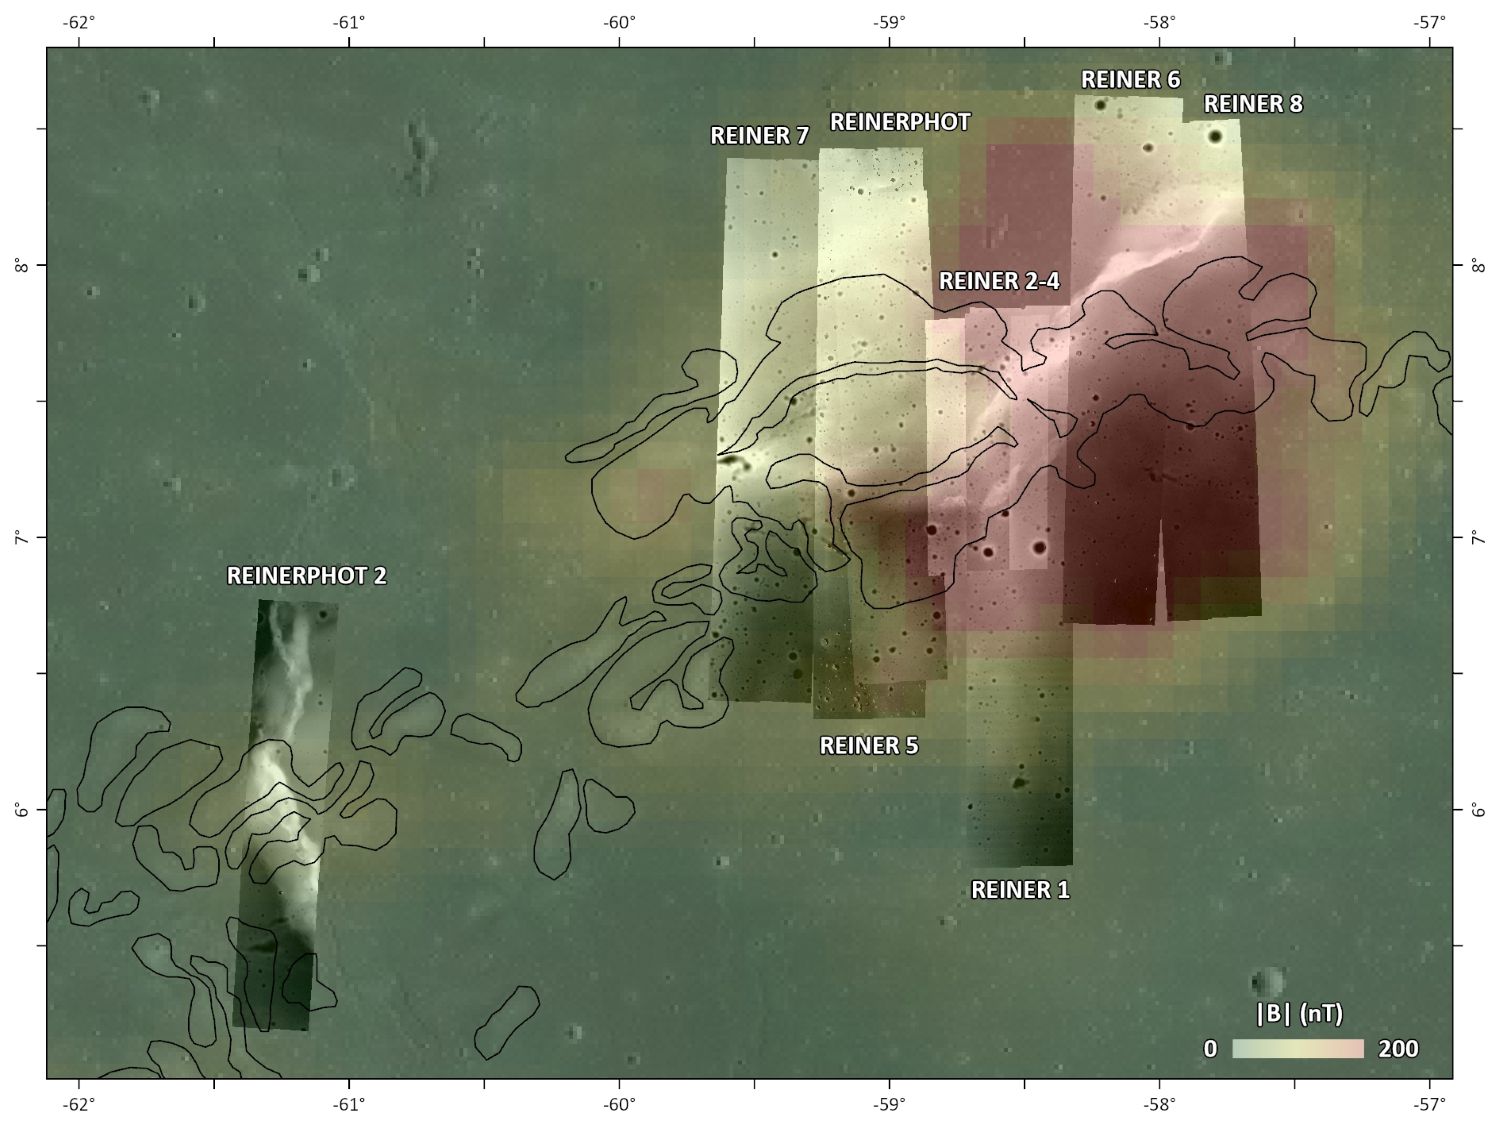
Lunar Vertex, NASA’s first Payloads and Research Investigations on the Surface of the Moon (PRISM) delivery, will explore the Reiner Gamma lunar swirl (Figure 1) (Blewett et al., 2025). Swirls consist of high and low albedo variations in the form of loops and ribbons sometimes associated with crustal magnetic “anomalies”. Different hypotheses have been proposed to explain the presence of swirls (summarized in Blewett et al., 2021), including magnetic shielding of the surface from the darkening effects of the solar wind, scouring by gas and dust during the collision of a comet's coma or a meteoroid swarm, and accumulation of fine-grained dust in response to magnetic or electric fields associated with the magnetic anomaly. Studies have investigated the photometric properties of the uppermost regolith at swirls without reaching a consensus regarding their origin but suggest that solar wind shielding and dust levitation/sorting may both play a role (e.g., Denevi et al., 2016; Chrbolková et al. 2019; Kinczyk et al., 2025). Geomorphological studies suggest that on-swirl regions are lower than the off-swirl region by ~4 m at Reiner Gamma (Weirich et al., 2023), supporting the dust migration hypothesis, or local topographic variations pre-dating the formation of the swirls.
In this study, we investigate potential differences in regolith properties between on-swirl and off-swirl regions at Reiner Gamma to provide context for the Lunar Vertex mission. Our first objective is to quantify morphometric parameters from the bowl-shaped crater population to investigate potential dust migration mechanisms which may contribute to preferential crater infill on-swirl, or different regolith properties. Our second objective is to estimate regolith thickness using the non-bowl-shaped crater population to see if variations in local regolith thicknesses exist, and in turn, if dust migration mechanisms or differences in pre-impact topography could contribute to these variations.
Datasets and methods
We trained and used a YOLOv5-based model (e.g., Bickel et al., 2025) to detect craters across Reiner Gamma in hillshade images derived from Lunar Reconnaissance Orbiter (LRO) Narrow Angle Camera (NAC) digital terrain models (DTMs) at spatial resolutions from 2 to 5 meters. We developed “MorphoPy”, a Python-based automated crater morphology characterization tool (Martinez et al., 2026), which calculates morphometric parameters (e.g., depth, diameter, wall slope, rim slope, circularity, eccentricity, freshness) on DTMs for craters that have 36 semi-profiles each containing 10 valid measurements. Morphometric parameters are calculated for craters with a diameter (D) equal to or larger than 20 times the spatial resolution of the input DTM, here D≥40 m. In parallel, we manually identified non-bowl-shaped craters (e.g., flat floored, concentric craters, mound) in LROC NAC images on Quickmap and estimated regolith thicknesses using the formula of Bart et al. (2011).

Figure 1. Map of Reiner Gamma showing the location of NAC DTMs used to investigate crater morphology overlain by the intensity of the magnetic field (Ravat et al., 2020) (swirl outline from Denevi et al., 2016).
Preliminary results
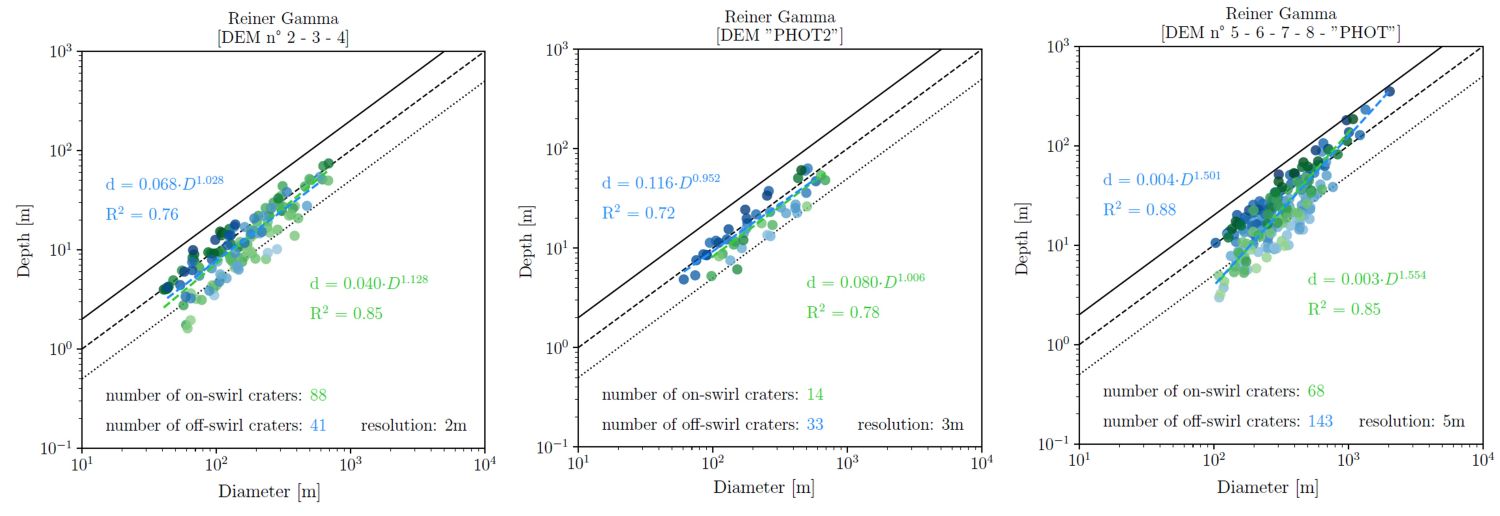
The YOLOv5 algorithm identified ~70 000 craters, and “MorphoPy” calculated morphometric parameters for ~25 000 of those. To investigate a subset of the freshest primary craters, we extracted values for craters having a circularity ≥ 0.9, opposite rim slope < 8˚ and a measurable rim for ≥ 50% of their half-profiles. Plots of depth versus diameter values (Figure 2) suggest that most of the freshest primary craters in the Reiner Gamma region have d/D values centered around ~0.1, especially for strength-dominated craters (D < 400 m). Depth versus diameter trends suggest that off-swirl craters are systematically deeper (hence have higher d/D values) than their on-swirl counterpart for a given crater diameter. Analyses will be conducted next to see if the trends are statistically different.

Figure 2. Depth versus diameter values for the freshest on-swirl and off-swirl craters in DTMs of different spatial resolution (solid line d/D=0.2, dashed line d/D=0.1, dotted line d/D=0.05).
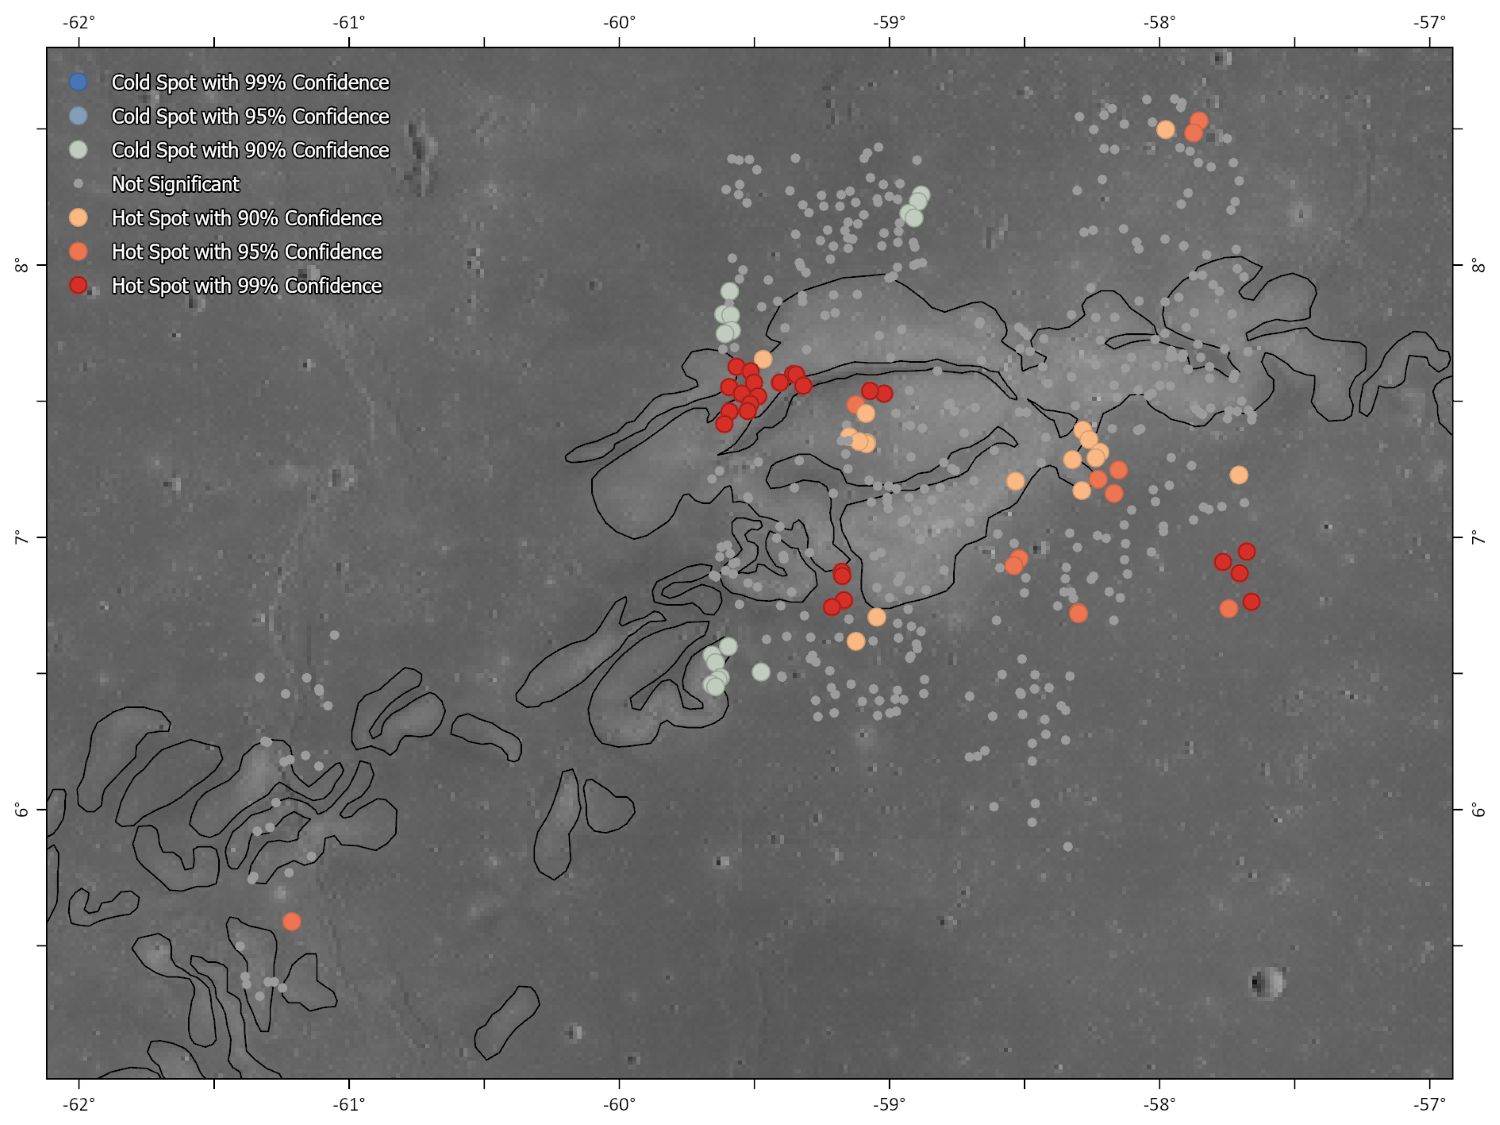
We identified 918 non-bowl-shaped craters on Quickmap, and calculated regolith thickness for the 503 craters that exhibit a clear rim (apparent diameter, DA) and “inner feature” (measured at the base of the normal crater wall slope, DF). Bart et al. (2014) suggest that craters where DF/DA varies between 0.2 and 0.7 and where DA < 300 m are well suited to infer regolith thickness. In our case, 467 craters respect such values (296 off swirl, 171 on swirl) and yield a mean regolith thickness of 6.6 m off-swirl versus 6.1 on-swirl and median values of respectively 4.1 and 4.2 m. These values are consistent with those reported for mare surfaces (3.1–7.8 m; Cooper et al., 1974; Nakamura et al., 1975; Bart et al., 2011). The “regolith thickness” values calculated range between ~1 and 50 m. Impact craters that encounter a strength transition in the target have non-bowl-shaped morphologies. The strength transition can be a layer of regolith over bedrock but can also be a strength transition farther beneath the surface such as layering in the basalt (Bart et al, 2014). A hot spot analysis (Getis-Ord Gi) on the 467 regolith thickness measurements suggests that some high (hot spot) and low (cold spot) regolith thickness values cluster spatially and are statistically significant. Hot spots mostly occur on-swirl and towards the southern portion of Reiner Gamma, while cold spots mostly occur off-swirl and towards the northern portion of Reiner Gamma. The region at ~7.5˚N, 59.5˚W notably exhibits cold spots (regolith thickness values on the order of 1-3 m) in proximity to hot spots (“regolith thickness” or strength contrast at 5-50 m).

Figure 3. Hot spot analysis on 467 regolith thickness measurements.
Bart et al. (2011) Icarus 215, 485–490.
Bart et al. (2014) Icarus 235, 130–135
Bickel et al. (2025) GRL, 51, 24, e2024GL110674.
Blewett et al. (2021) Bulletin of the AAS, 53, 4.
Blewett et al. (2025) 56th LPSC, abstract #1233.
Chrbolková et al. (2019) Icarus, 333, 516-527.
Cooper et al. (1974) Rev. of Geophysics, 12, 3, 291-308.
Denevi et al. (2016) Icarus, 273, 53-67.
Kinczyk et al. (2025) Planet. Sci. J., 6, 57.
Nakamura et al. (1975) Nature, 13, 57-66.
Weirich et al. (2023) lanet. Sci. J., 4, 212.
How to cite: Lemelin, M., Martinez, L., Calas, G., Lagneaux, A., Roy, M., T. Bickel, V., Belleau-Magnat, G., Diotte, F., and T. Blewett, D.: The Structure of the Regolith at Reiner Gamma: Context for the Lunar Vertex Mission, Europlanet Science Congress 2026, The Hague, The Netherlands, 7–11 Sep 2026, EPSC2026-124, https://doi.org/10.5194/epsc2026-124, 2026.
Radiometric measurements of the (sub-)surface thermal emission are sensitive to the microphysical structure and thermophysical properties of the regolith. For the interpretation of these measurements, thermal models are required. Bürger et al. (2024) developed a microphysical thermal model for the lunar regolith, which more directly simulates regolith properties such as the grain size and volume filling factor. In this study (Bürger et al., 2026), we derive global regolith grain size and density-stratification by matching modeled surface temperatures and microwave brightness temperatures with measurements from the infrared radiometer Diviner on board the Lunar Reconnaissance Orbiter (LRO) (Paige et al., 2010) and the Microwave Radiometer (MRM) on board Chang’E-2 (Wang et al., 2010; Zheng et al., 2019). The radiometric observations in the infrared and in the microwave range are complementary, as infrared measurements are sensitive to surface thermal emission, while the microwave measurements are sensitive to the thermal emission from subsurface layers.
It is important to note that the microwave radiometer receives the thermal emission from a range of depths within the regolith, with the overall penetration depth being controlled by measurement frequency and the dielectric properties of the regolith. Therefore, in order to derive synthetic microwave brightness temperatures, a radiative transfer model is required and this study uses the model presented in Feng et al. (2020) and Siegler et al. (2020). Furthermore, we use only the 19.35 GHz and 37 GHz channel data of MRM, because the two lowermost frequency channels of MRM are believed to suffer from a calibration issue (Feng et al., 2020; Hu et al., 2017; Hu & Keihm, 2021).
We find that the regolith grain size and density-stratification can be unambiguously constrained when fitting both datasets – Diviner and MRM. In more detail, we derive for the equatorial highlands a global regolith grain radius of 45+6-4 µm and a deep layer bulk density of 1800+70-90 kg m-3. These parameters describe the highland regolith well for all latitudes < 40° and are in good agreement with grain size and bulk density measurements from returned Apollo samples. Figure 1 illustrates the Diviner regolith temperatures and the MRM 37 GHz and 19.35 GHz measurements in the lunar highlands at the equator together with the simulated surface and microwave brightness temperatures resulting in the above described best fit. Figure 2 illustrates the resulting bulk-density profile together with best-estimate bulk density values inferred from Apollo data (Mitchell et al., 1974), and the range of bulk densities determined from Apollo core tube and drill core measurements (Carrier et al., 1974; Carrier et al., 1991). Finally, we also investigated the latitudinal dependence of lunar regolith properties and find that both data sets – Diviner and MRM – can be best fit with a poleward decrease in deep layer bulk density.
Figure 1: The best-fit simulations (green line) together with the measured Diviner regolith temperatures (left), MRM 37 GHz (center), and 19.35 GHz (right) brightness temperatures in the highlands at the lunar equator. The measurements are presented as a function of local time and the individual measurements (small dots) are binned (black circles) with a bin-size of 0.5 hours.
Figure 2: The resulting bulk-density profile (green line) together with constraints from Apollo measurements.
References
Bürger et al. (2024), JGR Planets, 129(3). Bürger et al. (2026), A microphysical thermal model for the lunar regolith: Determining the lunar regolith properties using a combination of LRO/Diviner and Chang’E-2/MRM data, accepted for publication in A&A. Carrier et al. (1974), The Moon, 10, 183. Carrier et al. (1991), in Heiken G. H., Vaniman D. T., French B. M., eds, Lunar Sourcebook, A User’s Guide to the Moon, 475–594. Feng, J. et al. (2020), JGR Planets, 125(1). Hu et al. (2017), Icarus, 294, 72. Hu & Keihm (2021), IEEE Geoscience and Remote Sensing Letters, 18, 1781. Mitchell et al. (1974), Apollo soil mechanics experiment S-200, Space Sciences Laboratory Series 15, Issue 7, Univ. of California, Berkeley. Paige et al. (2010), Space Sci. Rev., 150(1–4), 125–160. Siegler, M. A. et al. (2020), JGR Planets, 125(9). Wang et al. (2010), Science China Earth Sciences, 53, 1392. Zheng et al. (2019), Icarus, 319, 627-644.
How to cite: Bürger, J., Feng, J., Siegler, M., and Blum, J.: Lunar regolith grain size and density-stratification derived from LRO/Diviner and Chang’E-2/MRM data, Europlanet Science Congress 2026, The Hague, The Netherlands, 7–11 Sep 2026, EPSC2026-192, https://doi.org/10.5194/epsc2026-192, 2026.
We examine lunar regolith space weathering as a function of wavelength, terrain type, and latitude using multiple datasets to quantify global and regional trends in surface reflectance and emission. Distinguishing space-weathering effects from bulk compositional controls is essential for interpreting spatial spectral variability and for identifying anomalous surface units. A statistically significant decrease in weathering with increasing latitude is observed in mare regions at all wavelengths analyzed, although the strength of the trend varies with wavelength. The strongest correlation occurs in the far-ultraviolet, consistent with its high sensitivity to space-weathering products such as submicroscopic iron. In the mare, the latitudinal dependence is well described by an equator-anchored cosine function, supporting a solar-zenith-controlled weathering process. Highlands terrains also exhibit statistically significant latitude-dependent behavior in ultraviolet and near-infrared observations, but the pattern is less monotonic and includes structured spatial variability, indicating a more complex interplay among weathering state, composition, and local geologic context. These results show that latitude-dependent space-weathering gradients are globally important but are also modulated regionally, including by longitude. Such gradients may bias spectral interpretations of regolith composition, particularly when applying commonly used compositional algorithms across terrains or spatial scales without accounting for maturity effects. Although terrain-specific approaches for mare and highlands have been proposed, the implications of latitude-dependent weathering have not yet been fully incorporated into compositional modeling or reconciled with interpretations based on optical maturity.
How to cite: Waller, D., Cahill, J., Retherford, K., Byron, B., Poston, M., Magaña, L., and Hendrix, A.: Variation in Lunar Regolith Space Weathering Relative to Latitude and Wavelength, Europlanet Science Congress 2026, The Hague, The Netherlands, 7–11 Sep 2026, EPSC2026-310, https://doi.org/10.5194/epsc2026-310, 2026.
The lunar radiation environment presents harsh conditions for both manned and unmanned lunar missions due to the lack of atmospheric and magnetic shielding from primary radiation, such as solar energetic particles and galactic cosmic rays. These highly energetic particles pose a significant risk for both biological tissue and electronics, and therefore set constraints on shielding, mission duration and material choices.
During impact on the lunar regolith, secondary radiation in the form neutrons, protons, electrons and gamma rays is generated and partially emitted from the lunar surface. This contributes to the overall radiation level experienced by humans and spacecraft near the lunar surface. Secondary radiation measurements therefore grow increasingly relevant with the current international efforts to return to the Moon and establish manned lunar bases within the next decade.
Due to specific absorption and emission lines from each element altering the regolith’s response to primary radiation, secondary radiation measurements are capable of determining elemental abundances in the lunar regolith. Gamma-ray and neutron spectroscopy (GRNS) can quantify abundances of elements, such as H, Fe, Mg, Si, Al, Na, O and Ti. GRNS methods can be applied both from orbit – for course mapping of larger areas, and on rovers for localizing resources on a much finer scale. Mapping reserves of such elements enables in-situ resource utilisation and resource mining, as it supports the identification of landing sites with suitable resources.
To predict the local radiation environment and prepare elemental abundance mapping missions, we developed a simulation toolkit of the interaction between primary cosmic rays and the lunar regolith, in addition to the subsequent secondary radiation response. Given primary radiation spectra from cosmic ray models, such as CREME96, the DLR GCR model1, and SAPPHIRE, the particle propagation in the lunar regolith is simulated using Geant4 with BDSIM2. Responses are determined for variations in lunar regolith properties including elemental soil composition, hydrogen content, temperature, as well as changes in primary radiation spectra. Figure 1 shows the block diagram of the simulation toolkit.
Figure 1 Lunar Secondary Radiation Simulation Toolkit Concept
Predicted secondary radiation spectra variations, such as epithermal neutron depletion or presence of spectral lines for different soil and irradiation conditions such as shown in Figure 2, provide crucial data for both instrument design and data processing of future GRNS missions, such as the Gamma-Ray-including-Neutrons Spectrometer (GRiNS)3 that was proposed onboard the SER3NE mission4. Our toolkit predicts the secondary radiation flux in a given orbit, and with that contributes to the dimensioning of the active detection area and anti-coincidence shield needed.
Figure 2 Neutron flux for various hydrogen contents in FAN. Epithermal neutrons within orange marked energy range as defined from Gd cut-off to fast neutron range
Secondary radiation flux predictions furthermore provide insight into the surface radiation environment on the lunar surface and can aid in manned and unmanned lunar mission planning by predicting more precise radiation doses and analysing the effect of soil compositions on the local radiation environment, such as ground level enhancement effects.
In this report, we introduce our simulation framework, verify the results, and demonstrate its application potential on the example of the GRiNS instrument in the SER3NE orbit.
Acknowledgements
We would like to thank our colleagues Sam Holdcroft and Rebecka Wahlén at UiO/CENSSS for the input on the GRiNS instrument, and Stephanie Werner at UiO/PHAB and the SER3NE team for the mission details, science objectives and their discussions and reviews.
References
1) Daniel Matthiä, Thomas Berger, Alankrita I. Mrigakshi, Günther Reitz. A ready-to-use galactic cosmic ray model. Adv Space Res. 2013;51(3):329-338. doi:10.1016/j.asr.2012.09.022
2) Nevay LJ, Boogert ST, Snuverink J, et al. BDSIM: An accelerator tracking code with particle–matter interactions. Comput Phys Commun. 2020;252:107200. doi:10.1016/j.cpc.2020.107200
3) Kohfeldt A, Wahlén R, Holdcroft S, Teodoro LFA, Werner S. Element Abundance Mapping with the SER3NE Gamma-Ray and Neutron Spectrometer. Copernicus Meetings; 2025. doi:10.5194/epsc-dps2025-1439
4) Werner SC. The SER3NE Mission to Hunt for Water and Other Volatiles on the Moon. Copernicus Meetings; 2025. doi:10.5194/epsc-dps2025-1451
How to cite: Eschler, J., Herbst, K., and Kohfeldt, A.: Lunar Secondary Radiation Soil Response Toolkit and Applications for GRNS, Europlanet Science Congress 2026, The Hague, The Netherlands, 7–11 Sep 2026, EPSC2026-126, https://doi.org/10.5194/epsc2026-126, 2026.
South Korea’s first lunar probe, the Korea Pathfinder Lunar Orbiter (KPLO, DANURI), was launched in August 2022 and successfully entered lunar orbit in December of the same year. KPLO is currently conducting a mission with the KPLO Gamma-Ray Spectrometer (KGRS), developed by the Korea Institute of Geoscience and Mineral Resources (KIGAM). KGRS detects gamma-ray energies from 30 keV to 12 MeV and consists of a LaBr3 gamma-ray spectrometer and a Boron-Loaded Plastic Scintillator (BLPS) containing 5 % boron for background rejection. The primary scientific objective of KGRS is to collect gamma-ray spectral data from the lunar surface and to produce elemental abundance maps, which provide critical constraints on the bulk composition of the lunar surface and subsurface. Such elemental maps are directly relevant to the planning of future in situ robotic and human exploration missions, including site selection for resource utilization and ground-truth validation of orbital datasets.
KGRS data are processed through multiple steps, including positional data integration and exclusion of unusable data, in order to make them suitable for scientific analysis. KGRS data are currently available to the public through the KARI Planetary Data System (KPDS) website in Raw, PP, and CAL formats. All KGRS data transmitted to KIGAM are monitored daily, tracking both engineering parameters (e.g., instrument temperature) and science data, enabling the detection of transient events such as solar flares and gamma-ray bursts.
Since 2023, KGRS has accumulated more than three years of continuous gamma-ray spectral data from the lunar surface. The total gamma-ray count decreased by approximately 15% between 2023 and 2025. The decreasing trend is consistent with enhanced heliospheric modulation during the approach to solar maximum, which suppress the galactic cosmic-ray (GCR) flux responsible for inducing lunar gamma-ray emissions.
The orbit of KPLO was modified twice in 2025. Following initial operations in a near-circular orbit at approximately 100 km altitude, the orbit was lowered to approximately 60 km in February 2025. In late September 2025, KPLO transitioned into a frozen orbit with altitudes ranging from approximately 60 to 200 km.
This presentation reports on how KGRS spectral data vary as a function of time and changing mission environments, including orbital altitude modifications, over the course of the KPLO mission, and discusses the scientific implications of long-term lunar gamma-ray datasets in support of future lunar landing-site selection and exploration planning.
How to cite: Kim, S., Kim, K. J., and Hong, I.: Temporal Variations in KGRS Gamma-Ray Data over the KPLO/DANURI Mission, Europlanet Science Congress 2026, The Hague, The Netherlands, 7–11 Sep 2026, EPSC2026-427, https://doi.org/10.5194/epsc2026-427, 2026.
Introduction
The lunar poles have been identified as key targets for future lunar missions because of the presence of Permanently Shadowed Regions (PSRs), which are thought to uncover large quantities of water ice. In this context, upcoming missions plan to carry Full-Polarimetric Ground Penetrating Radars (FP-GPR), such as the Chang’E 7 Lunar Penetrating Radar [2], and the Lunar Ground Penetrating Radar (LGPR), currently in development at LATMOS [9]. This work focuses on showing the benefit of GPR polarimetric observations for the interpretation of the radargrams in terms of subsurface structures.
CPR: a radar signature of water ice?
The lunar PSRs are located near the poles, where the low obliquity of the Moon with respect to the ecliptic plane prevents direct sun illumination. As a result, the interior of these craters can reach extremely low temperatures, forming long-term cold traps in which water ice may accumulate over geological timescales.
Although the presence of water ice has been confirmed at the surface of the PSRs [1], its occurrence in the subsurface remains under investigation. In 2009, the LCROSS (Lunar Crater Observation and Sensing Satellite) mission crashed a rocket into the Cabeus crater, revealing water in the ejecta plume [3]. Since then, numerous instruments have scrutinized the PSRs, searching for buried water ice.
Synthetic Aperture Radars (SARs), such as Lunar Reconnaissance Orbiter’s Mini-RF or DFSAR onboard Chandrayaan-2, have revealed anomalously high values of Circular Polarization Ratio (CPR) within the PSRs, and have sparked a debate, as they may indicate the presence of water ice, either as a matrix with rocky inclusions or as inclusions within the lunar regolith [8]; but could also arise from depolarizing phenomena unrelated to water ice, such as surface roughness or angular scatterers [7].
Here, the objective is to investigate how in situ FP-GPR measurements can contribute to a better understanding and interpretation of radar polarimetric products, including the CPR.
WISDOM / LGPR, two in-situ FP-GPR
Depending on their operating frequency, FP-GPRs can probe the subsurface to depths ranging from few meters to kilometers, and with vertical resolution spanning from few centimeters to meters. For instance, WISDOM (Water Ice Subsurface Deposit Observation on Mars), the FP-GPR of the ExoMars Rosalind Franklin rover mission, is designed to probe Mars shallow subsurface with a vertical resolution of few centimeters [6]. At LATMOS (France), a successor to WISDOM is currently under development for lunar exploration. Called LGPR, it will operate at lower frequencies to probe larger depths. Given the strong similarities between the two instruments and the availability of data from previous field tests, this study uses WISDOM as the basis for numerical simulations of FP-GPR measurements.
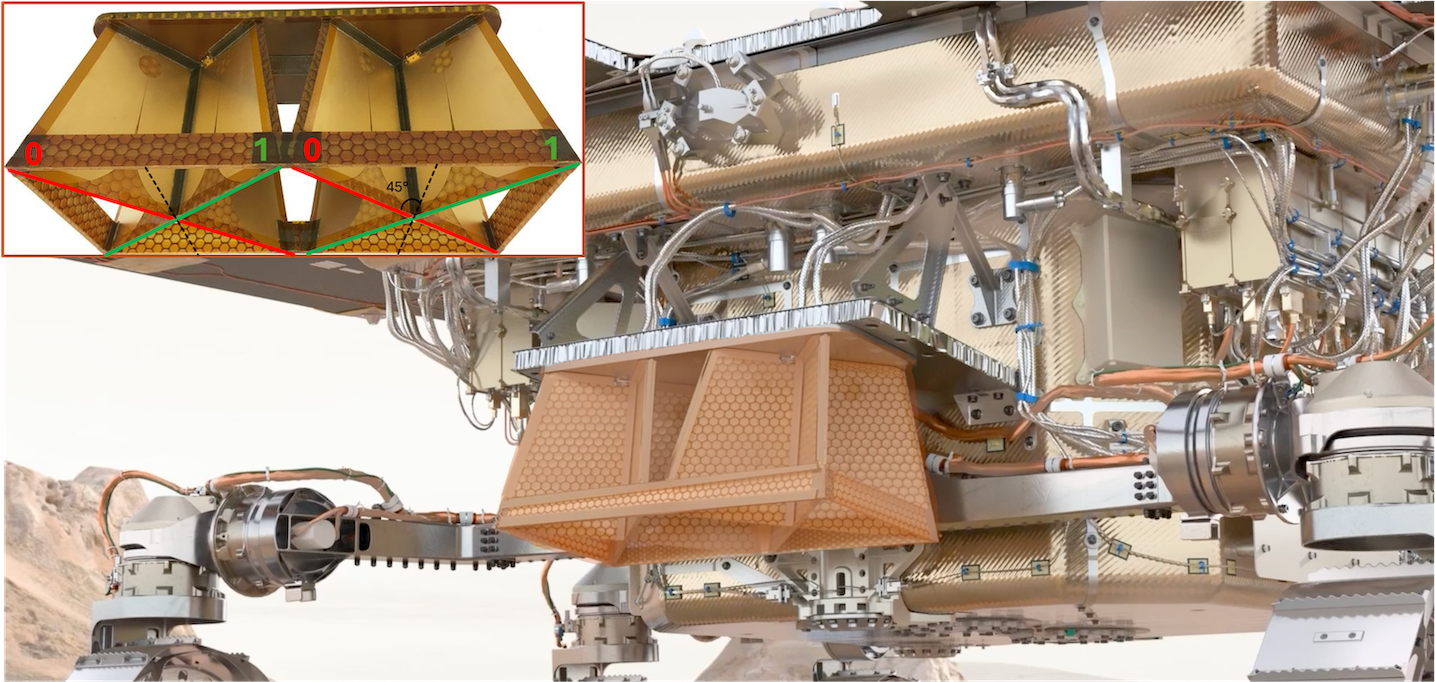
WISDOM is an FP-GPR that operates from 0.5 to 3 GHz. It can transmit and receive in two orthogonal directions of polarizations, providing four polarimetric configurations: 00, 01, 10 and 11 (Fig. 1).

Figure 1: Polarimetric configurations and illustration of WISDOM mounted on the Rosalind Franklin Rover.
Methodology
FP-GPRs can derive a wide range of polarimetric observables, including the CPR, by computing the Stokes Parameters, which are independent of the polarization basis [4]. However, FP-GPRs are often wideband instruments, providing one CPR value for each operating frequency, while orbital radars yield a single CPR value per observation.
As a result, FP-GPRs offer a three-fold analysis of the CPR, developed and investigated for WISDOM/LGPR using numerical simulations and experimental data:
- CPR as a function of frequency
- CPR averaged on the whole frequency band
- Subsurface CPR mapping
A previous study on CPR in icy media containing air and rock inclusions showed that CPR increases both with the number of inclusions, consistent with increasing depolarization phenomena, and with frequency [10]. Building on these results, the present work focuses on the development of subsurface CPR mapping.
Results: from simulations to experimental data
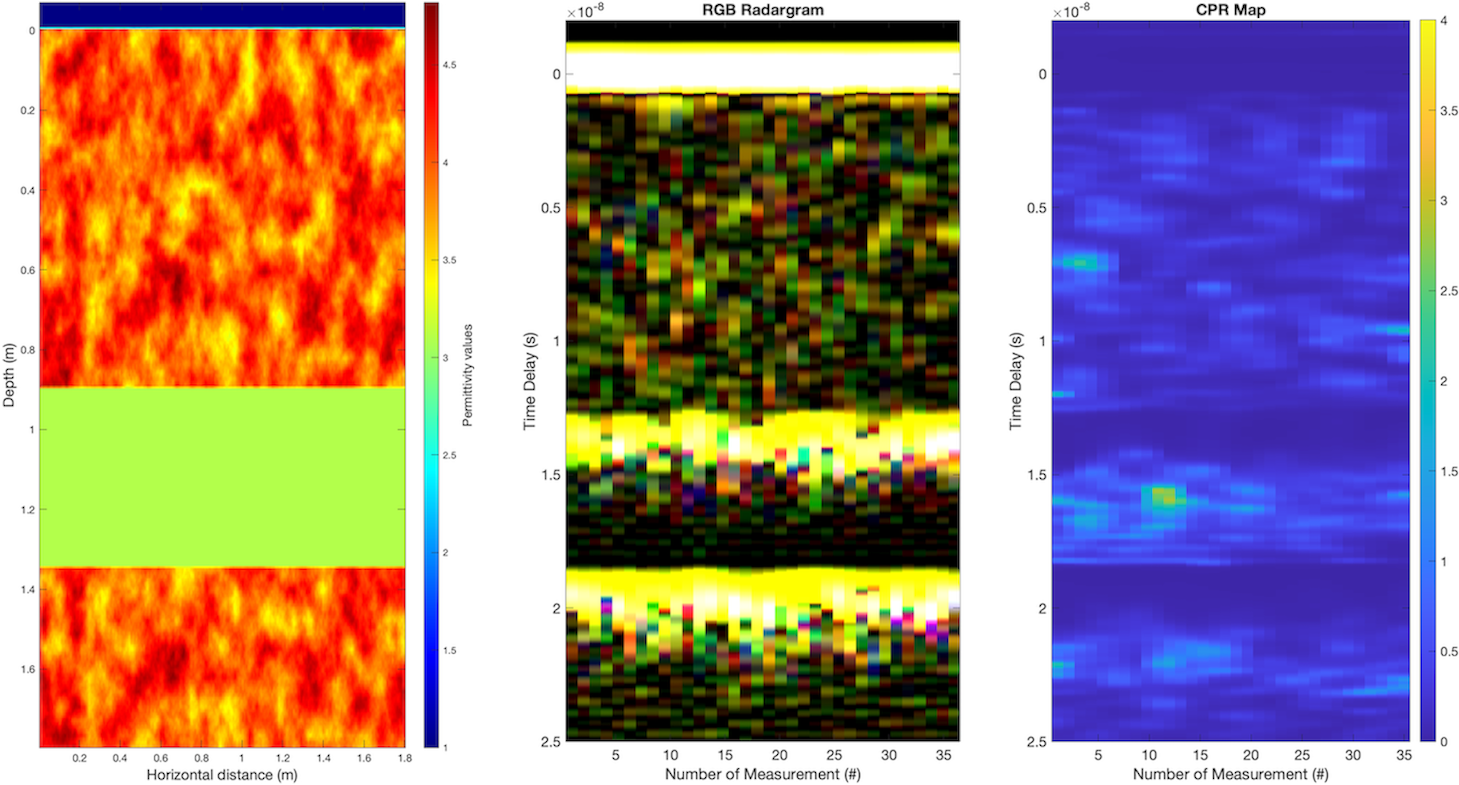
The CPR subsurface mapping approach was tested on simple simulated environments. Figure 2 compares the permittivity distribution of a medium, with heterogeneous/homogeneous layers and smooth interfaces, its RGB radargram (a false-color radargram with 00 in Red, 11 in Green and the average of 01 and 10 in Blue), and the corresponding CPR subsurface map. Smooth interfaces appear yellow in the RGB radargram, and are associated with low CPR values, consistent with weak depolarization. In contrast, heterogeneities produce partial depolarization, appearing cyan or magenta and corresponding to higher CPR values.

Figure 2: Permittivity distribution, RGB radargram, and CPR map of the simulated medium.
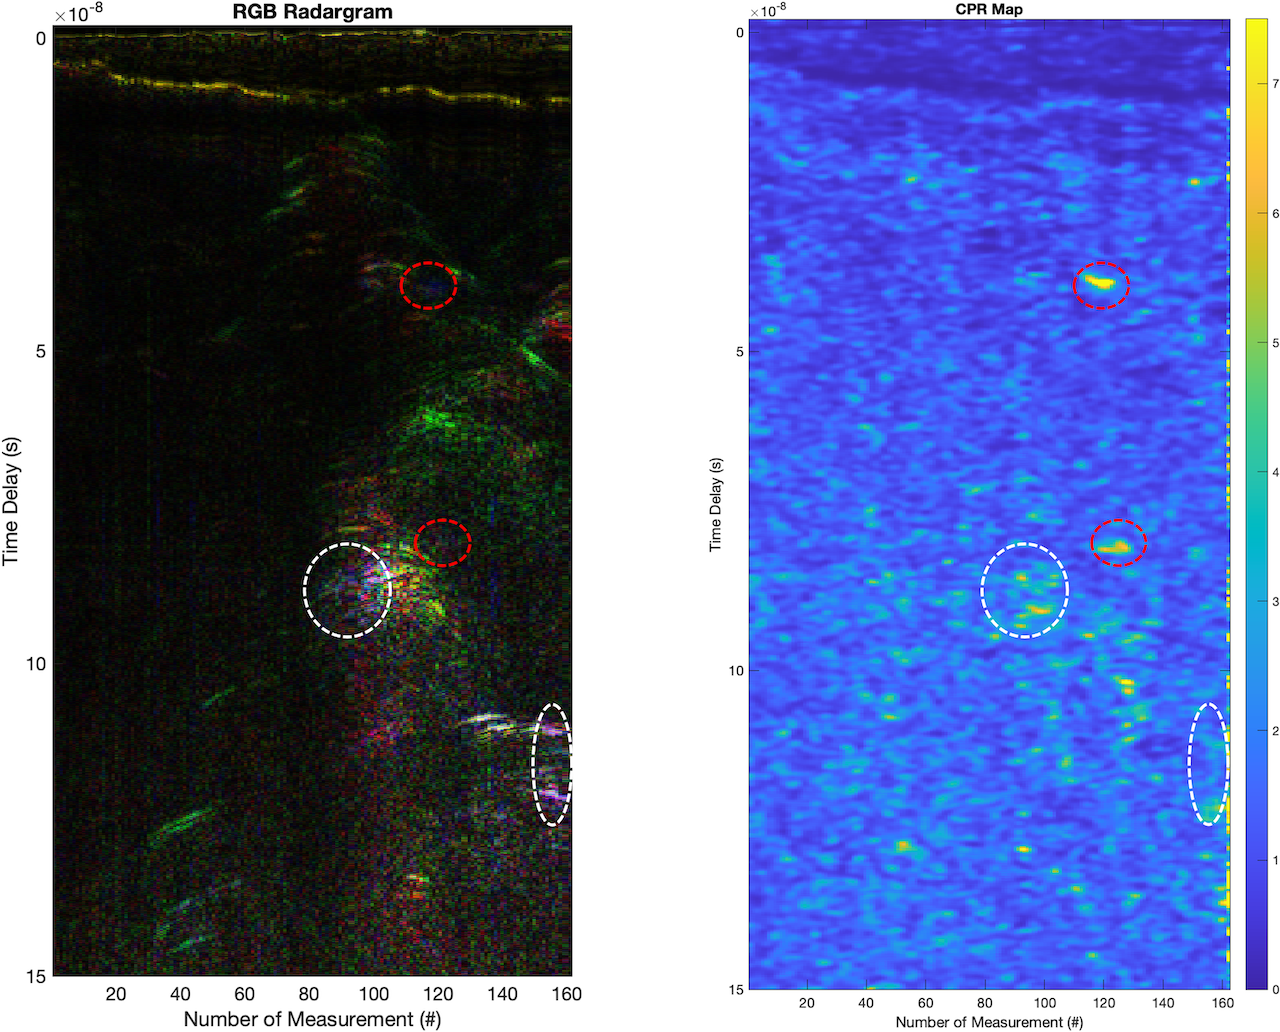
Finally, the subsurface mapping approach was applied to polarimetric data acquired during a WISDOM field test in Svalbard (Arctic Norway), focusing on a profile collected above the meanders of a buried ice cave. Figure 3 shows four regions exhibiting clear depolarization signatures:
- Two regions identified as the ice cave meanders, and a potential meltwater channel (white dashes in Fig. 3). [5]
- Two additional regions of depolarization, difficult to identify in the RGB radargram due to weaker intensity (red dashes in Fig. 3), requiring further investigation.

Figure 3: RGB radargram of the ice cave profile, and corresponding CPR map.
These results show the need for a combined quantitative and qualitative approach to identify regions of depolarizations and the complementarity of polarimetric observables.
Conclusion
Results from simulations and experimental data show the advantage of using polarimetric data to better understand subsurface depolarization phenomena from complex media. Next steps involve mapping other polarimetric products such as the degree of polarization, or polarimetric decompositions, but also comparing orbital datasets from Mini-RF with numerical simulations of CPR subsurface maps resulting from FP-GPR measurements at the surface of craters, and orbital simulations.
References
[1] Li et al., 2018, PNAS, 115, 36
[2] Shen et al., 2025, Space Sci Rev, 221, 98
[3] Colaprete et al., 2010, Science 330, 463–468
[4] Raney et al., 2011, IEEE, 99, 808-823
[5] Brighi et al., 2026, submitted in Geophysics
[6] Ciarletti et al., 2017, Astrobiology, 17(6-7), 565–584
[7] Fa et al., 2013, JGR, 118(8), 1582-1608
[8] Spudis et al., 2013, JGR, 118(10), 2016-2029
[9] Le Gall et al., 2026, ELS 2026
[10] Harrar et al., 2025, EPSC-DPS 2025
How to cite: Harrar, L., Le Gall, A., Ciarletti, V., Brighi, E., Hervé, Y., Oudart, N., and Brighi, G.: Towards subsurface mapping of polarimetric products from Full-Polarimetric Ground Penetrating Radar in situ measurements, Europlanet Science Congress 2026, The Hague, The Netherlands, 7–11 Sep 2026, EPSC2026-468, https://doi.org/10.5194/epsc2026-468, 2026.
The Indian Space Research Organisation’s (ISRO) Chandrayaan-2 lunar mission carries the Dual-Frequency Synthetic Aperture Radar (DFSAR), which acquires fully polarimetric (quad-pol) observations at L- and S-band wavelengths [1]. This format measures the full scattering matrix for each pixel (HH, HV, VH and VV) enabling a range of polarimetric decompositions to be used to characterise surface and near-subsurface scattering mechanisms. At the lunar south pole where low solar incidence angles create many permanently shadowed regions (PSRs), radar provides a key means of investigating these otherwise inaccessible environments.
Given the capabilities of DFSAR, Cabeus crater was chosen for this study as it was designated as a site of interest in a study completed by Lemelin et al. [2], and the selected swath also intersects with a large PSR. The analysed area is close to the LCROSS Centaur stage impact site where near-infrared absorption spectra attributed to water vapour and ice, and ultraviolet emissions attributable to hydroxyl radicals were detected in the impact plume debris [3]. The crater itself is one of the coldest craters on the Moon [3], and has a substantial fraction of water equivalent hydrogen (WEH) content of values around 0.5%wt [4].
The chosen DFSAR single look complex (SLC) swath was processed within PyPolSARPro to generate Pauli, Cloude-Pottier, Yamaguchi 4-component, and target scattering vector model (TSVM) decompositions, enabling the comparison of the scattering responses. A polarimetric whitening filter (PWF) was also used to create an image where heterogeneous areas were isolated and highlighted against the background. For example, the volumetric component of the Y4R decomposition, originally developed to represent randomly oriented vegetation scatterers, was used to understand the volumetric return of surface and near-subsurface regolith. Finally, a ratio of the Y4R odd and volume components was used to generate a surface classification map identifying areas of dominant surface, dominant volume, and mixed return in a discrete and quantifiable way.
As shown in Fig.1, the Pauli RGB image indicates surface scattering as the dominant mechanism across the region. An enhanced volumetric signal is associated with the crater walls, which is consistent with buried boulders, blocky material or potentially volatile-bearing regolith. This is reinforced by the Y4R decomposition, which identifies a reduction in surface scattering and more volume scattering across the crater walls. Regions located south of the crater are characterised by smoother, surface-dominated scattering. In contrast, the region north of the crater exhibits enhanced heterogeneity, with strong volumetric signals associated with the rims of smaller impacts. Analysis of the PWF image further highlights the northern region’s heterogeneity and enhances linear features in the crater walls.
Fig.2 presents the resulting surface classification map. The northern region is predominantly volume dominated, whereas the smoother southern region is consistent with the Y4R surface component as seen in Fig.1. By categorising scattering behaviour into discrete regimes, ratio maps enable easy identification of regions where surface and subsurface heterogeneity may indicate volatile-bearing or structurally complex regolith. This can therefore support site prioritisation for future lunar exploration and in situ investigation.
We acknowledge the use of data from the Chandrayaan-II, second lunar mission of the Indian Space Research Organisation (ISRO), archived at the Indian Space Science Data Centre (ISSDC). This work was supported by the UK Space Agency and the Science and Technology Facilities Council [grant number: UKRI2555].
[1] Bhiravarasu et al., 2021, Planetary Science Journal; [2] Lemelin et al., 2021, Planetary Science Journal; [3] Colaprete et al., 2010, Science; [4] Sanin et al., 2015, Icarus
How to cite: McVann, P., Marino, A., Ghail, R., Gallardo i Peres, G., Mason, P., and Knight, C.: Comparison of Polarimetric Decomposition Techniques for Scattering Classification in Cabeus Crater. , Europlanet Science Congress 2026, The Hague, The Netherlands, 7–11 Sep 2026, EPSC2026-1034, https://doi.org/10.5194/epsc2026-1034, 2026.
Please decide on your access
Please use the buttons below to download the supplementary material or to visit the external website where the presentation is linked. Regarding the external link, please note that Copernicus Meetings cannot accept any liability for the content and the website you will visit.
Forward to presentation link
You are going to open an external link to the presentation as indicated by the authors. Copernicus Meetings cannot accept any liability for the content and the website you will visit.
We are sorry, but presentations are only available for conference attendees. Please register for the conference first. Thank you.
The cumulative effects of impact cratering on the Moon have given rise to a surficial fine-grained impact gardened regolith that is 10s of meters thick, along with deeper layers of thick impact ejecta and in situ fractured crust. Collectively, the thick ejecta deposits and underlying fractured crust are referred to as the megaregolith, but its physical properties and thickness remain poorly understood. Impact generated porosity can affect the bulk density, seismic velocities, and thermal conductivity of the crust. Knowledge of how porosity varies with depth and with location is thus important for understanding the Moon’s impact history, geologic evolution and thermal evolution.
The gravity field of a planet is directly related to its internal density structure, and the high-resolution measurements made by the Gravity Recovery and Interior Laboratory (GRAIL) mission allow to investigate how density (and by inference porosity) varies both laterally and with depth in the crust. The work of Besserer et al. (2014) made use of an early GRAIL-derived gravity model to invert for the depth dependence of density in thecrust using assumed linear and exponential density profiles. Since then, substantially improved gravity models have been developed using the complete set of observations collected by the GRAIL mission. Recent models reach spherical harmonic degrees as high as 1200 (Goossens et al., 2020), 1500 (Konopliv et al., 2014), and even 1800 (Park et al., 2025). These new gravity models, combined with improved analysis techniques, allows us to revisit the subsurface density structure of the Moon.
In this study, we employed a localized spectral analysis method (Wieczorek & Simons, 2005; 2007) to compute the effective density spectrum which was then used to constrain the depth dependence of density in the lunar crust. We restricted our analyses to the polar regions where the quality of the gravity field was best. In contrast to previous studies that imposed a density profile of a specific form, we assumed that the density structure could be approximated by Nconstant density layers, and we investigated models with 2 to 5 independent layers. As a result of the large number of inversion parameters, we used a Bayesian inversion approach with a Markov Chain Monte Carlo sampling of the density profiles. For our localized analyses we used a spherical cap size of 15° with a spectral bandwidth of 43 and employed 14 windows with concentration factors greater than 0.99. When computing the misfit between the model and observations, we used spherical harmonic degrees between 250 and 780, in contrast to 250 to 550 as used in the earlier study by Besserer et al. (2014). For the model results presented here, we only use density profiles increasing with depth.
Our results reveal a distinct two-layer density structure near both poles (see Figure 1 for an example centered on the South Pole). The models are characterized by an upper megaregolith layer that is about 1-2 km thick with porosities of ~15–20% and a less porous underlying layer with porosities of 7-13%. These two layers are interpreted as being composed of allochthonous impact ejecta and autochthonous in situ fractured crust, respectively. The depth of the lower layer extends to at least 11 km, beyond which our inversion approach loses sensitivity to density. We show these porosities substantially reduce crustal bulk seismic velocities and thermal conductivity.
Figure 1. Posterior distributions of density as a function of depth for layered models centered over the South Pole, where density is constrained to increase with depth. Panels (a) to (d) show the results for 2-, 3-, 4-, and 5-layer models, respectively. The yellow line in each subplot indicates the median density as a function of depth; the solid and dashed red lines represent the maximum posterior density and its uncertainty in the high- and low-density groups, and the solid and dashed horizontal green lines represent our estimate of the transition depth and its uncertainty. Density and depth were sampled in the ranges of 1000–4000 kg/m³ and 0–50 km, respectively.
Reference:
Besserer, J., Nimmo, F., Wieczorek, M. A., Weber, R. C., Kiefer, W. S., McGovern, P. J., Andrews‐Hanna, J. C., Smith, D. E., & Zuber, M. T. (2014). GRAIL gravity constraints on the vertical and lateral density structure of the lunar crust. Geophysical Research Letters, 41(16), 5771–5777.
Goossens, S., Sabaka, T. J., Wieczorek, M. A., Neumann, G. A., Mazarico, E., Lemoine, F. G., Nicholas, J. B., Smith, D. E., & Zuber, M. T. (2020). High‐Resolution Gravity Field Models from GRAIL Data and Implications for Models of the Density Structure of the Moon’s Crust. Journal of Geophysical Research: Planets, 125(2), e2019JE006086.
Konopliv, A. S., Park, R. S., Yuan, D., Asmar, S. W., Watkins, M. M., Williams, J. G., Fahnestock, E., Kruizinga, G., Paik, M., Strekalov, D., Harvey, N., Smith, D. E., & Zuber, M. T. (2014). High‐resolution lunar gravity fields from the GRAIL Primary and Extended Missions. Geophysical Research Letters, 41(5), 1452–1458.
Park, R. S., Berne, A., Konopliv, A. S., Keane, J. T., Matsuyama, I., Nimmo, F., Rovira-Navarro, M., Panning, M. P., Simons, M., Stevenson, D. J., & Weber, R. C. (2025). Thermal asymmetry in the Moon’s mantle inferred from monthly tidal response. Nature, 641, 1188–1192.
Wieczorek, M. A., & Simons, F. J. (2005). Localized spectral analysis on the sphere. Geophysical Journal International, 162(3), 655–675.
Wieczorek, M. A., & Simons, F. J. (2007). Minimum-variance multitaper spectral estimation on the sphere. Journal of Fourier Analysis and Applications, 13(6), 665–692.
Wieczorek, M. A. (2024). Lunar shape models (LDEM_shape_pa) [Dataset]. SHTOOLS. https://shtools.github.io/SHTOOLS/python-datasets.html.
How to cite: Yang, J. and Wieczorek, M.: Density structure of the Moon’s crust beneath the polar regions as revealed by gravity data., Europlanet Science Congress 2026, The Hague, The Netherlands, 7–11 Sep 2026, EPSC2026-729, https://doi.org/10.5194/epsc2026-729, 2026.
PROSPECT Overview: The Package for Resource Observation and in-Situ Prospecting for Exploration, Commercial Characterisation and Testing (PROSPECT) is a payload in development by ESA for use at the lunar surface. PROSPECT is being prepared for flight to the lunar south polar region as part of the NASA CLPS program.
PROSPECT will perform an assessment of the volatile inventory in the near surface lunar regolith (down to ~1 m), and complete elemental and isotopic analyses to determine the abundance and origin of any volatiles discovered. PROSPECT also has ISRU capabilities and will aim to complete in-situ extraction of oxygen (and solar wind implanted volatiles) from lunar minerals, which will constitute potential science return from anywhere on the Moon.
PROSPECT is comprised of the ProSEED drill module and the ProSPA analytical laboratory plus the Solids Inlet System (SIS), a carousel of sealable ovens for evolving volatiles from regolith. The ProSEED drill is capable of collecting two icy samples of different sizes and mechanical properties in a single sampling operation, one of up to 45 mm3 and a second up to 8 cm3, with the smaller sample delivered to ProSPA for analyses. The drill rod also has integrated temperature sensors and a sensor to measure the electrical permittivity of the lunar soil along the borehole to give an indication of the presence of water ice and small subsurface structures in the surrounding regolith.
The ProSPA laboratory will receive samples from the drill, seal them in miniaturized ovens, and process them via ramped (EGA), stepped (isotopic) or single step (ISRU) heating up to ~1000 °C, completing physical and chemical processing of released volatiles, and analyzing the obtained constituents via Ion Trap (ITMS) or Magnetic Sector (MS) mass spectroscopy.
ProSEED and ProSPA will also each carry small cameras. The ProSEED Imaging System (IS) has multispectral capabilities via 6 LEDs, which can illuminate the surface with wavelengths ranging from 451 to 970nm. This will provide images and ‘video’ of the drill working area to monitor activities and deliver contextual scientific information. ProSPA’s Sample Camera (SamCam) has its own specific illumination unit with similar capabilities to the ProSEED IS and will image the samples before they are sealed in the ovens, providing information on their morphology, grain size, volume and mineralogy.
Operations Planning: PROSPECT Science Team (ST), led by the ESA Project Scientist, comprises ~40 experts within Europe, including 8 ‘Investigation Leads’. Together, the ST is responsible for supporting all activities related to the scientific exploitation of PROSPECT instrumentation. Recent focus has been on developing nominal operational scenarios that will allow PROSPECT to achieve its high priority science objectives and maximise science return within the tight operational constraints available. Two fundamental operational scenarios have been defined, depending upon whether regolith at the landing site is found to be icy or dry.
Conceptually, operations for PROSPECT will be ‘front-loaded’ for science, pushing for high impact science activities and the highest priority science objectives as early as possible rather than building up towards them. This is mainly driven by the limited operational lifetime on the lunar surface, which will also mean that there will be very little operator interaction and limited tactical planning available.
The baseline plan includes two ‘vertical surveys’, each of which includes the acquisition and analysis of 4 subsurface samples. The general pattern of activities would be to run an ‘Evolved Gas Analysis’ on the first sample using the ion trap (ITMS), and then a magnetic sector (MS) analysis on the second sample which is taken from a similar depth. In combination, this would provide a complete chemical analysis with abundance and isotopic measurements for key species at that depth in the borehole. For the very first sample, the ISRU demonstration would also be attempted after the EGA, in order to maximise the use of that sample.
Samples 3 and 4 would follow a similar pattern with an EGA followed by MS, but they would be acquired deeper than the initial samples. The permittivity sensor is embedded in the drill ~40cm from the drill tip, and will be used regularly as the drill descends below 40cm. This sampling pattern will allow PROSPECT to explore the vertical distribution of various species within the borehole, which is one of the payload’s primary objectives. With these 4 sampling and analysis sequences, the first ‘vertical survey’ is complete.
A second borehole would follow a similar operational pattern but with different sampling depths, and provide lateral profiling for any ices, volatiles and species of interest. In combination, the two vertical surveys would allow for PROSPECT to meet its priority objectives. An additional ISRU demonstration may be attempted in the second borehole at a different depth to the original in order to explore the impact of grain size on the process.
The differences between the icy and dry scenarios will primarily be in the various parameters and instrument modes used. The dry scenario may also allow for ‘hot’ operations, with fewer cooling periods required to manage icy volatile loss.
The high level plan will be further detailed as PROSPECT builds towards operations, defining the parameters to use for sampling depths, oven heating profiles, gas processing etc. This will also allow for more fine tuning of the priorities.
Additional Science Team Activities: The Science Team will also be completing several activities in support of the operations planning and to prepare for data calibration and interpretation. These efforts are needed to support PROSPECT all the way from now through launch, operations, data exploitation, and data archive delivery. Work will include aspects of ground calibrations, testing of command sequences, and end-to-end testing to understand how each aspect of the payload is expected to perform. In addition, data pipelines will be developed to manage the data returned as quickly and effectively as possible, processing the data from telemetry through to a calibrated level.
How to cite: Heather, D. and the PROSPECT Science and Project Team: The ESA PROSPECT Payload: Status and Operations Planning, Europlanet Science Congress 2026, The Hague, The Netherlands, 7–11 Sep 2026, EPSC2026-807, https://doi.org/10.5194/epsc2026-807, 2026.
Introduction: The accurate removal of thermal emission from near-infrared hyperspectral observations is a prerequisite for the reliable detection and quantification of OH/H2O absorptions on the lunar surface. The Moon Mineralogy Mapper (M³), operating aboard Chandrayaan-1 across the 0.43–3.00 µm spectral range [1], is particularly affected by this problem at wavelengths beyond ~2 µm, where thermal contamination can substantially alter the shape and depth of hydration-related absorption features. Lunar surface temperatures vary dramatically over the course of a lunar day, ranging from ~40 to ~400 K [2] as a function of latitude, local solar time, solar incidence angle, surface albedo, and regolith thermophysical properties. Existing thermal correction strategies for M3 data include data-driven approaches [3], laboratory-calibrated empirical models [4], and advanced thermophysical models (TPMs) [5,6]. While each method has demonstrated utility, the laboratory-based empirical approach [4], which remains widely used in both local and global hydration studies, exhibits known limitations in transferability across diverse surface compositions and illumination geometries [7]. TPMs, despite their physical rigor and ability to account for anisothermal effects, remain computationally demanding for both global-scale and local-scale applications. In this context, we present LENNA (Lunar thermal-Emission Neural Network Approach), a supervised Machine-Learning framework for rapid, Diviner-consistent prediction of bolometric temperatures from M³ observations, whose outputs are coupled with a Hapke-based radiative transfer model [8] to retrieve spectral directional emissivity and OH/H2O-related absorption signatures (OHIBD [5] and ESPAT [9]).
Methods and data: LENNA is implemented as a fully connected feed-forward neural network trained to predict Diviner-like bolometric temperatures from geometrical and M³-derived input parameters on a pixel-by-pixel basis. The nine input features combine geometric quantities — latitude, local solar time (LST), and the topographically corrected cosine of the incidence angle — with selected spectral quantities, including the mean reflectance over 0.89–1.62 µm as a proxy for surface albedo, the reflectance values at four spectral channels in the 2.54–2.67 µm range sensitive to residual thermal emission, and the spectral slope between 2.02 and 2.67 µm.
Training targets are Diviner bolometric temperatures [2] derived from spatially and temporally co-registered M3 and Diviner observations, matched within a LST tolerance of ±0.05h. The training dataset encompasses several regions of interest (ROIs) distributed across diverse latitudes, surface compositions, optical maturities, and illumination conditions. Model performance is evaluated via a random split approach and a Leave-One-ROI-Out (LORO) cross-validation strategy. Eight additional spatially independent test ROIs — spanning anorthositic highlands, pyroclastic deposits, and lunar maria — are used to assess generalization capability and the potential influence of spatial or temporal leakage. Predicted bolometric temperatures are subsequently coupled with a Hapke-based radiative transfer formulation to retrieve thermally and photometrically corrected reflectance spectra.
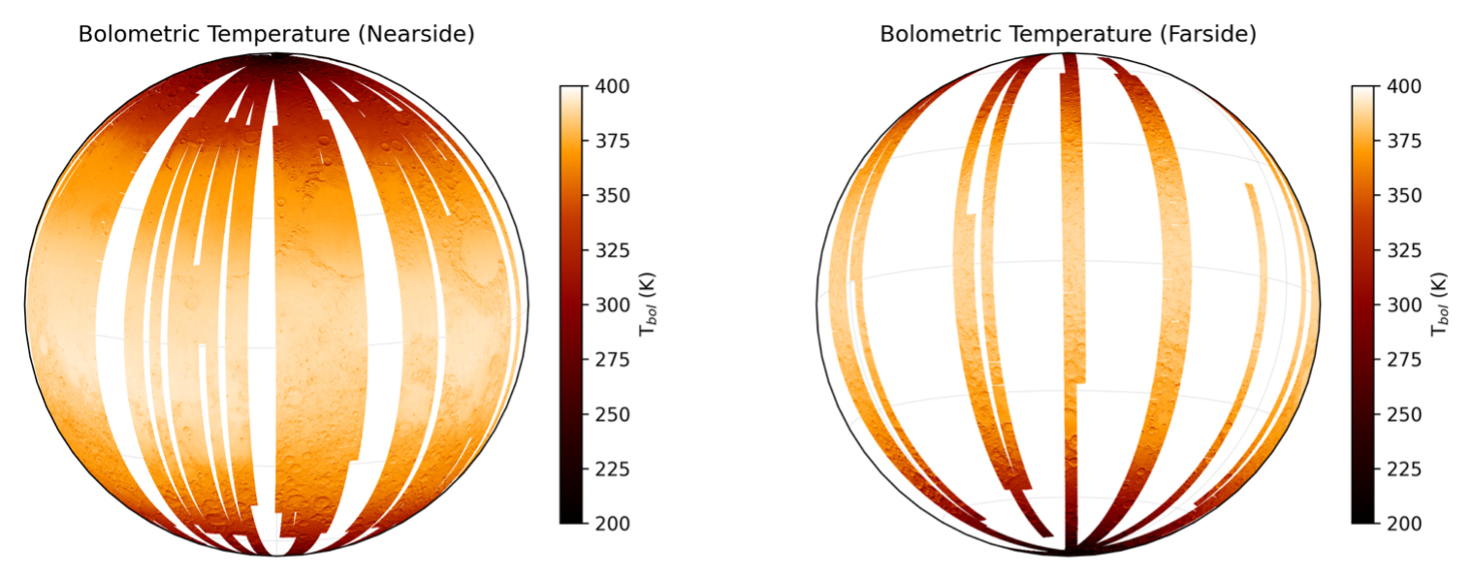
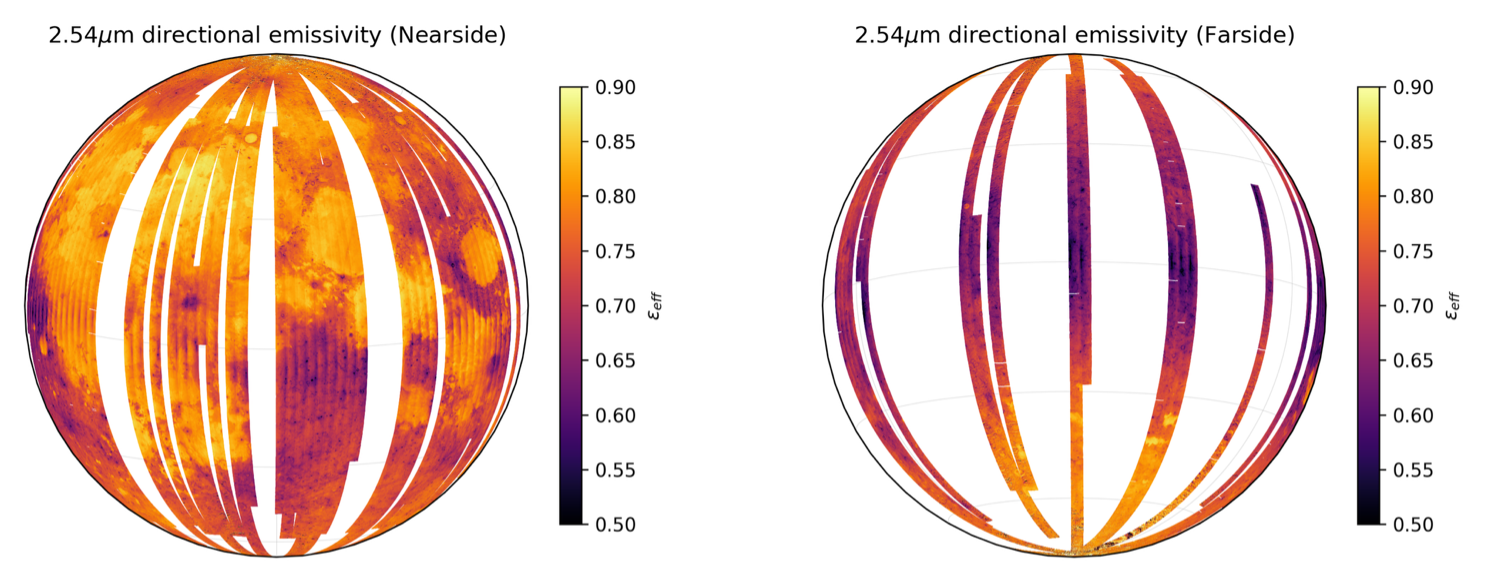
Results and conclusions: LENNA reproduces Diviner-derived bolometric temperatures with high fidelity across all testing ROIs, outperforming the empirical benchmark [4] in terms of both precision and bias. The LORO cross-validation yields an overall standard deviation of ~8.8 K and an RMSE of ~9.4 K, with pixel-level biases remaining below 5 K across all tested regions. Propagation of this uncertainty into thermally corrected reflectance spectra yields maximum absolute uncertainties of approximately ±0.40% at 2.54 µm and ±2.50% at 3.00 µm, at least in testing ROIs. The distribution of normalized reflectance residuals at 2.54 µm is broadly consistent with a near-Gaussian behavior, suggesting that systematic effects remain limited across the tested conditions. The LENNA-predicted near-noon bolometric temperature maps (Figure 1) reproduce the expected trends, in agreement with the global Diviner reference dataset [10]. The 2.54 µm directional emissivity map derived via the Hapke formulation (Figure 2) reveals spatially coherent patterns correlated with surface composition and albedo, consistent with independent mineralogical analyses. Comparison with an advanced TPM [6] over two hydration-rich near-noon regions, such as Copernicus crater and the western border of Mare Crisium, shows broadly consistent spatial distributions of OH/H2O.
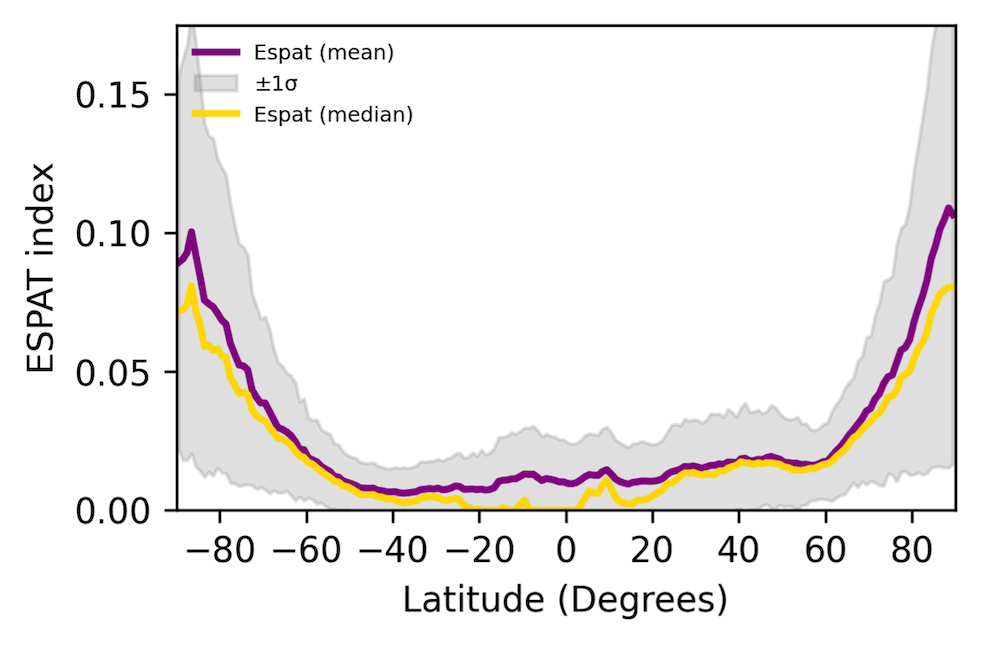
The ESPAT latitudinal profiles derived from LENNA (Figure 3) indicate systematically higher hydroxyl/water abundances than those reported in [9] at the same LSTs, in agreement with previous studies employing physically more complete correction frameworks (e.g., [5,6]).
Although calibrated on M³-derived features, LENNA is potentially transferable to other VIS-NIR imaging spectrometers operating in the same reference domain, provided their spectral range is at least partially overlapping with that of M3. Promising candidates include the Chang'e-5/LMS and Chang'e-6/LMS, Chandrayaan-2/IIRS, and instruments that acquired lunar observations during flyby operations, such as JUICE/MAJIS.
Future developments will aim to map the OH/H2O distribution across the entire lunar surface by expanding the set of representative training ROIs and/or input parameters, in order to better capture data-related effects such as latitudinal/longitudinal striping [5].
Acknowledgments: The authors acknowledge support from the Space It Up project, funded by the Italian Space Agency and the Italian Ministry of University and Research. Contract n. 2024-5-E.0 – CUP n. I53D24000060005.
References:
[1] Green, R.O. et al. (2011) Journal of Geophysical Research, Planets, 116(E10).
[2] Paige, D. A. et al. (2010) Science, 330, 6003.
[3] Clark, R.N. et al. (2011) Journal of Geophysical Research, Planets, 116(E6).
[4] Li, S. & Milliken, R.E. (2016) Journal of Geophysical Research, Planets, 121(10).
[5] Wöhler, C. et al. (2017) Science Advances, 3(9).
[6] Wohlfarth, K. et al. (2023) Astronomy & Astrophysics, 674(A69).
[7] Clark, R.N. et al. (2024) The Planetary Science Journal, 5(9).
[8] Hapke, B. (2005) Theory of Reflectance and Emittance Spectroscopy.
[9] Li, S. & Milliken, R.E. (2017) Science Advances, 3(9).
[10] Williams, J.–P. et al. (2017) Icarus, 283(300-325).

Figure 1. Bolometric temperature maps for both nearside and farside using LENNA on part of near-noon M3 observations (OP2C [1]).

Figure 2. 2.54 µm directional emissivity maps for both nearside and farside using LENNA on part of near-noon M3 observations (OP2C [1]).

Figure 3. The latitudinal trend of the ESPAT parameter computed at ~2.85 µm in analogy with [9].
How to cite: Colaiuta, F., Tosi, F., Zambon, F., Pratesi, G., Baldetti, C., and Bellucci, M.: Retrieving Lunar Bolometric Temperature, Directional Emissivity, and Hydration Signatures with LENNA: A Machine-Learning Framework for Moon Mineralogy Mapper (M3) Data, Europlanet Science Congress 2026, The Hague, The Netherlands, 7–11 Sep 2026, EPSC2026-616, https://doi.org/10.5194/epsc2026-616, 2026.
Introduction:
Permanently shadowed regions (PSRs) of the Moon are thought to act as cold traps for volatiles, due to their extremely low temperatures (<110 K) [1,2].
The Moon Mineralogy Mapper (M3) spectral analysis [3] revealed absorptions of water ice at about 1.25, 1.5, and 2.0 µm in several permanently shadowed areas at both lunar poles. However, latest results based on radiance contrast, obtained by Danuri ShadowCam, [4-7] show that the ice-bearing areas identified by M³ exhibit no significant brightness contrast relative to their surroundings, raising questions about the reliability and interpretation of the previous M³ detections.
In this work, we analyze M³ spectral data to address this apparent discrepancy and reassess the evidence for exposed water ice in lunar PSRs, which represents a key factor for future in situ robotic investigations and human exploration.
Methods:
To search for water ice, we applied a procedure based on the identification of the 1.25, 1.5, and 2.0 µm absorption bands. Pixels were classified as positive water-ice detections when their spectral properties were consistent with thresholds defined using a laboratory spectrum of an intimate mixture containing 5 wt% water ice and 95 wt% lunar highland simulant. To assess the robustness of the detections, we applied the same procedure to non-PSR regions, located between 69°S and 75°S latitude, where water ice is not expected to be stable. Since the analysis relies on very low-signal data, we also evaluated the linearity of the instrument response in these pixels by comparing the spectra of high- and low-signal regions. Finally, we adopted a statistical approach in which a simulated dataset was generated to reproduce the spectral distortions induced by the non-linear instrumental response and noise, in order to determine whether the combination of these effects can account for the apparent ice detections in the M³ data.
Results:
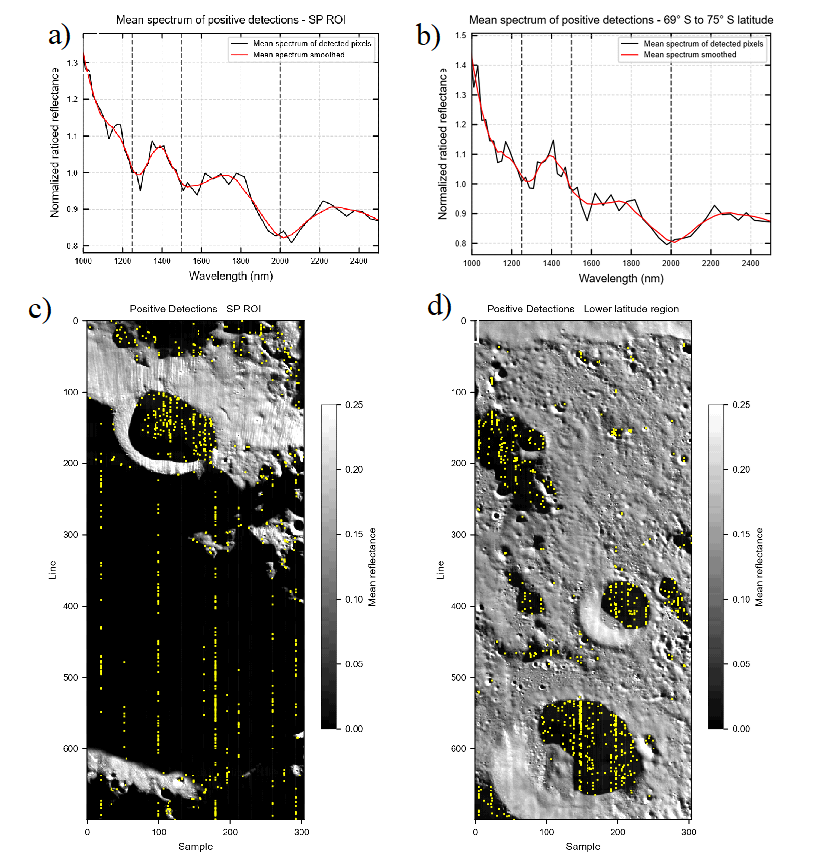
Figure 1 reports the average spectra of the detected pixels within a South Pole Region of Interest (SP ROI; Fig. 1a), including a PSR, and within a lower-latitude region between 69°S and 75°S (Fig. 1b), where surface water ice is not expected [8]. Figures 1c and 1d show the spatial distribution of the detected pixels in the SP ROI and in the lower-latitude region, respectively. The occurrence of the same spectral features in both areas raises serious concerns on the robustness of these detections. In addition, the detected pixels are frequently aligned along individual detector samples, suggesting a link with instrumental effects rather than with localized surface properties. Overall, these results indicate that the apparent water-ice signatures observed at the South Pole are more likely related to data artifacts or systematic effects than to the presence of an actual surface ice deposit.

Figure 1: Mean spectra of the detected pixels are shown in figure (a, b) for the SP ROI and the lower latitude region 69° S - 75° S, respectively. The spectra are normalized to their mean value. Vertical dashed lines in the mean spectra indicate the 1250, 1500 and 2000 nm absorption band positions of water ice [9]. Positive detections (yellow dots) distribution in the SP ROI and in the lower latitude region are shown in panels c and d respectively.
We conducted a linearity analysis of the data and found that spectra become progressively distorted from high to low radiance levels. The shape of the distortion is very similar to the Radiance Calibration Coefficient (RCC) used in the instrument calibration pipeline.
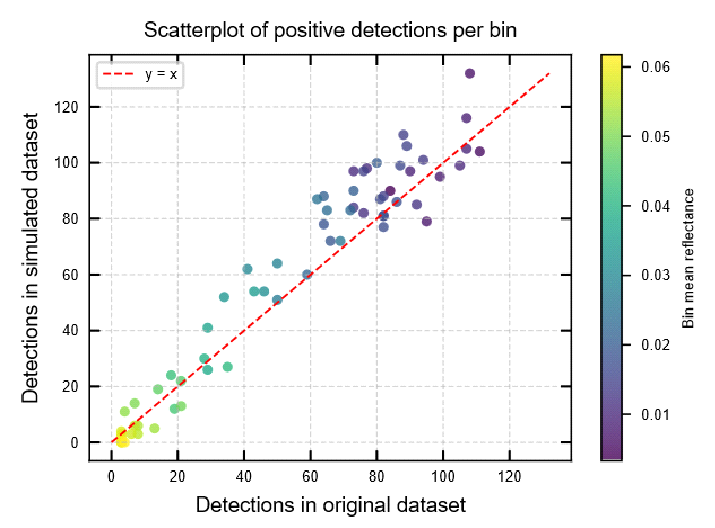
We then carried out a statistical analysis to assess whether random noise, combined with the non-linear spectral response of the instrument, could account for the apparent water-ice detections. To this end, we generated a simulated dataset by applying the non-linear distortion derived from the linearity analysis and injecting M³-like noise. Figure 2 shows the scatterplot between the number of water ice detections in the simulated and in the M³ observation across different reflectance bins.

Figure 2: Detections in simulated and original datasets.
The strong linear anticorrelation between the number of detections and reflectance, observed in both datasets, confirms that the apparent water-ice spectral signatures in the M³ data are more likely produced by instrumental non-linearity than by the presence of surface water ice.
Conclusions:
In conclusion, we show that water ice-like spectral signatures can occur in M³ data even in regions where surface ice is not expected to be stable. Our analysis indicates that these detections can be explained by the combined effects of the instrument’s non-linear spectral response and the low signal-to-noise ratio of the data. However, this work does not rule out the presence of surface or subsurface water ice in lunar PSRs. Rather, it highlights that M³ observations at very low signal levels are affected by instrumental effects that can significantly bias the detection of water-ice signatures. Future in situ investigations of the lunar poles will therefore be crucial to assess the presence and distribution of water ice, by providing complementary datasets, higher signal-to-noise measurements, and instruments specifically designed to operate under extremely low-illumination conditions.
Aknowledgments:
This work is granted by Accordo ASI – INAF n. 2024-64-HH.0.
References
[1] Watson, K. et al. (1961). JGR, 66(9), 3033–3045. [2] Urey, H. C. et al. (1952). Physics Today, 5(8), 12-12. [3] Li, S. et al. (2018). PNAS, 115(36), 8907-8912. [4] Ando, J. et al. (2025). The PSJ, 6(3), 62. [5] Williams, J.-P. et al. PSJ 5, 209 (2024). [6] Mahanti, P. et al. J.A.S.S. 40, 131–148 (2023). [7] Li, S. et al. (2026) Sci. Adv. 12, eaec8211 [8] Hayne et al. (2021), Nature Astronomy 5, 169–175; [9] Clark, R. N. (1981) JGR 86, 3087–3096;
How to cite: Massa, G., De Sanctis, M. C., Altieri, F., Raponi, A., and Besse, S.: On the reliability of Water Ice Signatures in Moon Mineralogy Mapper (M3) Spectral Data, Europlanet Science Congress 2026, The Hague, The Netherlands, 7–11 Sep 2026, EPSC2026-1102, https://doi.org/10.5194/epsc2026-1102, 2026.
The Rashid-2 mission of the Mohammed Bin Rashid Space Centre (MBRSC) is scheduled for launch at the end of 2026 as part of the Firefly Blue Ghost 2 payload. Equipped with three optical cameras, a thermal camera, four Langmuir probes, and a material adhesion / abrasion determination experiment, this ~10 kg rover is similar to the Rashid-1 mission (e.g., Flahaut et al., 2024). Rashid-2 aims to investigate the properties of the lunar regolith, plasma interactions at the lunar surface, and, more broadly, to improve our understanding of the Moon’s formation and evolution.
This study focuses on the geological mapping of the Rashid-2 landing region, located on the northeastern rim of Nassau F crater (177.7° W; 23.82° S). Remote sensing data from the Clementine, Lunar Prospector, LRO (LOLA, WAC, Diviner, Mini-RF), and Kaguya (TC and MI) missions were processed and integrated into a Geographic Information System (GIS), complemented by mineralogical information derived from Chandrayaan-1 M³ spectral imager data.
Our analysis shows that the landing ellipse is located near the boundary between the interior of the basin and its outer rim, also referred to as the heterogeneous annulus of the South Pole-Aitken (SPA) basin. These regions are characterized by distinct lithologies. The landing site is situated on a ridge likely composed of superimposed ejecta from Nassau F (dated at ~4.2 Ga), Orlov Y, Nassau D, and Orlov (dated at ~3.8 Ga), as well as secondary craters potentially originating from the Orientale basin-forming impact (~3.8 Ga).
M³ spectra are relatively featureless or indicative of weak pyroxene signatures, consistent with mature and mixed highland material. Kaguya-derived mineral maps, combined following Frueh et al. (2025), suggest an anorthositic norite to anorthositic gabbro composition. Distinct compositions including gabbros, gabbronorites, and norites are observed in the ejecta of nearby craters such as Birkeland (d = 82 km) and Rumford (d = 61 km), suggesting that SPA impact melt may be present at depths greater than 4 km and could have been excavated in the study region by larger impacts.
Our updated regional geological map, along with new insights into the local crustal stratigraphy, will be presented and discussed at the conference.
How to cite: Flahaut, J., Delvoye, Z., Wöhler, C., Füri, E., and Al Matroushi, H.: The Nassau F Crater Region within the South Pole–Aitken Basin: Geological Context for the Rashid-2 Rover Landing Site, Europlanet Science Congress 2026, The Hague, The Netherlands, 7–11 Sep 2026, EPSC2026-593, https://doi.org/10.5194/epsc2026-593, 2026.
Introduction: Multiple missions are currently planned to explore the lunar south polar region and study the occurrence of water in and around permanently shadowed regions [1]. As part of the Rover Permittivity Sensor (RPS) for the European Space Agency [2,3], a contribution to the Rashid-3 mission [4], we have developed several testbeds to investigate the soil interaction of wheel-based sensors. RPS includes two sensing electrodes on the rover wheel to measure the dielectric permittivity of the lunar soil along the traverse and infer its potential ice content and density. For such contact-based sensors, the mechanical coupling to the soil is a major source of uncertainty in measurement quality. Thus, it is important to characterise this interface with respect to soil sinkage and compaction, considering reduced gravity and the wide range of the particle size distribution. Furthermore, due to the suspected abrasive nature of lunar regolith, mechanical wear is expected at the wheel-soil interface. For missions to the lunar south pole or similar destinations, the extremely wide temperature range of the environment also needs to be considered, as it might alter the mechanical properties. Currently, no standardised environmental testing procedure exists for this scenario. The two custom-designed testbeds presented here allow studying both the geotechnical interaction between the wheel-based sensors and the soil, and the wear over the sensors' lifetime.
Soil interface testbed: The setup features a wheel analogue installed on a movable gantry and can be installed inside a dust-tolerant thermal-vacuum chamber [5]. With this system, the wheel with a functional RPS sensor can be pressed against or rolled over (ice-bearing) regolith samples, while measuring load and displacement. This enables studies of sensor-soil interaction effects on the permittivity measurement, as well as the compaction of the soil. The system is planned to include a gravity-offloading system and a cooled regolith bed, with target temperatures of around 150 K. Fig. 1 shows the initial testing setup for the vertical axis, before integration into a full gantry.
Wear testbed: The setup comprises a turntable platform on which a wheel mock-up can continuously be rolled. Both the turntable and the wheel are motorised, allowing defined slip ratios to be set. The turntable includes a ring-shaped trench, 89 cm in outer radius, filled with regolith simulant, up to 10 cm deep and 13 cm wide. Bigger rocks can also be placed in the trench to simulate higher surface roughness. The wheel is free to move vertically and is offloaded with counterweights to set specific wheel loads for different gravity or rover conditions. Fig. 2 shows the wheel wear testbed after first room temperature tests. A liquid nitrogen evaporation cooling system is being implemented to cool the wheel during operation and test the robustness of wheel and its surface-mounted sensors in a lunar polar environment.
Fig. 1: First iteration of the soli interface testbed vertical axis, used for static sinkage tests
Fig. 2: Wheel wear testbed
Conclusion: The two testbeds provide a combined capability for testing RPS wheel-based sensors with glass-fibre-reinforced polymer (GFRP) caps under various relevant lunar environment aspects (temperature, vacuum, ice-regolith mixtures) and motion types (static, rolling, slip, continuous/steady-state rolling), while studying load, wheel/sensor sinkage, and wear. Furthermore, the testbeds can also be used to study other similar wheel-based systems and materials, making them a useful tool for exploration rover development programs.
Acknowledgments: Part of this work has been performed in the context of the Rover Permittivity Sensor project for the European Space Agency (Contract No. 4000148937/25/NL/PA/dp).
References: [1] Reiss, P. (2024), PNAS, 121(52). [2] Reiss, P. et al. (2025), European Lunar Symposium. [3] Gscheidle, C. et al. (2025), EPSC. [4] Almatroushi, H. et al. (2025), EPSC. [5] Witzel, T. et al. (2025), EPSC.
How to cite: Sesko, R., Laub, P., Sedlmair, F., Chauhan, S., Eckert, L., Gscheidle, C., and Reiss, P.: Experimental investigation of the soil interaction and wear of lunar rover wheel-based sensors, Europlanet Science Congress 2026, The Hague, The Netherlands, 7–11 Sep 2026, EPSC2026-816, https://doi.org/10.5194/epsc2026-816, 2026.
Introduction. This work is carried out within the framework of the LUMIO (Lunar Meteoroid Impact Observer) mission, an ESA 12U CubeSat aimed at detecting and characterizing meteoroid impacts on the lunar far side [1,2]. From a quasi-halo orbit around the Earth–Moon L2 point, LUMIO uses the LUMIO-Cam instrument to observe impact flashes in the visible and near-infrared, enabling estimation of radiated and kinetic energy through luminous efficiency and providing constraints on the meteoroid flux.
To interpret these observations, it is essential to model the evolution of ejecta clouds generated by hypervelocity impacts and to assess the influence of material properties and vaporization processes.
Methods. We conduct numerical simulations using the LIMARDE code to study the dynamical evolution of ejecta clouds generated by impacts. The simulated regolith properties are defined consistently with numerical impact studies, where the lunar surface is represented as a porous regolith layer with properties varying depending on mechanical conditions. Impact conditions are not prescribed analytically, but are derived from the outputs of iSALE shock physics simulations, which provide physically consistent ejecta velocity distributions and material responses following hypervelocity impacts. In addition, thermodynamic processes are incorporated by modeling partial vaporization of the regolith, which generates a transient gas plume characterized by velocities of several hundred m/s and short characteristic timescales.
Simulations are conducted for different materials and configurations, including cases with and without vaporization. Dust grains are modeled as non-spherical axially symmetric particles with characteristic sizes of ~50 μm and ~100 μm, and densities of 2700 kg/m³ for plagioclase and 3450 kg/m³ for pyroxene [3,4].
Results. We performed simulations of the initial ejecta distribution produced by an impact crater of approximately 30 m in radius, considering two dust particle cases corresponding to pyroxene and plagioclase. The particle sizes are constrained by observed lunar regolith morphology, spanning typical grain distributions from equatorial to polar regions.
The simulations provide the spatial distribution of deposited particles on the lunar surface as a function of distance from the crater, as well as the influence of vaporization processes.
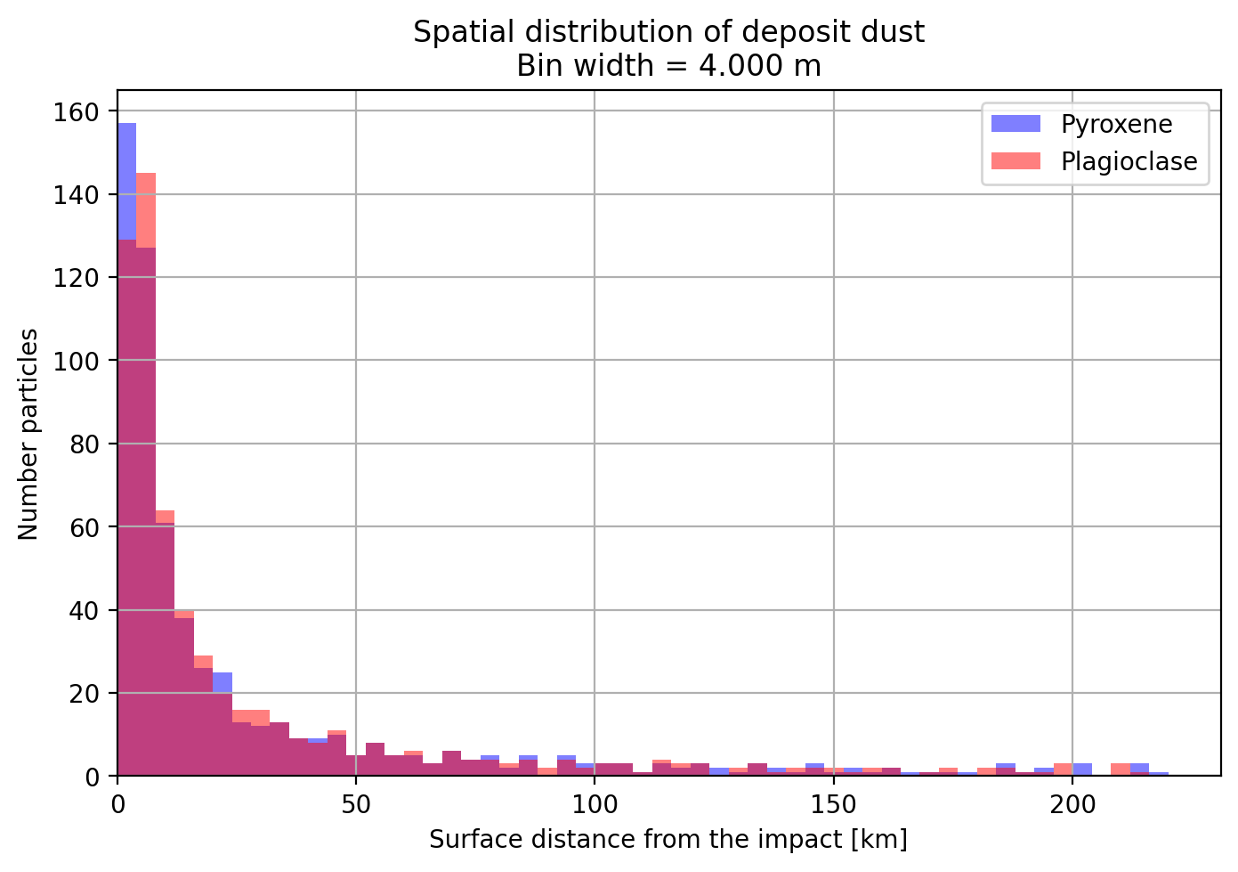
Figure 1 shows the number of particles deposited as a histogram of radial distance from the crater center, considering a vaporization phase lasting approximately 1 s after the impact (which can be considered as an upper limit). We simulate the vaporization process as resulting from the melting of lunar surface material, using the following meteoroid impact scenario: a 30 cm meteoroid with a density of 2900 kg/m³ impacting at a velocity of 21 km/s.
The results indicate that a significant fraction of the ejecta is deposited relatively close to the impact site, with about 40% of the particles settling within 8 km. Over the full simulation duration of 10 minutes, less than 10% of the particles remain in motion, and no particles reach or exceed the lunar escape velocity.
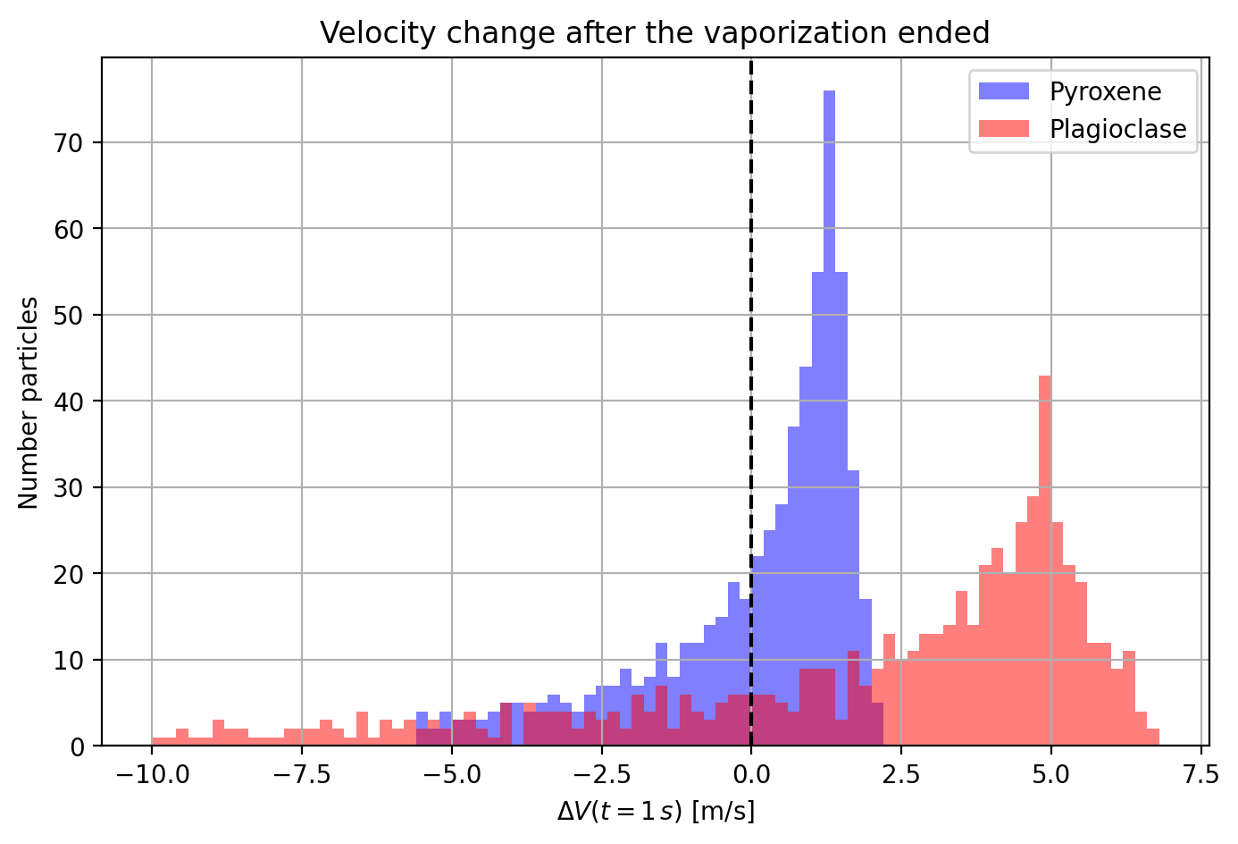
Figure 2 illustrates the variation in particle velocities after the vaporization phase has ended. Both accelerated and decelerated particles are observed, reflecting the interaction with the transient gas plume. However, deceleration affects approximately 30% of particles in the plagioclase case and about 40% in the pyroxene case.
These results show that vaporization influences the redistribution of ejecta and that variations in material properties contribute to constraining the thickness of the deposition layer as a function of the impactor characteristics and the resulting crater size.
Future Work. We would like to investigate the deposition of lunar dust in polar regions and to study ejecta timescales. In addition, future work will focus on constraining the most plausible composition of the particles involved in the thermodynamical processes responsible for generating lunar impact flashes.

Fig. 1. Deposited particle distribution of pyroxene and plagioclase in the lunar ejecta LIMARDE simulations. The vaporization phase lasts approximately 1 s, while the total simulation duration is 10 minutes.

Fig. 2. Acceleration and deceleration of the two types of particles (pyroxene and plagioclase) resulting from the vaporization process following the impact.
[1] Cipriano, A., et al. (2018). LUMIO: Lunar Meteoroid Impacts Observer. Frontiers in Astronomy and Space Sciences.
[2] Topputo, F., et al. (2023). LUMIO mission design and operations. Icarus.
[3] Qin, L., Yue, Z., Gou, S., Zhang, Y., Wei, G., Shi, K., Zhang, X., & Yang, B. (2025). Structure and Formation Mechanism of Lunar Regolith. Space Science & Technology, Article 0219.
[4] Yu, S., Yu, M., Xiao, X., Huang, J., & Xiao, L. (2025). Thermophysical Properties of Lunar Regolith Revealed by Thermal-Infrared Observations of the LRO Diviner Radiometer. The Astrophysical Journal.
Acknowledgements. This work was supported by the Italian Space Agency (ASI) within the LUMIO project (ASI-PoliMi agreement n. 2024-6-HH.0).
How to cite: Ivanovski, S. L., Calderone, L., Martellato, E., Rice, P., and Luther, R.: Modeling Lunar Impact Ejecta with Vaporization under Hypervelocity Meteoroid Impacts, Europlanet Science Congress 2026, The Hague, The Netherlands, 7–11 Sep 2026, EPSC2026-1230, https://doi.org/10.5194/epsc2026-1230, 2026.
Please decide on your access
Please use the buttons below to download the supplementary material or to visit the external website where the presentation is linked. Regarding the external link, please note that Copernicus Meetings cannot accept any liability for the content and the website you will visit.
Forward to presentation link
You are going to open an external link to the presentation as indicated by the authors. Copernicus Meetings cannot accept any liability for the content and the website you will visit.
We are sorry, but presentations are only available for conference attendees. Please register for the conference first. Thank you.
Introduction:
The Aristarchus Plateau and the region surrounding it is a promising target for future lunar exploration missions due to its potential for resource utilization and its distinctive geochemical setting. The presence of a prominent thorium anomaly [1] allows the investigation of potential rare earth element (REE) bearing materials by using thorium as a geochemical proxy [1]. In our work, resource potential is assessed through the spatial overlap of elevated thorium, iron, and titanium abundances, while landing suitability is constrained by low slopes and limited surface hazards such as rock abundance. We apply a GIS-based multi-criteria decision (MCDA) analysis, inspired by GIS-based methodological approaches [2], to identify candidate areas where resource-rich materials coincide with favourable landing conditions.
Data and analysis:
For the work presented here, we focussed on identifying regions with high thorium abundance and a low density of boulders. We selected areas with ≥12 ppm thorium to isolate the most geochemically enriched regions within the study area [3]. Areas with high boulder density, defined as 50 or more boulders per pixel (at ~4 km resolution) [4], were excluded as potentially hazardous for landing (Figure 1). Detailed analysis was performed as a raster-based, pixel-level suitability assessment using Clementine-derived titanium and iron abundance (~400 m/px) [5], WAC-derived titanium abundance [6], Kaguya-derived iron abundance (~60 m/px) [7], slope derived from the LRO LOLA - SELENE Kaguya digital elevation model (DEM) (~60 m/px) [8], and Diviner rock abundance (~240 m/px) [9]. Two different titanium and iron datasets were used to improve the robustness of the analysis and reduce uncertainties associated with individual products. For titanium, we used both Clementine- and WAC-derived datasets to balance overestimation in high-Ti maria and detection-limit constraints at low titanium abundances [10].
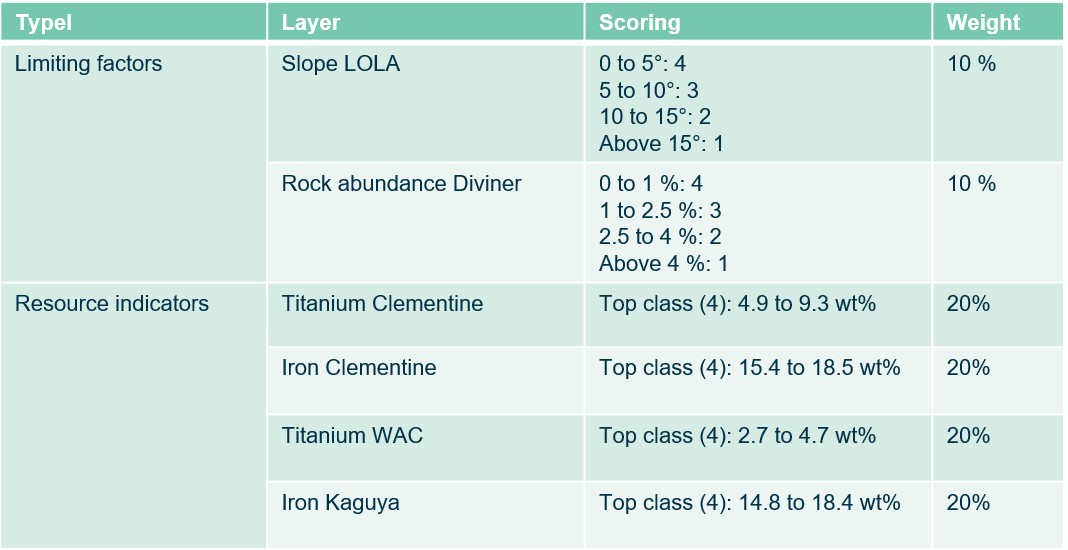
Table 1: Scoring criteria and weightings used for the landing site suitability analysis

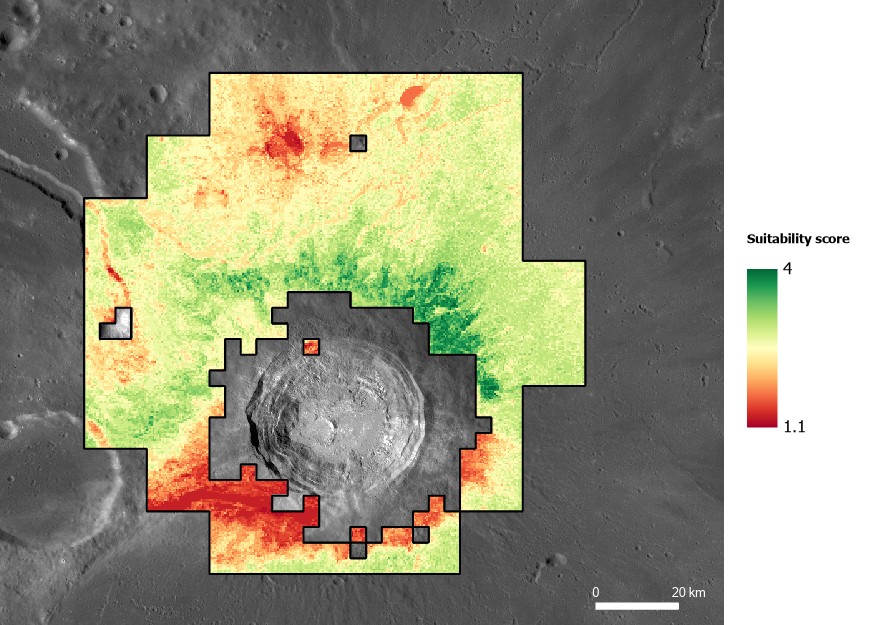
All input layers were transformed into a common simple cylindrical projection and resampled to a spatial resolution of 400 m/px, corresponding to the coarsest input dataset, to ensure alignment of the datasets. The layers were classified into four suitability classes, with scores ranging from 1 (least favourable) to 4 (most favourable). Resource-related indicators were classified using the natural breaks method to emphasize high-value clusters, while limiting factors were categorized based on predefined landing safety thresholds (see Table 1). Resource-related layers were assigned a scoring weight of 20% each, while limiting factors received a weight of 10% each. The weighted layers were then combined using a weighted sum to generate the final suitability map (Figure 1).

Figure 1: Suitability map for resource prospecting of REEs in the Aristarchus Plateau region, using Th content as a proxy, which is overlaid on a Lunar Reconnaissance Orbiter (LRO) Wide Angle Camera (WAC) global 100 m/px mosaic [13].
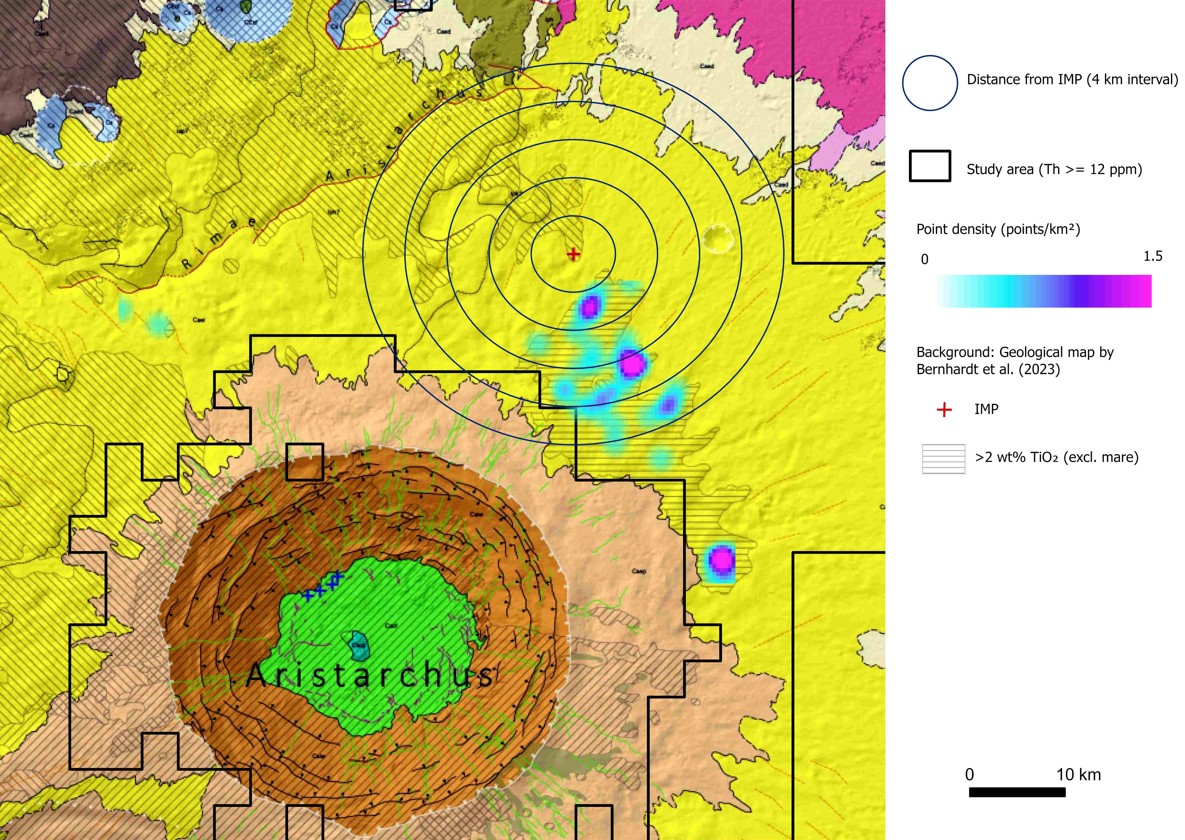
Next, pixels reaching the maximum suitability score of 4 were further evaluated. These highest-suitability pixels were converted to points and used for a kernel density estimation to identify the most promising candidate areas. A search radius of 2000 m was applied to identify spatial clusters that represent priority zones for further landing site assessment (see Figure 2).
Results:
The identified hotspots were further evaluated to assess their geological context and local terrain conditions. An overlay with the geological map of Bernhardt et al. (2023) [11] shows that the northernmost hotspot lies approximately 6 km from an irregular mare patch (Figure 2, red cross), adding further scientific value to this candidate area. Although the main suitability analysis was performed at 400 m/px, the identified hotspots were cross-referenced with a high-resolution Kaguya-derived slope layer at ~8 m/px [12]. This confirmed the presence of extensive, continuous areas with slopes below 10° directly beneath the highest-density clusters, indicating locally favourable terrain conditions for potential landing. These zones provide a focused set of priority targets for subsequent high-resolution landing site assessment and demonstrate the usefulness of GIS-based MCDA for resource-oriented lunar exploration planning.

Figure 2: Identified landing hotspots.
References:
[1] Zhang J. & J. Liu (2024) Acta Geochimica 43, 507–519. [2] Waldman A. et al. (2023) Mapping Optimal Landing Sites and Base Locations on the Moon. [3] Glotch T.D. et al. (2021) Planet. Sci. J. 2, 136. [4] Aussel B. et al. (2025) JGR 130, e2025JE008981. [5] Lucey P.G. et al. (2000) JGR Planets 105, 20297–20305. [6] Sato H. et al. (2017) Icarus 296, 216–238. [7] Lemelin M. et al. (2016) LPSC XLVII, Abstr. #2994. [8] Barker M.K. et al. (2016) Icarus 273, 346–355. [9] Powell T.M. et al. (2023) JGR 128, e2022JE007532. [10] Sato H. et al. (2015) LPSC XLVI, Abstr. #1111. [11] Bernhardt H. et al. (2023) LPSC LIV, Abstr. #1104. [12] Haruyama J. et al. (2008) Earth Planets Space 60, 243–255. [13] Robinson M.S. et al. (2010) Space Sci. Rev. 150, 81–124.
How to cite: Tomášková, E., Orgel, C., Oetting, A., Losekamm, M. J., van der Bogert, C. H., Consuma, G., McDonald, F., and Carpenter, J. D.: GIS-Based Multi-Criteria Decision Analysis for Resource-Oriented Landing Site Selection on the Aristarchus Plateau , Europlanet Science Congress 2026, The Hague, The Netherlands, 7–11 Sep 2026, EPSC2026-1011, https://doi.org/10.5194/epsc2026-1011, 2026.
Introduction
The Lunar Vertex mission [1, 2] will study the Reiner Gamma magnetic anomaly and swirl at the surface of the Moon (Figure 1). The Reiner Gamma swirl is a curvilinear albedo feature that is co-located with a magnetic anomaly, both of unknown origin. The scientists is studying Reiner Gamma in the fields of plasma physics, magnetism, and geology, each having played a role at some point on the evolution of the Reiner Gamma formation dating back to ~2.9 Ga [3].

Figure 1. Reiner Gamma Swirl. Oblique view from west to east, captured by the NAC camera aboard LRO satellite. NAC image reference: M1127569280L,R
Our research focuses on geology. The intriguing layout of two large craters in the vicinity of Reiner Gamma suggests they have potentially played a role in resurfacing the swirl via ballistic sedimentation of their ejecta. Hood et al. [3, 4] documented the presence of clusters of ellipsoid craters on the western part of Reiner Gamma in Lunar Orbiter IV images. These craters seem to be the extension of ejecta deposits, which extrapolated to the distance, pass through the center of the Cavalerius crater. The geologic map of the Reiner Gamma region at 1:5 M [5] also suggests the presence of lineaments (ejecta deposits) directionally leading to the Reiner and Cavalerius craters.
Our main objective is to determine whether fresh material from surrounding craters could have been deposited on the Reiner Gamma magnetic anomaly after its formation. The specific objectives are to (1) identify the material ejected from Reiner and Cavalerius craters at a fine spatial scale, and (2) study the similarity between the material found on the Reiner Gamma magnetic anomaly and that of these craters.
Dataset
The Narrow Angle Camera (NAC) aboard the American Lunar Reconnaissance Orbiter (LRO) spacecraft has been imaging the lunar surface of the Moon since 2009, at an altitude of ~50 km [6]. These cameras capture panchromatic images in the 400–760 nm wavelength range with ~50 cm spatial resolution.
SLDEM2015 [7] is a digital elevation model (DEM) created for the lunar surface covering latitudes of ±60°. It has a vertical resolution of ~3 to ~4 m and a spatial resolution of 60 m. SLDEM2015 is a combination of LOLA (LRO) and Terrain Camera (Kaguya) products and was created to provide users with a more accurate DEM.
The “Multiband Imager” (MI) camera aboard the Japanese satellite Kaguya was placed into lunar orbit in 2007 at an altitude of 100 km. The instrument has 9 bands, including 5 in the visible spectrum (415, 750, 900, 950, and 1,000 nm) at 20 m spatial resolution and 4 in the near-infrared spectrum (1,000, 1,050, 1,250, and 1,550 nm) at 62 m spatial resolution. Maps of the Optical Maturity (OMAT) index [8] can be derived from MI data. The physical evolution of the lunar surface due to exposure to the space environment is termed maturation, and maturity is the degree to which a particular lunar soil possesses quantitative characteristics consistent with that exposure.
The Imaging Infrared Spectrometer (IIRS) camera aboard the Indian Chandrayaan-2 satellite was placed into lunar orbit in 2019 at an altitude of 100 km. The instrument has 256 continuous spectral bands at 80 m spatial resolution. The spectral resolution is approximately 20 nm. The spectral range is between 0.8 and 5 μm.
Methodology
We will first map the distribution of four ejecta facies in and around Reiner and Cavalerius as defined in Thesniya et al. [9]. Facies A represents the proximal ejecta extending from the crater rim to one crater radius. Facies B represents smooth deposits of low-albedo molten material generally present in topographic depressions. Facies C represents areas of smooth, low-albedo melt deposits interspersed with chaotically dispersed blocks of varying sizes, extending from the crater rim and exhibiting preferential flow toward topographically low areas. Facies D represents a cluster of ellipsoidal craters located near the rim crest extending to the distal part of the ejecta. Each Facies represents an ejecta unit with specific characteristics in terms of its surface texture, pattern, and the type and nature of deposition [9]. We will then identify small fresh craters in the continuous ejecta blankets of Reiner and Cavalerius craters near their rim crest (Facies A) and ellipsoidal craters arising from both Reiner and Cavalerius craters on the surface of the lunar swirl (Facies D) and study their respective spectra.
Scope of the research
The ejecta facies of the Reiner and Cavalerius will be mapped for the first time. Our research will allow us to determine the extent of spectral similarity between Reiner and Cavalerius and the Reiner Gamma swirl itself. This information will provide context for the Lunar Vertex mission and contribute to the understanding of lunar swirl formation. Our project will also open research avenues for conducting detailed mapping at other lunar swirls.
References
[1] Blewett et al. (2023). PRISM-1 Lunar Vertex: Five Instruments and a Rover. Annual Meeting of the Lunar Exploration Analysis Group (vol. 2887, p. 2892). https://ui.adsabs.harvard.edu/abs/2023LPICo2887.2892B
[2] Blewett et al. (2024). The Lunar Vertex PRISM Payload: Ready to Launch. 55th Lunar and Planetary Science Conference (vol. 3040, p. 1553). https://ui.adsabs.harvard.edu/abs/2024LPICo3040.1553B
[3] Hood et al. (1979b). The Moon: Sources of the Crustal Magnetic Anomalies. Science, Volume 204, Issue 4388, pp. 53-57. https://ui.adsabs.harvard.edu/link_gateway/1979Sci...204...53H/doi:10.1126/science.204.4388.53
[4] Hood et al. (1979a). Lunar nearside magnetic anomalies. Lunar and Planetary Science Conference, 10th, Houston, Tex., March 19-23, 1979, Proceedings. Volume 3. (A80-23677 08-91) New York, Pergamon Press, Inc., 1979, p. 2235-2257. https://ui.adsabs.harvard.edu/abs/1979LPSC...10.2235H/abstract
[5] Fortezzo et al. (2020). Unified Map of the Moon U.S. Geological Survey. https://www.usgs.gov/media/images/fortezzo-et-al-2020-unified-map-moon
[6] Robinson et al. (2010). Lunar Reconnaissance Orbiter Camera (LROC) Instrument Overview. Space Science Reviews, 150(1‑4), 81‑124. https://doi.org/10.1007/s11214-010-9634-2
[7] Barker et al. (2016). A new lunar digital elevation model from the Lunar Orbiter Laser Altimeter and SELENE Terrain Camera. Icarus, 273, 346‑355. https://doi.org/10.1016/j.icarus.2015.07.039
[8] Lucey et al. (2000). Imaging of lunar surface maturity. Journal of Geophysical Research: Planets, 105(E8), 20377‑20386. https://doi.org/10.1029/1999JE001110
[9] Thesniya et al. (2025). Investigation of morphology and impact ejecta emplacement of the Copernican Das crater on the lunar farside. Planetary and Space Science, 258, 106052. https://doi.org/10.1016/j.pss.2025.106052
How to cite: Calas, G., Lemelin, M., Bultel, B., Hood, L., and Blewett, D. T.: Study of material from Reiner and Cavalerius craters in the Reiner Gamma region, Europlanet Science Congress 2026, The Hague, The Netherlands, 7–11 Sep 2026, EPSC2026-59, https://doi.org/10.5194/epsc2026-59, 2026.
Introduction: Upcoming lunar missions aim to combine technical demonstrations with scientific outcomes. In particular, geologically diverse regions on the lunar nearside offer valuable opportunities for the development of in‑situ resource utilization (ISRU), which could reduce dependence on Earth for future lunar exploration [1].
To investigate a promising target for future missions, we produced a new geologic map of the Mare Vaporum region (13.20°N/4.09°E) at a scale of 1:125,000. Two distinct dark mantling deposits were identified that exhibit high concentrations of FeO (~15-19 wt.%) and TiO₂ (~4-8 wt.%), indicating the presence of ilmenite (FeTiO₃). Ilmenite-bearing materials may enable the extraction of oxygen and helium‑3 [2]. As a result, Mare Vaporum is well suited for future ISRU efforts and, due to its diverse geology (Figure 1), also provides an excellent opportunity to better understand the Moon’s volcanic and tectonic history.
Method: The different geologic units were distinguished based on variations in relative albedo, topography, and morphology. Datasets used include Kaguya SELenological and Engineering Explorer (SELENE) Terrain Camera (TC) images and Kaguya TC digital elevation models (DEMs), both with pixel scales of ~10 m/px [3], as well as spectral data such as the Clementine UVVIS color ratio map [4] and Kaguya Lunar Multiband Imager (MI) maps ([5], [6]). Mapping was carried out following the stratigraphic scheme of [7] and adheres to the mapping standards described in [8] and the Planetary Geologic Mapping Protocol [9].
Results: The Mare Vaporum region shows diverse geologic units with exposed materials spanning from the Nectarian period to the Copernican period.
Figure 1: Geologic map of the Mare Vaporum region, mapped at a scale of 1:125.000.
Terra material (Nt): A prominent elongated ridge in the eastern portion of the study region is interpreted as Nectarian terra material.
Basin material (Nbm, If): The rim of the Serenitatis basin forms a distinct elevated feature in the northeastern study region. Ejecta deposits from the Imbrium impact event are present in the northern and southern part of the study region and are mapped as the Fra Mauro Formation.
Dark mantling material (Id1, Id2): Two dark mantling deposits occur in the region. The underlying topography remains visible at both deposits. FeO concentrations range from ~15-19 wt.%, and the TiO₂ values range from ~4-8 wt.%. The dark mantling deposits are likely represent pyroclastic material from the Imbrian period.
Light plains material (Ilp): This unit is characterized by high albedo and flat topography and is interpreted as the result of emplacement of impact‑generated material. It occurs in the southern part of the mapping area and is Imbrian in age.
Cratered plains material (Ipc): Compared to the Fra Mauro Formation, this unit shows a lower albedo and a rougher, more heavily cratered morphology. It is located in the southeastern part of the study region and is interpreted as Imbrian in age.
Mare material (Im1-7, Em): The majority of the study area is covered with dark and smooth materials with moderate TiO₂ and high FeO concentrations. These areas are interpreted as mare basalts emplaced during the Imbrian and Eratosthenian periods.
Crater material (Ic, Ec, Cc): Materials related to impact craters were also identified, including ejecta blankets, central peaks, crater floors, and impact melt. deposits Only craters with diameters of 5 km or greater were mapped individually.
Tectonic and volcanic features: A variety of tectonic and volcanic features could be identified, includig domes, pits, irregular mare patches, wrinkle ridges, and graben. Rima Hyginus (Ir), which we mapped as separate geologic unit, is a large graben partly surrounded by dark mantling deposits. Domes, pits, and graben are interpreted as Imbrian in age, while wrinkle ridges formed between the Imbrian and the Eratosthenian periods in the study region. The age of irregular mare patches, such as Ina, remains debated, with proposed ages ranging from Imbrian [10] to Copernican [11].
Conclusion: Our new geologic map shows that Mare Vaporum is a promising region for future ISRU efforts, especially due to the presence of dark mantling deposits enriched in FeO and TiO₂. In addition, a variety of geologic units and features is present (e.g., highland and basin materials, mare material, light plains, crater material), which increases the scientific potential for future lunar missions. Domes, pits, and irregular mare patches provide evidence for past volcanism and allow reconstruction of the volcanic evolution of the region. Furthermore, slope and rock abundance analyses indicate that Mare Vaporum is suitable for safe landings.
References:
[1] Carpenter, J. et al. (2016) Space Policy, 37, 52-57. [2] Hawke, B. R. et al. (1990) Proc. Lunar Planet. Sc. Conf. 20th, p. 249-258. [3] Haruyama, J. et al. (2008) EPS, 60, 243-255. [4] Lucey, P. G. et al. (2000) JGR: Planets, 105(E8). [5] Lemelin, M. et al. (2019) PSS, 165, 230-243. [6] Sato, H. et al. (2017) Icarus, 296, 216-238. [7] Wilhelms, D. E. et al. (1987) USGS, 1348. [8] Federal Geographic Data Committee (2006) FGDC-STD-013-2006. [9] Skinner, J. A. et al. (2022) USGS, TM11-B13. [10] Qiao, L. et al. (2017) Geology, 45(5), 455-458. [11] Braden, S. E. et al. (2014) Nature Geoscience, 7(11), 787-791.
How to cite: Oetting, A., Wueller, L., van der Bogert, C., Consuma, G., Iqbal, W., Carpenter, J., and Heyer, T.: Geologic Map of the Mare Vaporum Region - Geologic Evolution and Resource Assessment , Europlanet Science Congress 2026, The Hague, The Netherlands, 7–11 Sep 2026, EPSC2026-216, https://doi.org/10.5194/epsc2026-216, 2026.
Apollo regolith samples provide a spectroscopic baseline against which regoilith simulants can be judged. The lunar surface undergoes space weathering, which involves a number of processes. These include the production of nanophase iron in the outermost surfaces of mineral grains. This process is unique to airless bodies and does not occur on the Earth. As a result, terrestrial analogues of lunar surface rocks may not be good spectral analogues. The result of nanophase iron production is to darken and redden the lunar surface. As a result, lunar regolith spectra are uniformly red-sloped over the 500 to 2500 nm range.
With increasing maturity, highland and mare spectra become darker and more red-sloped. To determine whether lunar meteorite powders can serve as spectral analogues, we have measured the reflectance spectra of a suite of powdered (<1000 micron grain size) lunar meteorites, which are largely brecciated with obvious highland and mare clasts.
The 350-2500 nm reflectance of a suite of Apollo samples, sieved to <1000 microns, were measured at the University of Winnipeg's Centre for Terrestrial and Planetary Exploration (C-TAPE). It was found that with increasing maturity, both highland and mare regolith samples become darker and more red-sloped, as expected. Visible region reflectance (at 550 nm) ranges from 14-32% for highland samples, and 5-12% for mare samples. Spectral slopes, as measured by the 2500/500 nm reflectance ratio, ranges from 1.5 to 2.9 for highland regolith, and 2.2 to 4.0 for mare samples.
Applying the same metrics to our suite of lunar meteorite powders, we find that 550 nm reflectance is wide-ranging, from 6 to 54%; nearly as low as mature mare and brighter than immature highlands. However, spectral slope (2500/500 nm reflectance ratio) is more limited, ranging from ~1 (flat overall spectral slope) to 1.7, just within the range of immature highland regolith. Consequently, lunar meteorites are not good spectral analogues for the Moon with the possible exception of immature highlands, as exemplified by the Apollo 61221 regolith sample.
Our results indicate that lunar meteorites, while compositionally identical to the Moon, require space weathering, likely production of nanophae iron, to serve as spectral analogues for lunar regolith.
How to cite: Cloutis, E. A., Applin, D., and Ledoux, T.: Comparison of Reflectance Spectra of Apollo Regolith Samples to Crushed Lunar Meteorites, Europlanet Science Congress 2026, The Hague, The Netherlands, 7–11 Sep 2026, EPSC2026-288, https://doi.org/10.5194/epsc2026-288, 2026.
: FPA hyperspectral mineral mapping of micro-regions across the NWA 11421 lunar meteorite D- and S-faces. For each region analyzed (S1, D1, D2, D3), cluster maps derived from μ-FTIR FPA data highlight compositional variability, with color scales indicating dominant mineralogical components and emphasizing the heterogeneous nature of the sample (reproduced from Alberini et al., 2026, Remote Sensing, © 2026 The Authors, CC BY).
Introduction
Lunar meteorites are a valuable source of information for understanding the Moon’s geology because they originate from different areas across the lunar surface. In contrast, the samples from the Apollo/Luna missions are restricted to precise locations on the visible side and do not necessarily represent the overall composition of the lunar surface [1][2]. Therefore, the meteorites provide a more global perspective on lunar mineralogical diversity and offer key insights into its overall composition and evolution [1][2][3][4]. NWA 11421 is a lunar meteorite discovered in Morocco in 2017 (total mass ~ 912 g), classified as a feldspathic breccia [5]. Petrographically, it consists of angular to subrounded whitish clasts up to 1 cm in size set into a greyish vitreous groundmass. Dominant mineral phases reported in the Meteoritical Bulletin include low-Ca pyroxene, high-Ca pyroxene, olivine and calcic plagioclase. Minor phases include chromite, ilmenite, fayalite, pyrrhotite, FeNi metal and barite [5]. Of particular significance is the discovery, within NWA 11421, of a dunite clast measuring approximately 1 cm, interpreted as the first fragment of lunar mantle material identified to date [6]. Indeed, the discovered dunite clast exhibits a homogeneous mineral composition, suggesting internal chemical equilibrium and derivation from a deep-seated, mantle-derived source, offering a unique window into the lunar interior beyond the crustal materials typically sampled [6]. This study aims to refine the characterization and broaden the statistical dataset of these samples, enhancing our understanding of feldspathic lunar meteorites and assessing the possible presence of dunitic clasts indicative of a mantle-derived origin.
Methods
A comprehensive suite of non-destructive analytical techniques was used. At the INAF–Astrophysical Observatory of Arcetri, bulk Visible and Near/Mid-Infrared reflectance spectroscopy was performed using Diffuse Reflectance Infrared Fourier Transform (DRIFT) collected by a Bruker VERTEX 70v FTIR interferometer, equipped with a Harrick Praying Mantis™ accessory. This configuration provided overall spectral information representative of the entire sample. For microscale assessments, the same VERTEX 70v system was interfaced with a HYPERION 1000 μ-FTIR microscope equipped with a 64×64 pixel Focal-Plane Array (FPA) detector (~ 2 μm spatial resolution) performing cluster analyses. Complementary chemical mapping was carried out at the IBeA research group of the University of the Basque Country (EHU), using μ-EDXRF, which provided high resolution elemental distribution maps (particularly useful for identifying compositional zoning and supporting spectral interpretations), and Raman imaging employed as a supportive technique to confirm mineral textures and phase associations, reinforcing the identifications derived from FTIR and X-ray fluorescence analyses.
Results
NWA 11421 results confirm a dominant anorthositic composition, consistent with its classification as a feldspathic breccia, with significant contributions from forsteritic olivine and low-Ca pyroxenes (pigeonite and ferrosilite) (Figure 1) [7]. At bulk and meso-scale, olivine-bearing anorthositic domains define troctolitic compositions, while LCP-rich regions are spatially anti-correlated with the feldspathic matrix, reflecting the polymict nature of the breccia. Micro-scale observations reveal discrete mafic domains embedded within the anorthositic matrix, indicating that lithological heterogeneity is preserved down to the micron scale. Bright mineral inclusions are assigned to plagioclase glass. Near-infrared pyroxene band positions fall within the orthopyroxene field, confirming the dominance of LCPs and suggesting relatively mafic and primitive components. This interpretation is supported by the Christiansen Feature (CF) position, which is shifted toward the pyroxene-rich region of the silicate ternary diagram compared to typical Apollo highland samples. Moreover, CF values are consistent with those measured by the Diviner Lunar Radiometer Experiment in lunar crater-ejecta terrains, establishing a direct link between laboratory measurements and orbital remote sensing observations. These results demonstrate the effectiveness of a multi-scale, non-destructive spectroscopic approach in bridging laboratory analyses and orbital datasets, providing a robust framework to refine the interpretation of lunar mineralogical maps and to support future exploration strategies.
References:
[1] Korotev R. L. (2005) Chem. Erde, 65, 297–346.
[2] Joy K. H. and Arai T. (2013) Astron. Geophys., 54, 4.28–4.32.
[3] Joy K. H. et al. (2016) Earth Moon Planets, 118, 133–158.
[4] Warren P. H. (2005) Meteorit. Planet. Sci., 40, 477–506.
[5] The Meteoritical Bulletin, No. 106. https://www.lpi.usra.edu/meteor/docs/mb106.pdf
[6] Treiman A. H. and Semprich J. (2023) Am. Mineral., 108, 2182–2192.
[7] Alberini A. et al. (2026) Remote Sens., 18, 576.
Acknowledgements: This research was funded by the Space It Up project funded by the Italian Space Agency, ASI, and the Ministry of University and Research, MUR, under contract n. 2024-5-E.0-CUP n. I53D24000060005. F.A., J.A., and J.M.M. acknowledge the support of the PAMMAT project funded by the Spanish Agency for Research, Contract No. PID2022-142750OB-I00, funded by the Spanish Agency for Research AEI (through the Spanish Ministry of Science and Innovation, MCIN, and the European Regional Development Fund, FEDER, MCIN/AEI/10.13039/501100011033/FEDER, UE).
How to cite: Alberini, A., Renzi, F., Poggiali, G., Alberquilla, F., Biancalani, S., García Florentino, C., Roussel, A., Battistuzzi, M., Aramendia, J., Madariaga, J. M., Fornaro, T., and Brucato, J. R.: Spectroscopic and Geochemical Characterization of Lunar Breccia NWA 11421: Insights into the Lunar Crust–Mantle Composition and Implication for Moon Exploration, Europlanet Science Congress 2026, The Hague, The Netherlands, 7–11 Sep 2026, EPSC2026-547, https://doi.org/10.5194/epsc2026-547, 2026.
High-fidelity illumination and thermal modeling is crucial for understanding the stability and evolution of volatiles on airless planetary surfaces. These environments are controlled not only by direct solar illumination, but also by radiation reflected and emitted from surrounding terrain. Modeling polar craters and other rough surfaces quickly becomes computationally demanding, especially at high resolution and when repeated simulations are needed for multiple epochs, illumination geometries, or thermophysical scenarios. Potter et al., J. Comp. Phys. X (2023) addressed this challenge by compressing the radiosity view-factor matrix used to model terrain irradiance, enabling large reductions in memory use and runtime while preserving accuracy for lunar craters and small-body shape models.
Here we present ongoing work extending the Potter et al. (2023) Python-based framework, fluxpy, with a faster C/Cython backend for hierarchical matrix operations, based on the newly created butterfly library. The goal is to support high-fidelity, high-resolution thermal modeling across a broad range of planetary applications, from local polar terrains to complex three-dimensional bodies, with practical runtimes on standard computing resources. We validate the new implementation using the analytical solution for a bowl-shaped crater. We also benchmark it against the published fluxpy implementation using selected lunar crater meshes and 3D body shape models, comparing accuracy, memory use, and runtime.
We then apply the new model to Shackleton crater, one of the Moon’s most persistent polar cold-trap environments. Using high-resolution topography, we examine how illumination and radiative-equilibrium maximum temperatures change under increasing solar-declination conditions at different stages of the lunar orbital evolution. Preliminary results indicate that, within Shackleton, the area that acts as cold-trap (here taken as maximum temperature ≤110 K) decreases more rapidly with increasing solar declination than the permanently shadowed area. This suggests that terrain irradiance, multiple scattering, and self-heating significantly affect cold-trap history, particularly in steep polar terrains.
We show that the updated fast-radiosity framework enables accurate high-resolution simulations of illumination and thermal evolution without requiring high-end computing resources. This capability can support the characterization of volatile stability across planetary surfaces and help identify regions where future robotic and human missions may search for water and other resources.
How to cite: Bertone, S., Mazarico, E., and Schorghofer, N.: Long-Term Illumination and Thermal Evolution of Shackleton Crater with Fast Radiosity Modeling, Europlanet Science Congress 2026, The Hague, The Netherlands, 7–11 Sep 2026, EPSC2026-554, https://doi.org/10.5194/epsc2026-554, 2026.
Introduction: Water on the Moon remains one of the major topics in lunar science, particularly in the context of future crewed missions and the need to assess the abundance and potential extractability of lunar resources. Within this framework, the Mairan crater region (~41.6°N, 44.5°E; Figure 1a) represents a particularly interesting case study, owing to previously reported hydrogen anomalies [1] and to the rare availability of spatially and temporally overlapping imaging spectroscopy datasets acquired by the Chandrayaan-1/Moon Mineralogy Mapper (M³) in both global-mode and target-mode observations [2,3].
Methods and data: We analyzed high-quality M³ observations acquired during the OP1B and OP2A mission phases [3], corresponding respectively to global-mode data collected at ~08:15 LST and target-mode data acquired at ~15:40 LST. These datasets were selected to ensure optimal radiometric stability [4] and to enable a robust comparison of morning and afternoon spectral conditions across the Mairan crater region. The reflectance spectra were first photometrically corrected using the standard M³ team pipeline [5] and subsequently smoothed with a Savitzky–Golay filter. To minimize the influence of thermal residuals, we applied and compared three independent correction strategies: (i) a data-driven empirical method [6], (ii) a semi-empirical channel-ratio approach calibrated in the laboratory [7], and (iii) a roughness-aware thermal model partly based on the framework [8].
To investigate surface composition, optical maturity, hydration, and their possible local-scale interrelationships, we computed a suite of spectral indices and performed non-linear spectral unmixing over the 0.7–2.3 µm range [9]. This approach allowed us to further characterize compositional variability and the relative enrichment in darkening and reddening agents, such as nanophase metallic iron, using LSCC spectra as the reference spectral library [10]. The OH/H₂O abundance was estimated through the Effective Single-Particle Absorption Thickness parameter (ESPAT), which is linearly correlated with OH/H₂O content [11] and was retrieved using Hapke’s radiative transfer model [12].
For the target-mode observations, we additionally applied a K-Means cluster-based analysis to mitigate signal-to-noise limitations [10] and to better distinguish spectrally and geologically distinct terrain units. The number of clusters identified via the elbow-criterion is equal to seven (Figure 1).
Finally, we extended the spectral unmixing analysis to continuum-removed spectra in the 2.5–3.0 µm range. This step was designed to exploit the finer spectral sampling of the target-mode data and to investigate the possible origin of the structural-OH signature identified in the mid-afternoon observations.
Results and conclusions: Our analysis reveals a pronounced diurnal variability of the OH/H₂O signature across the Mairan region. Estimated abundances decrease from ~451 ppm in the early morning to ~100 ppm over the Procellarum Terrain and ~89 ppm over the Mairan Peninsula in the mid-afternoon, corresponding to an overall reduction of ~60–80%. This decrease is associated with a spectral evolution from a broad, composite hydration feature under colder morning conditions to a sharper absorption centered near ~2.75 µm in the afternoon (Figure 2). The persistence of this band after the application of three independent thermal-correction approaches supports the presence of a stable, structurally bound OH component in the uppermost regolith.
Spectral unmixing of the 2.5–3.0 µm region suggests that this residual mid-afternoon structural-OH is predominantly exogenous, with irradiated basalts and Apollo samples [13] emerging as the main spectral endmembers and no clear evidence for significant endogenous contributions. Within the Mairan Peninsula units, the ~2.75 µm band depth appears to increase with the abundance of npFe⁰ retrieved via spectral unmixing (Figure 3), possibly indicating that mature, glassy, amorphous, and/or defect-rich regolith components provide favorable sites for retaining implanted protons against thermal desorption. Although the limited number of clusters prevents a robust correlation analysis, this trend points to a potential link between solar-wind-derived OH stability and regolith microstructure. Overall, hydration in the Mairan region appears widespread and potentially multi-phase in the early morning, whereas by mid-afternoon it becomes more selectively retained as structurally bound OH controlled by exogenous processes and local regolith properties.
Acknowledgments: The authors acknowledge support from the Space It Up project, funded by the Italian Space Agency and the Italian Ministry of University and Research. Contract n. 2024-5-E.0 – CUP n. I53D24000060005.
References:
[1] Lawrence, D. J. et al. (2022) Journal of Geophysical Research, Planets, 127(7).
[2] Pieters, C.M. et al. (2009) Science, 326(5952), 568-572.
[3] Green, R.O. et al. (2011) Journal of Geophysical Research, Planets, 116(E10).
[4] Clark, R.N. et al. (2024) The Planetary Science Journal, 5(9).
[5] Besse, S. et al. (2013) Icarus 222(1).
[6] Clark, R.N. et al. (2011) Journal of Geophysical Research, Planets, 116(E6).
[7] Li, S. & Milliken, R.E. (2016) Journal of Geophysical Research, Planets, 121(10).
[8] Wohlfarth, K. et al. (2023) Astronomy & Astrophysics, 674(A69).
[9] Hesse, M. et al. (2021) Remote Sensing 13(22), 4702.
[10] Taylor, L. A. (2001) Journal of Geophysical Research: Planets, 106(E11).
[11] Li, S. & Milliken, R.E. (2017) Science Advances, 3(9).
[12] Hapke, B. (1984) Icarus, 59(1), 41-59.
[13] Yeo, L.H. et al. (2025) Journal of Geophysical Research, Planets, 130(E3).

Figure 1. Clusters identified from the K-Means analysis of principal components retrieved through PCA decomposition of target-mode data, characterizing the eastern part of the ROI.

Figure 2. Hydroxyl absorption bands for the clusters identified in Figure 1 using the three thermal removal approaches applied in this study.
Figure 3. OH-band depth as a function of the abundance of npFe⁰ retrieved through 0.7–2.3 µm spectral unmixing. The trend obtained with the Clark method (a) is ambiguous, potentially due to an underestimation of thermal emission [7,8]. In contrast, the trends derived using the empirical approach [7] (b) and the roughness-informed model [8] (c) are comparable and consistent with a linear relationship, as indicated by the χ² values reported in panels (b) and (c).
How to cite: Colaiuta, F., Tosi, F., Zambon, F., Pratesi, G., Anand, M., and Boruah, M. K.: Revealing the Surface Composition and Hydroxyl Variability near Mairan Crater with Moon Mineralogy Mapper (M3) Data Combined with Spectral Unmixing Techniques, Europlanet Science Congress 2026, The Hague, The Netherlands, 7–11 Sep 2026, EPSC2026-625, https://doi.org/10.5194/epsc2026-625, 2026.
Over the last decades, water and other volatiles on the Moon have been of high scientific interest. They offer potential for in-situ resource utilisation and studying them might provide valuable insights into the formation and evolution of the Moon and the Solar System (e.g. Lunar Exploration Analysis Group, 2017; Reiss, 2024; Merancy et al., 2025). To improve our knowledge of the distribution of water on the Moon, the project VOLARIS (Reiss et al., 2025), funded by the European Research Council, investigates processes involved in the lunar water cycle, combining laboratory experiments with numerical simulations. The experimental investigations will focus on water migration into deeper layers via thermal pumping (Schorghofer et al., 2014; Reiss et al., 2021) and on its thermal release by simulated micrometeorite impacts.
The experimental setup currently under development features a thermal vacuum chamber to represent a relevant environment, with temperatures of ~100 K and pressures of ~10-6 mbar. The target regolith sample size is 25 cm in diameter and 10 cm in height. To investigate thermal pumping effects, a heater will be placed above the sample to establish a representative temperature gradient by exposing it to shortened lunar diurnal temperature cycles on a hours-to-days timescale. The temperature inside the sample will be measured at different depths and lateral positions. Further, the surface temperature will be observed using an infrared camera. Additionally, the water content inside the sample will be measured throughout the experiment. To study thermal release due to micrometeorite impacts, the setup will host an Nd:YAG laser with a wavelength of 1064 nm. Desorption of volatiles from the sample will be measured with a mass spectrometer. The experiments will be correlated with simulations to scale the observed effects to lunar temporal and spatial scales and to constrain influential physical parameters.
A preliminary setup, shown in Fig. 1, is already available for feasibility studies and prototype development. The setup consists of a cylindrical sample holder, 10 cm high and 15 cm in diameter, placed on a copper plate that can be actively cooled to ~200K, inside a vacuum chamber at ~5·10-3 mbar. Temperature sensors are fixed inside the sample holder at different heights and lateral positions. A heating coil is placed above the sample surface to investigate thermal cycling of dry or icy regolith simulant. Further, a COMSOL thermal model was developed to correlate theoretical models with measurements for in-depth analysis and extrapolation to lunar timescales.
In addition, a measurement system is being developed to temporally and spatially resolve water content within a sample using dielectric spectroscopy. Here, the different polarisation behaviour of water ice and lunar regolith at low frequencies is utilised to distinguish the water ice from the regolith simulant. The determination of water content within regolith using electrical permittivity has already been proven feasible (e.g. Lethuillier, 2017; Gscheidle et al., 2024) and is also being employed by missions such as PROSPECT (Trautner et al., 2021; Gscheidle and Reiss, 2021, Eckert et al., 2025).
Together, the preliminary experiments provide important insights for the design of the thermal-vacuum system dedicated to the full-scale VOLARIS experiments, targeted to start in early 2027. These experiments will then help quantify volatile transport and retention in regolith under relevant environmental conditions.

Figure 1: Preliminary experimental setup placed on an actively cooled copper plate inside a thermal vacuum chamber.
Acknowledgements: The project VOLARIS is funded by the European Research Council (ERC) under the European Union’s Horizon Europe research and innovation programme - grant agreement number 101164002. Views and opinions expressed are, however, those of the author(s) only and do not necessarily reflect those of the European Union or the ERC. Neither the European Union nor the granting authorities can be held responsible for them.
References:
Eckert, L. et al. (2025). A Rover Permittivity Sensor for Lunar Water Ice Detection. ELS 2025.
Gscheidle, C. and Reiss, P. (2024). Investigation of Hydrated Regolith Simulant with Patch Permittivity Sensors for Planetary Exploration under Cryogenic Conditions. EPSC2024-559.
Gscheidle, C. et al. (2024). Permittivity sensor development for lunar and planetary surface exploration. In: Frontiers in Space Technologies 4, 1303180.
Lethuillier, A. (2017). Characterization of planetary subsurfaces with permittivity probes: analysis of the SESAME-PP/Philae and PWA-MIP/HASI/Huygens data. PhD thesis. Universite Paris Saclay (COmUE).
Lunar Exploration Analysis Group (2017). Advancing Science of the Moon: Report of the Specific Action Team.
Merancy, N. et al. (2025). Exploration Systems Development Mission Directorate: Moon to Mars Architecture Definition Document ([Technical Publication (TP)] no. ESDMD-001 Rev-B.1, NASA/TP-20240015571).
Schorghofer, N. et al. (2014). The Lunar Thermal Ice Pump. In: The Astrophysical Journal 788.2, p. 169.
Reiss, P. et al. (2021). Dynamics of Subsurface Migration of Water on the Moon. In: Journal of Geophysical Research: Planets 126.5, e2020JE006742.
Reiss, P. (2024). Exploring the lunar water cycle. In: Proc. Natl. Acad. Sci. U.S.A. 121 (52) e2321065121.
Reiss, P. et al. (2025). Insights into the lunar water cycle. In: The Project Repository Journal, vol. 24, pp.86–89.
Trautner, R. et al. (2021). A drill-integrated miniaturized device for detecting ice in lunar regolith: the PROSPECT permittivity sensor. In: Measurement Science and Technology 32.12, p. 125117.
How to cite: Brecher, N., Amorós-Trepat, M., Peschel, A., and Reiss, P.: Preparational Investigations for the Experimental Study of Lunar Water Migration Processes , Europlanet Science Congress 2026, The Hague, The Netherlands, 7–11 Sep 2026, EPSC2026-674, https://doi.org/10.5194/epsc2026-674, 2026.
Hydration on the lunar surface has been widely identified in orbital datasets (e.g., M³, LCROSS, LAMP), yet the physical form, abundance, and spatial distribution of lunar volatiles remain poorly constrained. Interpretation is complicated by fine-grained regolith, which modifies local thermophysical conditions, obscures underlying volatiles, and alters diagnostic spectral features through scattering and photometric effects. These uncertainties are particularly significant for permanently shadowed regions (PSRs) and high latitudes , where temperatures below ~120 K may preserve water-ice over geological timescales and where several upcoming missions (e.g., Chang’e-7, PROSPECT, CLPS payloads, LEAP) aim to investigate insitu volatiles.
We present the development of the Polar Analogue of Dust Overlying Regolith–Ice (PANDOR-I), a demountable laboratory vacuum chamber designed to simulate lunar polar conditions for infrared studies of water-ice and regolith mixtures. The system is engineered to operate under high vacuum and cryogenic conditions (~10⁻⁶ mbar; ≤120 K) and supports variable illumination geometries relevant to polar environments. PANDOR-I operates in two configurations: (1) coupled to a Bruker Vertex 70v FTIR spectrometer for laboratory reflectance measurements across 1.8–20 µm, and (2) integrated with existing flight-instrument thermal-vacuum facilities to enable direct observations by flight-ready infrared instruments.
As an initial experimental phase prior to full cryogenic integration, the FTIR sample compartment has been isolated using KBr windows to enable controlled low-pressure (~0.2 mbar) reflectance measurements of hydrated and anhydrous regolith analogue configurations. These preliminary experiments investigate how dust layering, grain size, regolith maturity, composition, ice abundance, and mixing state influence the spectral expression of hydration features, with emphasis on the ~3 µm O–H stretching region and the diagnostic ~6 µm H–O–H bending mode of molecular water. Laboratory spectra will additionally be compared with Mie–Hapke forward models to examine band depth suppression, spectral mixing behaviour, and detectability thresholds under dusty polar conditions.
This work reviews the laboratory framework for constraining infrared water-ice detection limits under mission-relevant lunar conditions and provides initial calibration datasets relevant to upcoming orbital and surface investigations of lunar polar volatiles.
1. Honniball, C.I., Lucey, P.G., Hayne, P.O., Little, R.C., Greenhagen, B.T., Malespin, C. and Orlando, T.M., 2021. Molecular water detected on the sunlit Moon by SOFIA. Nature Astronomy, 5(2), pp.121–127. https://doi.org/10.1038/s41550-020-01222-x
2. Saal, A.E., Hauri, E.H., Cascio, M.L., Van Orman, J.A., Rutherford, M.C. and Cooper, R.F., 2008. Volatile content of lunar volcanic glasses and the presence of water in the Moon’s interior. Nature, 454(7201), pp.192–195. https://doi.org/10.1038/nature07047
3. Buffo, J.J., Shepherd, J.D., Xu, J., Whisner, C., Devore, E., Shay, P. and Crites, S.T., 2025. Quantifying Regolith Cover Effects on 3 and 6 µm Water Ice Bands. 56th Lunar and Planetary Science Conference, Abstract 2152.
4. Pieters, C.M., Goswami, J.N., Clark, R.N., Annadurai, M., Boardman, J., Buratti, B., Cheek, L., Dhingra, D.K., Green, R.O., Head, J.W., Hiesinger, H., Hypki, A., Isaacson, P., Jolliff, B.L., Klima, R.L., Kramer, G., Kumar, S., Lawrence, S.J., LeCorre, L., Li, S., Malaret, E., Mustard, J.F., Petro, N.E., Robinson, M.S., Samuelson, J., Sundaram, C.N. and Taylor, L.A., 2009. Character and spatial distribution of OH/H₂O on the surface of the Moon seen by M³ on Chandrayaan-1. Science, 326(5952), pp.568–572. https://doi.org/10.1126/science.1178658
5. McCord, T.B., Taylor, L.A., Combe, J.P., Klima, R.L., Tighe, R., Murray, K., Hayne, P.O., Clark, R.N., Pieters, C.M., Sunshine, J.M., Mellon, M.T., Hargraves, R.B., Dyar, M.D., Bussey, D.B.J., Paige, D.A. and Orlando, T.M., 2011. Sources and processes responsible for OH/H₂O in lunar soil. Journal of Geophysical Research: Planets, 116(E10). https://doi.org/10.1029/2010JE003711
6. Ehlmann, B.L., Calvin, W.M., Bowles, N.E., Donaldson Hanna, K.L., Green, R.O., Greenhagen, B.T. and Shirley, K.A., 2022. Lunar Trailblazer: A pathfinding mission for lunar water and the lunar surface composition. IEEE Aerospace and Electronic Systems Magazine, 37(11), pp.6–22. https://doi.org/10.1109/AERO53065.2022.9843663
7. Bowles, N.E., Thomas, I.R., Calcutt, S.B., Donaldson Hanna, K.L., Ehlmann, B.L., Greenhagen, B.T. and Shirley, K.A., 2020. Lunar Thermal Mapper: Characterising the lunar surface in the mid-infrared. 51st Lunar and Planetary Science Conference, Abstract 1380.
8. Colaprete, A., Schultz, P., Heldmann, J., Wooden, D., Ennico, K., Hermalyn, B., Marshall, W., Ricco, A., Shirley, M., Vergoz, J. and Yeomans, D., 2010. Detection of water in the LCROSS ejecta plume. Science, 330(6003), pp.463–468. https://doi.org/10.1126/science.1186986
9. Ogishima, A., Saiki, K., Okubo, A. and Sasaki, S., 2021. Development of a laboratory apparatus to reproduce lunar polar surface environment and measurements of reflectance spectra of frost on the regolith. Icarus, 358, 114192. https://doi.org/10.1016/j.icarus.2020.114192
How to cite: Henderson, F., Bowles, N., Shirley, K., Temple, J., and Eshbaugh, H.: Investigating the Detectability of Subsurface Lunar Water-Ice Beneath Regolith Dust Using Infrared Reflectance Spectroscopy, Europlanet Science Congress 2026, The Hague, The Netherlands, 7–11 Sep 2026, EPSC2026-1186, https://doi.org/10.5194/epsc2026-1186, 2026.
Introduction: Lunar basaltic breccias Dominion Range (DOM) 18262 and 18666 were recovered during the 2018 ANSMET campaign [1–2]. The DOM pairing group (including 18262 and 18666) shares textural similarities with Meteorite Hills (MET) 01210 [3], part of the YAMM paired lunar meteorite group (Yamato 793169, Asuka-881757, Miller Range 05035) [4]. These meteorites represent ~3.8–3.9 Ga basaltic material [4–11] lacking KREEP (K, REE, and P) signatures, indicating origins outside the Procellarum KREEP Terrane [12]. The YAMM parent flow is interpreted as a “cryptomare,” reflecting deeper provenance and older crystallization ages than Apollo low-Ti basalts (3.2–3.5 Ga) [6]. Here we present petrographic, geochemical, and geochronological analyses of DOM 18262 and 18666 to evaluate their relationship to the YAMM group and potential paired meteorites.
Methods: Textural analyses of polished thin sections were conducted using optical microscopy and SEM (FEI Quanta 200 3D) at The Open University (OU), with 0.60 nA beam current and 20 kV accelerating voltage.
Quantitative mineral chemistry of lithic clasts and phases was measured using a CAMECA SX100 electron microprobe (OU) with a 5 µm defocused beam, 20 nA current, and 15 kV voltage.
207Pb/206Pb ages of apatite and merrillite were obtained using a CAMECA IMS 1280 ion microprobe (at NordSIMS, Swedish Museum of Natural History) in multicollection mode (~2.5 nA, 30 kV), following established protocols [13].
Results: Petrography: DOM 18262 is an impact breccia containing lithic and mineral clasts (100–400 µm) within a clastic matrix. Lithologies include quartz monzodiorites, coarse low- and high-Ti basalts, symplectites, reduction-textured clasts, and abundant clast-rich impact melt rocks. It is classified as a Type C impact melt-bearing breccia [14] with moderate shock (M-S3/4) [15].
DOM 18666 consists of a dark clastic matrix with ~50–500 µm lithic and mineral clasts dominated by low- and high-Ti basalts. Pyroxene compositions (Fe# = 29.1–99.3; Ti# = 47.3–100.0; Fs26–98En1–68Wo1–42) are comparable to MET 01210 (Fe# = 24.4–94.2; Ti# = 49.2–98.2; Fs30–86En1–49Wo1–42; Figs. 1–2) [16]. DOM 18666 shows moderate shock (melt veins, mosaicism; M-S4) [15] and is also a Type C impact melt-bearing breccia [14].

Fig. 1: Fe# vs Ti# of pyroxene in basaltic clasts in DOM 18262, DOM 18666, and YAMM basalts [4, 16]. Compositional fields from [17–18].
Geochronology: Apatite in basaltic clasts from both samples yields 207Pb/206Pb ages of 3.86–3.96 Ga, interpreted as crystallization ages. These are consistent with YAMM meteorites (3.8–3.9 Ga) [4, 19] and the proposed paired meteorite Ramlat Fasad (RF) 532 (~3.86 Ga) [20]. No correlation is observed between clast type and age.

Fig. 2: Pyroxene quadrilateral for basaltic clasts in DOM 18262 and 18666, compared to basaltic clasts in MET 01210 [16].
Discussion: DOM 18262 and 18666 texturally and petrographically closely resemble MET 01210, other DOM group meteorites (e.g., DOM 18543) [21], and proposed YAMM-related samples such as NWA 16256 [20, 22] and RF 532 [20]. Shared features include predominance of low-Ti basaltic clasts, symplectites, glassy spherules, and coarse-grained basalt fragments [4].
Pyroxenes display exsolution lamellae (~2 µm thick), although less prominent than in existing YAMM samples. Exsolution lamellae suggest crystallization in a thick lava flow or burial of YAMM mare material [4, 23–25]. Shock features are consistent across these samples, with DOM meteorites (M-S3/4 to M-S4) comparable to MIL 05035, RF 532, and NWA 16256 [15, 20, 22].
Phosphate ages (3.86–3.96 Ga) align with YAMM crystallization ages (3.8–3.9 Ga) [4, 19] and RF 532 (~3.86 Ga) [20], and are older than Apollo 12/15 low-Ti basalts (3.2–3.5 Ga) and Luna 24 VLT basalts (~3.2 Ga) [6]. The YAMM basalts are interpreted as a cryptomare flow, possibly from the Schiller–Schickard region, emplaced prior to Orientale (>3.8 Ga) [4–5]. The dominance of low-Ti lithologies supports observations that cryptomare deposits are typically low-Ti [10, 26].
Cl and H isotopic compositions of apatite in DOM samples are similar to MIL 05035, supporting a shared origin [27]. Further constraints from ejection ages, impact chronology (e.g., Ar–Ar), and trace element geochemistry would strengthen these interpretations.
Conclusions: DOM 18262 and 18666 exhibit petrographic, lithological, and mineralogical characteristics consistent with MET 01210 and other YAMM group samples. Shock features and pyroxene compositions are comparable across these meteorites. Phosphate Pb–Pb ages (3.86–3.96 Ga) overlap with those of the YAMM group (3.8–3.9 Ga) [4, 19] and proposed paired samples [20].
References: [1] Righter, K. (2019) Antarctic Met. Newsletter 42(2). [2] Gattacceca, J. et al. (2020) MaPS 55, 1146–1150. [3] Zeigler, R. A. et al. (2021) 84th Ann. Met. Soc., 2609. [4] Arai, T. et al. (2010) GCA 74, 2231–2248. [5] Hawke, B. R. et al. (2006) LPSC XXXVII, abstract #1516. [6] Nyquist, L. E. and Shih, C. Y. (1992) GCA 56, 2213–2234. [7] Misawa, K. et al. (1993). GCA 57, 4687–4702. [8] Nyquist, L. E. et al. (2007) LPSC XXXVIII, abstract #1338. [9] Torigoye-Kita, N. et al. (1995) GCA 59, 2621–2632. [10] Terada, K. et al. (2007) Nature 450, 849–852. [11] Srivastava, Y. et al. (2022) Nat. Comm. 13, 7594. [12] Calzada-Diaz, A. et al. (2015) MaPS 50, 214–228. [13] Snape, J. F. et al. (2016) EPSL 451, 140–158. [14] Osinski, G. R. et al. (2025) 56Th LPSC, abstract #1765. [15] Stӧffler, D. et al. (2018) MaPS 53, 5–49. [16] Day, J. M. et al. (2006) GCA 74(24), 5957–5989. [17] Nielsen, R. L. and Drake, M. J. (1978) Proc. Mare Crisium: The View from Luna, 419–428. [18] Arai, T. et al. (1996) MaPS 31, 877–892. [19] Merle, R. E. et al. (2024) J. Petrol. 65(6). [20] Oliveira, B. H. et al. (2026) AGC 1(2), 772. [21] Schweitzer, A. et al. (2026) GSL Spec. Pub. 562(1) [22] Gattacceca, J. et al. (2025) MaPS 60(7), 1587–1591. [23] Jolliff, B. L. et al. (1993) Ant. Met. Res. 6, 3. [24] Warren, P. H. and Kallemeyn, G. W. (1993) Ant. Met. Res. 6, 35. [25] Joy, K. H. et al. (2008) GCA, 72, 3822–3844. [26] Hawke, B. R. et al. (2005) LPSC XXVI, abstract #1642. [27] Hayden, T. S. et al. (2022) LPSC LIII, abstract #1886.
How to cite: Hayden, T. S., Barrett, T. J., Anand, M., Whitehouse, M. J., Jeon, H., Cloutis, E. A., and Franchi, I. A.: Petrography, mineral chemistry, and geochronology of basaltic clasts in Dominion Range 18262 and DOM 18666: Possible launch pairings and ancient mare origins. , Europlanet Science Congress 2026, The Hague, The Netherlands, 7–11 Sep 2026, EPSC2026-514, https://doi.org/10.5194/epsc2026-514, 2026.
Understanding soil–structure interaction is critical for the design of future lunar infrastructure. This study investigates the interface shear behaviour of the high-fidelity lunar regolith simulant LHS-1 through a series of direct shear tests. The primary objective was to determine peak and residual interface friction angles (δₚ and δᵣₑₛ) under conditions representative of both lunar and terrestrial environments. Tests were conducted using five interfaces with varying roughness—smooth steel, aluminium alloy, carbon fibre, rough steel, and sandpaper—across a wide range of effective normal stresses (0.28–150 kPa) and shear rates (0.005–5 mm/min). Specimens were prepared at a controlled relative density (~85%) using dry pluviation, and cyclic shearing was applied up to 70 mm cumulative displacement.
Results demonstrate that interface roughness significantly influences shear strength, particularly at low normal stresses (<4 kPa), where increased roughness leads to higher residual friction angles. The simulant exhibits abrasive behaviour, progressively reducing interface roughness during shearing. Additionally, shear rate effects were found to be negligible under dry conditions but became significant in the presence of fluid, with slower rates resulting in higher residual strength. These findings provide valuable insight into regolith–structure interaction and highlight key parameters for the design and modelling of lunar surface systems.
How to cite: Sadat, M., Quinteros, S., Alves da Silva, D., Mikesell, T. D., and Griffiths, L.: Interface fraction strength of LHS-1 Lunar regolith simulant against typical materials, Europlanet Science Congress 2026, The Hague, The Netherlands, 7–11 Sep 2026, EPSC2026-1065, https://doi.org/10.5194/epsc2026-1065, 2026.
Motivation
The amount and distribution of water within the Moon and the related accessibility of water or hydrogen at or near the lunar surface are of central interest for future lunar missions as well as our understanding of the Moon’s formation and evolution. Yet, the water budget of the Moon, its evolution over time and the distribution of water among different compositional reservoirs in the lunar mantle and crust are still poorly understood.
Models
We simulate the evolution of the lunar water budget, combining models of lunar magma ocean (LMO) solidification, water (H2 and H2O) solubility, degassing and water partitioning and assess the relative importance of key parameters including magma ocean depth, initial water content, oxygen fugacity, water degassing efficiency and water partitioning between the magma ocean liquid and crystallizing minerals. A plausible parameter space can be identified by comparing modeled mineral water contents with observed water contents in lunar materials, in particular pristine ferroan anothosites (FANs), which might constitute primary products of the lunar magma ocean. Using FAN plagioclase water contents as primary constraint, we find that the current experimental uncertainties in the plagioclase water partition coefficient constitute a key source of uncertainty for estimates of the initial lunar water content and the distribution of water in the lunar interior, e.g. in the source regions of lunar mare basalts and basaltic glasses.
Experiments
To address this uncertainty, we conducted a series of high-pressure, high-temperature experiments using a piston-cylinder apparatus to study water partitioning into plagioclase and clinopyroxene at lunar magma ocean conditions (i.e. reducing conditions, elevated melt FeO contents and low water contents of 14 ppm – 2 wt%). At these conditions we observe non-Henrian behavior for the water partition coefficients (kd) of both plagioclase and clinopyroxene, with water partition coefficients increasing with decreasing melt water contents, ranging from ~0.001 – 0.3 at water contents of 14 ppm – 2 wt% for plagioclase and from ~0.01 – 0.3 at water contents of 44 ppm – 2 wt% for clinopyroxene (figure 1).
Implications for the lunar water budget
Using these new partition coefficients, observed FAN plagioclase water contents can be reproduced assuming an initial LMO bulk water content of 0.5 - 5 ppm, considering a wide parameter space, including LMO depths of 600 – 1350 km, 0-10% liquid trapped in the cumulate during LMO solidification and water partition coefficients in other cumulate minerals covering the range of values reported in earlier studies. Considering an uncertainty of the partition coefficient within 1 stedv, the range of possible initial lunar water contents expands to ~0.3 – 20 ppm, which illustrates the importance of precise water partition coefficients.
Discussion
The observed non-Henrian behavior of the water partition coefficient for plagioclase and clinopyroxene in combination with the modeled low initial bulk LMO water contents strongly suggests that further studies on the water dependence of the water partition coefficients in other major cumulate minerals are essential for correct estimates of the water distribution in the lunar interior. This includes the source regions of mare basalts and volcanic glasses, which reach surprisingly high water contents similar to some terrestrial magmas ([1,2]). Understanding to which degree this water enrichment is the result of magmatic processes forming the mare basalts and volcanic glasses ([2]) or was inherited from earlier processes during LMO solidification (i.e. water partitioning or trapping of water-enriched liquids in the cumulate) will provide further insights into the mobilization of water during lunar magmatism, the resulting distribution of water within the lunar crust and upper mantle and the contribution of such sources to any water-bearing reservoirs at or close to the lunar surface.

Figure 1: Water partition coefficients for plagioclase (left) and clinopyroxene (right) as a function of melt water content. The data show pronounced non-Henrian behavior of the partition coefficients, i.e. they are increasing with decreasing melt water content. Red points are data from this study, grey points are data from previous studies on plagioclase ([3], [4], [5]) and clinopyroxene ([6], [7], [8], [9], [10], [11], [12], [13]).
References:
[1] Hauri, E. H., Weinreich, T., Saal, A. E., Rutherford, M. C., & Van Orman, J. A. (2011). Science, 333(6039), 213-215.
[2] Ji, D., Dasgupta, R., & Lee, C. T. (2026). Geochimica et Cosmochimica Acta.
[3] Xu, Y., Lin, Y., Zheng, H., & van Westrenen, W. (2024). Chemical Geology, 661, 122153.
[4] Lin, Y. H., Hui, H., Li, Y., Xu, Y., & Van Westrenen, W. (2019). Geochemical Perspectives Letters, 10, 14-19.
[5] Hamada, M., Ushioda, M., Fujii, T., & Takahashi, E. (2013). Earth and Planetary Science Letters, 365, 253-262.
[6] Aubaud, C., Hirschmann, M. M., Withers, A. C., & Hervig, R. L. (2008). Contributions to Mineralogy and Petrology, 156(5), 607-625.
[7] Aubaud, C., Hauri, E. H., & Hirschmann, M. M. (2004). Geophysical Research Letters, 31(20).
[8] Sarafian, A. R., Nielsen, S. G., Marschall, H. R., Gaetani, G. A., Righter, K., & Berger, E. L. (2019). Geochimica et Cosmochimica Acta, 266, 568-581.
[9] O'Leary, J. A., Gaetani, G. A., & Hauri, E. H. (2010). Earth and Planetary Science Letters, 297(1-2), 111-120.
[10] Hauri, E. H., Shaw, A. M., Wang, J., Dixon, J. E., King, P. L., & Mandeville, C. (2006). Chemical Geology, 235(3-4), 352-365. [11] Tenner, T. J., Hirschmann, M. M., Withers, A. C., & Hervig, R. L. (2009). Chemical Geology, 262(1-2), 42-56. [12] Rosenthal, A., Hauri, E. H., & Hirschmann, M. M. (2015). Earth and Planetary Science Letters, 412, 77-87. [13] Potts, N. J., Bromiley, G. D., & Brooker, R. A. (2021). Geochimica et Cosmochimica Acta, 294, 232-254.
How to cite: Schwinger, S., Roy, A., Mallik, A., and Moitra, P.: How wet is the Moon? Insights from lunar evolution models and new water partitioning data , Europlanet Science Congress 2026, The Hague, The Netherlands, 7–11 Sep 2026, EPSC2026-1190, https://doi.org/10.5194/epsc2026-1190, 2026.
Please decide on your access
Please use the buttons below to download the supplementary material or to visit the external website where the presentation is linked. Regarding the external link, please note that Copernicus Meetings cannot accept any liability for the content and the website you will visit.
Forward to presentation link
You are going to open an external link to the presentation as indicated by the authors. Copernicus Meetings cannot accept any liability for the content and the website you will visit.
We are sorry, but presentations are only available for conference attendees. Please register for the conference first. Thank you.
You have already stored your personal programme. Please decide:
the present selections with my stored personal programmemy stored personal programme with the present selections
Please decide on your access
Please use the buttons below to download the supplementary material or to visit the external website where the presentation is linked. Regarding the external link, please note that Copernicus Meetings cannot accept any liability for the content and the website you will visit.
Forward to session asset
You are going to open an external link to the asset as indicated by the session. Copernicus Meetings cannot accept any liability for the content and the website you will visit.
We are sorry, but presentations are only available for conference attendees. Please register for the conference first. Thank you.