
Spectral properties of craters on (101955) Bennu
 1,
1,- 1CNRS - Observatoire de Paris, LESIA, Meudon cedex, France (prasanna.deshapriya@obspm.fr)
- 2Lockheed Martin Space, Denver, Colorado, USA
- *A full list of authors appears at the end of the abstract
In early December 2018, NASA’S Origins, Spectral Interpretation, Resource Identification, and Security–Regolith Explorer (OSIRIS-REx) [1] spacecraft arrived at the Near-Earth asteroid (101955) Bennu, [2,3] with the objective of globally characterizing the asteroid and returning a sample to Earth in 2023. Given this context, we probe the spectral nature of craters on Bennu, using spectral data acquired by the OSIRIS-REx Visible and InfraRed Spectrometer (OVIRS) [4].
2. Data and methods
We selected 46 craters from the crater catalogue of Bennu [5], depending on the availability of spectral data. The spectral data are calibrated as detailed in [6,7] and follow the photometric correction of [8], which results in reflectance factor (REFF) spectra corrected to the geometry of i=30°, e=0°, α =30°. We then derive an average spectrum of a crater from all the spectra whose footprints fall in its interior. From this average spectrum, we compute the following four spectral parameters to characterize the spectral properties of each crater.
1) Depth of the absorption band at 2.7 μm
2) Position of the 2.7-μm band minimum
3) Normalized spectral slope from 0.55 to 2.0 μm
4) Photometrically corrected REFF at 0.55 μm
For comparison with the crater spectra, we derive an average global spectrum from the Equatorial Station 3 (EQ3) data set [1] (acquired at phase angle α ∼ 8°), which has an almost complete spatial coverage of Bennu.
3. Results and Discussion
- Detection of a shortward shift of the 2.7-μm absorption band minimum
The minimum position of the 2.7-μm absorption band in some craters shifts towards wavelengths shortward of 2.74 μm, the measured band position in Bennu’s global average spectrum [9]. This absorption band is associated with hydrated phyllosilicates, resulting from aqueous alteration of Bennu in the past. The minimum position of this band is related to Mg/Fe ratio of the phyllosilicates [10,11], which depends on the extent of the alteration. This minimum position is therefore an indication of the alteration the material experienced. We measure this shift to be up to 25 nm. The presence of such a shift of this band can be translated into the presence of fresher and/or less altered material inside the craters, in the context of space weathering for C-complex asteroids [12, 13].
- Anti-correlation between spectral slopes and REFF suggests the presence of fine grains
The relation between spectral slopes and REFF varies across craters. Particularly, it varies even among different scans of the same crater. To better understand this variation, Pearson’s correlation coefficient (r) was estimated. We considered a series of spectra acquired as the spectrometer scans from the rim of a crater, across its center, and towards the rim again. The REFF and spectral slope of each spectrum of this scan were then compared using r. We find an anti-correlation between REFF and spectral slopes (increasing spectral slopes versus decreasing REFF) within some craters (Fig. 1). Laboratory experiments conducted on carbonaceous chondrite meteorites have shown that redder slopes are associated with finer grains [14]. We then checked image data of the corresponding footprints and found the presence of unresolved material at cm to sub-cm scales[LDS-(1] . As such, we suggest that the observed anti-correlation is an indication of the presence of fine grains inside craters.
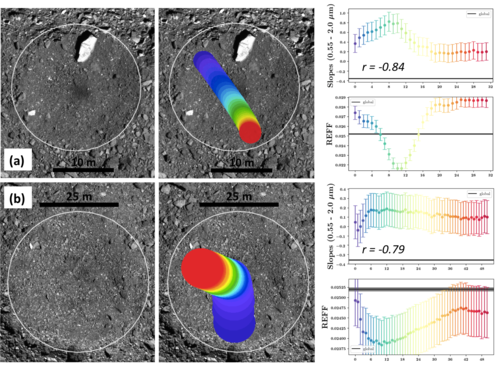
Fig. 1. Top (a): Crater ID 3 (Osprey) without and with footprints of an OVIRS scan. The rightmost graph shows the spectral slopes and REFF variation across the crater as the spectrometer scans through the crater, as seen on the rendering shown to its left. The x-axis represents the spectrum number of the scan and error bars are also given for the uncertainty of each parameter of a spectrum. r is evaluated at -0.84 for these two parameters, indicating a strong anti-correlation. Values of the global average spectrum are also given for comparison. Bottom (b): Similarly, a view of the crater ID 1 without and with the rendering of another OVIRS scan, where r is -0.79.
.
- Spectral heterogeneity detected in the largest equatorial crater on Bennu
We observe spectral heterogeneity in one of the oldest geological features on Bennu, the large equatorial crater located at -8°, 269° measuring 187 m in diameter [15]. We attribute this heterogeneity to mass movement [16]. We propose that such local spectral heterogeneities could be used as a tracer of mass movement across Bennu.
- Smaller craters are brighter, with deeper hydration and redder spectral slopes
By examining the spectral parameters of all the 46 craters, we independently confirm the results of [13] that smaller (presumably younger) craters are redder and brighter. In addition, the OVIRS data indicate they have deeper 2.7-μm bands (Fig. 2). Comparing global average spectral values of Bennu and crater frequency distributions as a function of the chosen spectral parameters, we find that, given the time, craters will evolve to assume the global average spectral properties of Bennu.
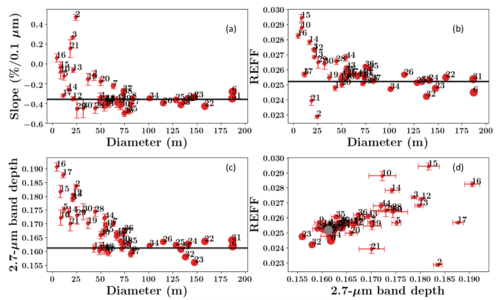
Fig. 2 Variations of normalized spectral slope, REFF and 2.7 μm band depth with the crater diameter are given in a, b, and c panels respectively. Variation of REFF with 2.7-μm band depth is plotted in the panel d. The sizes of data points are scaled to corresponding crater sizes and crater IDs are embedded next to respective data points.
References
[1] Lauretta, D. S. et al. 2017, Space Science Reviews, 212, 925. [2] DeMeo, F. E. et al. 2009, Icarus, 202, 160. [3] Clark, B. E et al. 2011, Icarus, 216, 462. [4] Reuter D. C. et al. 2017, Space Sci. Rev. 214, 54. [5] Bierhaus, E. et al. 2019, in EPSC–DPS2019–1134. [6] Simon, A. A. et al. 2018, Remote Sensing, vol. 10, issue 9, p. 1486 [7] Simon et al. (submitted) [8] Zou et al. (submitted). [9] Hamilton, V. E. et al. 2019, Nature Astronomy, [10] Farmer, V. C. 1974, in The Infrared Spectra of Minerals [11] Beck, P. et al. 2010, Geochimica et Cosmochimica Acta, 74, 4881. [12] Lantz, C. et al. 2017, Icarus, 285, 43. [13] DellaGiustina et al. – this conference [14] Cloutis, E. A. et al. 2018, Icarus, 305, 203. [15] Walsh, K. J. et al. 2019, Nature Geoscience. [16] Jawin et al. (submitted).
J D P Deshapriya, M A Barucci, E B Bierhaus, S Fornasier, P H Hasselmann, F Merlin, B E Clark, A Praet, M Fulchignoni, A A Simon, V E Hamilton, E A Cloutis, C Lantz, X. D. Zou, J-Y Li, D C Reuter, J R Brucato, G Poggiali, R T Daly, D Trang, S Ferrone, D N DellaGiustina, D S Lauretta.
How to cite: Deshapriya, J. D. P., Barucci, M. A., and Bierhaus, E. B. and the the OSIRIS-REx team: Spectral properties of craters on (101955) Bennu, Europlanet Science Congress 2020, online, 21 September–9 Oct 2020, EPSC2020-112, https://doi.org/10.5194/epsc2020-112, 2020