- 1INAF, IAPS, Roma, Italy (batiste.rousseau@inaf.it)
- 2Agenzia Spaziale Italiana, Roma, Italy
- Abstract
From July 2011 to September 2012, the Dawn spacecraft orbited the large asteroid (4) Vesta. A nearly global coverage of the surface was achieved by the Visible and InfraRed mapping spectrometer (VIR) [1]. The change of CCD temperature during the data acquisition affects the instrument spectral response. As a consequence, the acquired spectra experienced a change in spectral slope. Here we present a method to correct this issue; this method is similar to the one we applied for the VIR VIS data of Ceres [2].
- CCD detector temperature dependencies
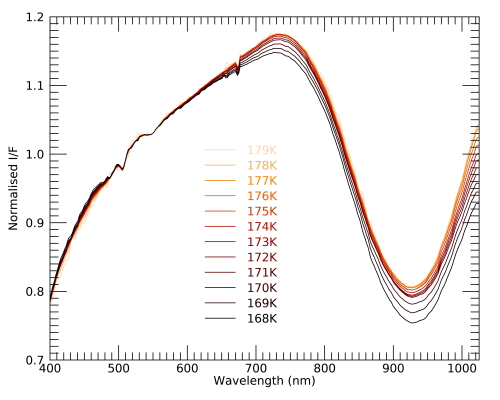
The acquisition of VIR data are organized in sequences during which several hyperspectral cubes are acquired. Within a given sequence, which may last several hours, the CCD temperature increases over time, while it goes back down in the time period between two sequences. The increase of CCD temperature induces a reddening of the spectra at visible wavelengths, as displayed in Fig. 1. To avoid misinterpretation and to retrieve a coherent shape of the Vesta spectra, a correction is therefore required.

Figure 1 – Median spectral variations observed for each CCD temperature recorded during the VH2 mission phase (normalized at 550nm).
- Spectral correction
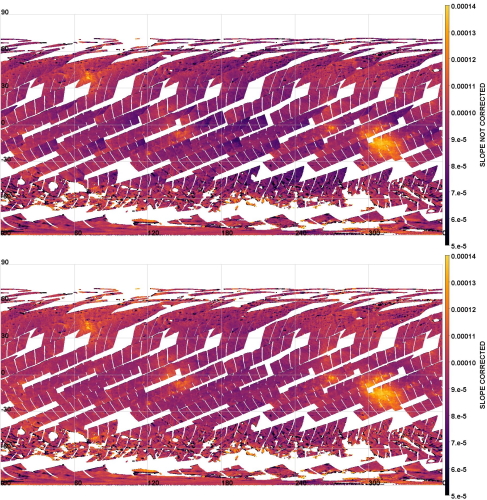
As in [2], we defined a correction factor for the different mission phases at Vesta, considering their particularities if necessary. This correction factor requires the definition of a reference temperature, at which the spectral response is considered reliable, and a corresponding reference spectrum. A previous analysis of the same effect on Ceres observations [2], revealed a reference CCD temperature of 177K. The correction has been applied on the mission phases during which VIR acquired VIS data. It allows to obtain a globally coherent dataset. Mapping and reliable spectral studies are then possible (see Fig. 2).

Figure 2 - Map of the spectral slope for the VH2 mission phase before (top) and after (bottom) the correction. The gradient observed, in each sequences, in the top panel vanishes in the bottom panel, after the application of the correction.
- Conclusion
The empirical method developed in [2] has now been applied to the Vesta data acquired by the VIS channel of the VIR spectrometer. This correction is mandatory to carry out reliable analysis of the Vesta surface at global and local scale.
- References
[1] De Sanctis, M. C., Coradini, A., et al. 2011, Space Science Reviews, 163, 329,
[2] Rousseau, B., Raponi, A., Ciarniello, M., et al. 2019, Review of Scientific Instruments, 90,
How to cite: Rousseau, B., De Sanctis, M. C., Ciarniello, M., Raponi, A., Scarica, P., Ammannito, E., Frigeri, A., Carrozzo, F. G., Tosi, F., and Fonte, S.: Dawn/VIR at Vesta: correction of the spectral variations induced by CDD temperature change on the visible channel, Europlanet Science Congress 2020, online, 21 Sep–9 Oct 2020, EPSC2020-116, https://doi.org/10.5194/epsc2020-116, 2020.

