
 1,1,1,1,1,1,1,3,4,5
- 1INAF, IAPS, Roma, Italy (batiste.rousseau@inaf.it)
- 2Italian Space Agency (ASI), Rome, Italy
- 3Deutsches Zentrum für Luft- und Raumfahrt (DLR), Berlin, Germany
- 4Jet Propulsion Laboratory, California Institute of Technology, Pasadena, USA
- 5University of California Los Angeles, Earth Planetary and Space Sciences, Los Angeles, CA, USA
- Abstract
The Dawn spacecraft orbited the dwarf planet (1) Ceres from March 2015 to October 2018. This allowed the Visible InfraRed spectrometer (VIR) [1] to achieve a nearly global hyperspectral mapping of the surface. Here we present, through several spectral indices, the characteristics of the Ceres’ surface as observed by VIR in the visible wavelengths.
- Introduction
The spectral signatures observed in the infrared range by VIR reveal the presence of (Mg-, NH4)-phyllosilicates and (Mg, Ca)-carbonates all over the surface of Ceres [2, 3, 4, 5]. Localized spots of Na-carbonates have been detected [5] and an organic rich material patch has been identified [6]. Buried ice is present in the Ceres subsurface [7] with several exposures of water ice visible on the surface [8]. The mineralogical composition of Ceres shows that the surface experienced a pervasive and lasting aqueous alteration. The surface of Ceres is very dark – reflectance of 0.034 at 550nm – due to the presence of a yet unidentified dark material. However, high albedo features, so-called “bright spots”, are widespread over the surface and mostly associated with crater peaks, rims or ejecta [9]. Furthermore, some other features of endogenous origin, like Ahuna Mons or the Occator faculae [10, 11], also show a high albedo.
While the surface of Ceres has been thoroughly studied in the infrared range, data coming from the VIR visible channel suffered from an instrumental artefact which prevented a detailed analysis in the 400-1000 nm spectral range. This issue has been recently solved [12] and here we analyse the Ceres’ surface with diverse spectral parameters.
- Data and methods
We analyse the VIR visible data from 400 nm to 950 nm (Fig. 1), taking advantage of all of the available corrections: denoising [13], spectral shape correction [14], photometric correction [15], and finally a correction that involved the detector’s temperature [12]. Then, by merging the data from four different VIR mission phases, we were able to build an 8 million pixels dataset, covering the surface of Ceres from 75°N to 60°S. We build maps of calibrated radiance factor at 550nm, of two RGB composites and three spectral slopes. This allows us to study the variation of albedos, colours and spectral behaviour across the surface of Ceres. In addition, we make those maps available for the community through the free software Aladin.

Figure 1 - Median spectra of Ceres in the visible range with the spectral slope parameters used in this study.
- Map of the spectral parameters
We observed that the RGB ratio composite, which highlights colour variations, and the spectral slope between 480 nm and 800 nm (Fig. 2), provide similar results, with impact craters and associated ejecta which appear spectrally flat to blue over a globally red surface. Some peculiar places are also well visible with those spectral maps, e.g. Ahuna Mons, Occator faculae or the organics-rich material at Ernutet crater.
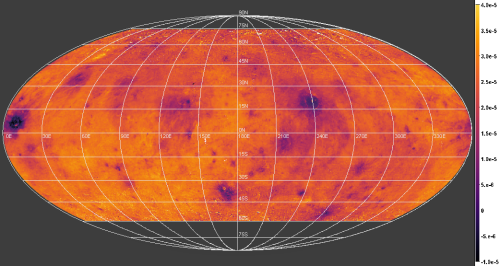
Figure 2 - Ceres global map of the spectral slope between 480nm and 800nm.
We will also present the spectral slope between 405 nm and 480 nm which characterizes the steep slope observed in that range and present interesting regional variations. The location and the shape of the slope 405-480 nm make us suggesting that this could be a proxy to follow an absorption due to the O2- -> Fe3+ charge transfer in a mineral which remain nevertheless unidentified with our data.
- Conclusion
The investigation of the Ceres surface at visual wavelengths reveals different spectral behaviours. While no absorption bands are revealed in the visible range, the spectral slope 405-480nm could be a proxy to follow a O2- -> Fe3+ charge transfer feature. On the other hand, the colours and the slope between 480nm and 800nm highlight impact craters and their ejecta as their composition or the physical properties could have been modified through different processes [16,17].
- References
[1] De Sanctis, M. C., Coradini, A., et al. 2011, Space Science Reviews, 163, 329
[2] De Sanctis, M. C., Ammannito, E., Raponi, A., et al. 2015, Nature, 528, 241
[3] De Sanctis, M. C., Raponi, A., Ammannito, E., et al. 2016, Nature, 536, 54
[4] Ammannito, E., DeSanctis, M. C., Ciarniello, M., et al. 2016, Science, 353, aaf4279
[5] Carrozzo, F. G., De Sanctis, M. C., Raponi, A., et al. 2018, Science Advances, 4, e1701645
[6] De Sanctis, M. C., Ammannito, E., McSween, H. Y., et al. 2017, Science, 355, 719
[7] Prettyman, T. H., Yamashita, N., Toplis, M. J., et al. 2016, Science, 355, 55
[8] Combe, J.-P., McCord, T. B., Tosi, F., et al. 2016, Science, 353, aaf3010
[9] Stein, N., Ehlmann, B., Palomba, E., et al. 2019, Icarus, 320, 188
[10] Zambon, F., Raponi, A., Tosi, F., et al. 2017, Geophysical Research Letters, 44, 97
[11] Scully, J. E., Bowling, T., Bu, C., et al. 2019, Icarus, 320, 213
[12] Rousseau, B., Raponi, A., Ciarniello, M., et al. 2019, Review of Scientific Instruments, 90
[13] Carrozzo, F. G., Raponi, A., De Sanctis, M. C., et al. 2016, Review of Scientific Instruments, 87, 124501
[14] Rousseau, B et al., submitted
[15] Ciarniello, M., De Sanctis, M., Ammannito, E., et al. 2017, Astronomy & Astrophysics [arXiv:1608.04643]
[16] Stephan, K., Jaumann, R., Krohn, K., et al. 2017, Geophysical Research Letters
[17] Schröder, S., Mottola, S., Carsenty, U., et al. 2017, Icarus, 288, 201
How to cite: Rousseau, B., De Sanctis, M. C., Raponi, A., Ciarniello, M., Ammannito, E., Frigeri, A., Ferrari, M., De Angelis, S., Carrozzo, F. G., Tosi, F., Schröder, S. E., Raymond, C. A., and Russell, C. T.: Dawn/VIR at Ceres: Visible spectral properties of the surface, Europlanet Science Congress 2020, online, 21 Sep–9 Oct 2020, EPSC2020-119, https://doi.org/10.5194/epsc2020-119, 2020.