Jupiter’s south polar region (~60-75ºS): Medium-term flow patterns from amateur and JunoCam maps
- 1British Astronomical Association, London, UK (jrogers11@btinternet.com)
- 2Independent scholar, Sydney, Australia
- 3JUPOS team
- 4Independent scholar, Stuttgart, Germany
- 5Planetary Science Institute, Tucson, AZ, USA
- 6Jet Propulsion Laboratory, California Institute of Technology, Pasadena, California, USA
Introduction
The Juno mission has given the first opportunity to characterise the flow patterns in Jupiter’s south polar region (SPR). Fast winds can be measured by comparing hi-res JunoCam images over up to 2 hours within a single pass, which shows in detail the motion of the southernmost jet at 64ºS (all latitudes planetocentric), and the circulations of cyclonic folded filamentary regions (FFRs) and anticyclonic white ovals (AWOs) further south [1]. However, Juno data cannot trace slower motions, in particular the drifts of these coherent circulations over days to months. Over the 53-day interval between perijoves a few AWOs can be recognised, but the interval is too long to recognise individual FFRs, which are the dominant structures of this region. The best amateur ground-based images now have sufficient resolution to identify and track some of these features. Here, we use maps and measurements from amateur images in 2016-2020, combined with JunoCam maps that provide secure identification of the features. Thus we find that pale patches in ground-based images usually represent FFRs in Juno maps, and some small light spots are AWOs.
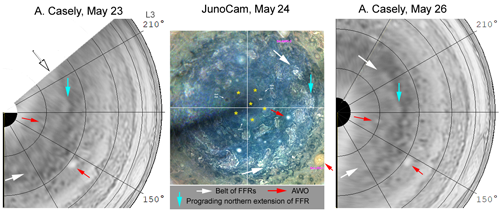
Measurements of drifts of FFRs over days (e.g. Fig.1)
From hi-res images by several amateur observers, we made south polar projection maps using WinJUPOS [2]. From blinking and animating these maps, we find that features in the SPR could only be tracked using v-hi-res images at intervals of less than 5 days; FFRs cannot be confidently identified over longer gaps as they change shape and position rapidly, although they may last for weeks. With maps spaced by 2-4 days, it is possible to observe their zonal motions and changes in outline. This is best done within a few days of a Juno perijove so that the features can be identified in the Juno map.
We selected several short series of maps in 2018 April-May and 2020 April-June that gave the clearest results, mostly using I-band images by A.C. as these were most consistent. Preliminary results show:
--Features at ~60-65ºS are prograding (around the S6 jet at 64ºS).
--Features at ~66-74ºS are retrograding (including FFRs in the belt), with speeds comparable to those of the AWOs (see below).
-- Around 66ºS, where JunoCam images often show FFRs in the belt apparently extending north towards the S6 jet, they can sometimes be observed being sheared accordingly, with the north part of the FFR prograding close to the jet (e.g. Fig.1).
Measurements of drifts of AWOs at ~70-74ºS over weeks to months
The JunoCam maps (e.g. Fig.1) show several AWOs in this latitude range at every perijove. We have tracked these white ovals from 2016 to 2018 using positions from JunoCam (our maps) and ground-based images (measurements and maps by the JUPOS team) plus a few from HST (OPAL maps). Fig.2 shows part of the chart.
The largest AWO (A) has been tracked from 2015 (pre-Juno) to 2020. Some other ovals have probably existed for at least 8 months each, regardless of latitude, although small ones cannot always be tracked between perijoves. Some ovals have merged or disappeared within the first two years of the Juno coverage. Others are seen passing each other in different latitudes in Juno maps, although we cannot tell which is which thereafter. There are also even smaller AWOs and eddies, so there may be rapid turnover by growth, wandering in latitude, and mergers or disappearance.
The resulting zonal drift profile (ZDP) is in Fig.3. These AWOs move with essentially uniform retrograde flow from 69.5-72.4ºS, [in L3, +42 (±3) deg/53d, -3.8 to -3.2 (±0.25) m/s], but at higher latitudes, above 72.4ºS, they show a steep gradient to faster (prograding) speeds. The highest-latitude and fastest speeds (spots P & E’: Fig.3) are close to those of small AWOs that drift irregularly around the periphery of the south polar pentagon of cyclones at ~80ºS [3]. There we found one shift of -44 deg in 53d, and several of ~-29 deg in 53d.
Conclusions
The main belt of FFRs is retrograding, along with the AWOs on its S edge. On its N edge, disturbance from FFRs often extends north to the S6 jet and is entrained by the prograding jet.
The ZDP (Fig.3) resembles that of high-latitude northern domains (N4, N5)[4], so the belt of FFRs and the loose ring of AWOs just south of it partially retain the organised structure of regular domains, although unconfined towards the pole.
South of 73ºS, long-term zonal drifts of AWOs become prograding with a steep gradient of mean speed increasing towards higher latitudes, where it becomes comparable to drifts of AWOs around the polar pentagon.
A companion abstract in the OPS1 session [1] describes the short-term wind measurements derived from the JunoCam maps at individual perijoves.
References
Figure 1. Examples of maps used for tracking FFRs in 2018.

Figure 2. Excerpt from chart tracking AWOs. (L2 moves at +8.0º/30d relative to L3.)
Figure 3.
How to cite: Rogers, J., Casely, A., Adamoli, G., Jacquesson, M., Vedovato, M., Bullen, R., Mettig, H.-J., Eichstädt, G., Hansen, C., Orton, G., and Momary, T.: Jupiter’s south polar region (~60-75ºS): Medium-term flow patterns from amateur and JunoCam maps, Europlanet Science Congress 2020, online, 21 Sep–9 Oct 2020, EPSC2020-153, https://doi.org/10.5194/epsc2020-153, 2020.

