
Lunar megaregolith mixing by impacts: Evaluation of the non-mare component of mare soils
 1,3,
1,3,- 1Museum für Naturkunde, Leibniz Institute for Evolution and Biodiversity Science, 10115 Berlin, Germany (tiantian.liu@mfn.berlin)
- 2Freie Universität Berlin, Malteserstr., 74-100, Haus D, 12249 Berlin, Germany
- 3Institute of Geodesy and Geoinformation Science, Technische Universität Berlin, 10623 Berlin, Germany
1. Introduction
The returned lunar mare soil samples contain highland anorthosites [1]. The source of those non-mare component has been debated since the Apollo epoch ([2]-[9]). In this study, a numerical model was developed to trace the diffusion of non-mare material with the cumulative effect of impact mixing and intermittent filling of mare material.
2. Model
In our previous work [10], a spatially-resolved numerical model was developed to investigate the diffusion of impact melts through impact mixing using the Monte Carlo method. In this study, we extend the capabilities of the model and take into account the volcanic basin infilling forming the lunar mare regions.
2.1 Ejecta distribution
The thickness distribution of proximal ejecta with distance from crater center (r) conforms to a power law, typically: δ(r) = Ar-3 [11]. Since the distal ejecta would fade into the background with continuous impact mixing and the thickness distribution becomes more uniform, we assume that the distal ejecta is also continuously distributed, and the thickness is calculated based on the extrapolated power law. Given the value of the minimum deposit thickness (0.01 m), the ejecta coverage range of each impact event can be calculated.
2.2 Melt volcanic filling
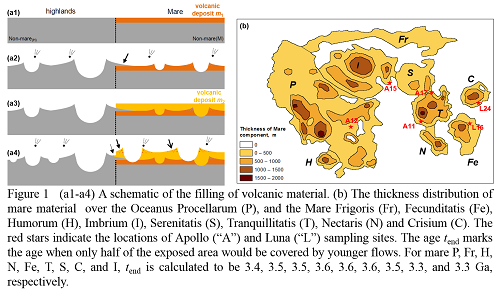
The qualitative eruption features of volcanic history of the Moon were pictured showing a trend of eruption flux from high to low but with different peak times [12]. The thickness distribution of volcanic deposits was systematically studied using crater-geometry techniques pioneered by De Hon (Figure 1b, HDeHon). For each mare region, the areas showing the thickest mare deposit are flooded first. As time goes on, mare material accumulates according to the eruption flux. The surrounding areas of thinner mare deposit are subsequently flooded. After the deposit of the youngest volcanic eruption, the thickness of volcanic deposit corresponds to HDeHon. A time step of 0.01 Ga is used to simulate such continuous eruption. At each step, the mare filling occurred within a certain contour region is taken to be uniformly emplaced (Figure 1a). Volcanic eruptions are assumed to initiate soon after the formation of the respective basin. Due to the great volume and the large flooding areas, only the early eruptions are considered [12]. The rough cessation time of the main filling (tend, Figure 1b) among different mare regions is determined based on the areas of differently-aged mare units.
3. Results and discussions
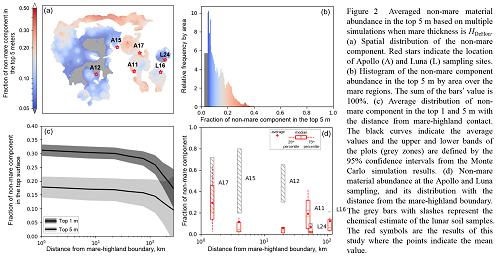
Given the uncertainty in the flux of mare filling, simulations with the varying setting of mare fillings are run to investigate the major factors affecting the non-mare mixing. Figure 2 shows the results when the mare thickness, cessation time of the major mare filling, and the peak time of eruption are taken to be HDeHon, tend and 3.8 Ga, respectively. By taking an average of the results from multiple simulations where the spatial configuration of generated craters is different, the regional differences are averaged out and the general features of non-mare material concentration are obtained. It shows that throughout the mare regions the non-mare component is present. The older mare surfaces accumulate more non-mare material. If most of the mare regions have filled mare material about 500 m in thickness since the formation of basins, the average and median fractions of non-mare components over all the mare regions are both ~0.1. In the top 5m, the average fraction of the non-mare material within 100 km is both about 0.2; between 100 km and 200 km, the non-mare abundance quickly decreases. In the very top surface (1 m) the non-mare abundance is greater. Apollo 11, 17 and Luna 16 located in the relatively old mare regions have the higher abundance of non-mare components (up to ~0.3). The Apollo 15, 12, and Luna 24 sampling sites located in the relatively young mare regions have a less non-mare component (~0.1).
By comparing the background composition with the geochemical analysis of the lunar mare soil samples, we infer the most plausible geologic processes that have significantly altered the material composition at the sampling sites: for the Apollo 15 and 17 mare soil samples, the large fraction of non-mare material is likely to have resulted from the downslope slumping or lateral transport of the nearby massifs. The Apollo 12 sampling site has a component of Copernicus ejecta. A mixing of both Copernicus ejecta and excavated local underlying material by high-velocity ejecta has altered the composition at the surface. The non-mare material contained in the Apollo 11 and Luna 24 mare soil samples could have been built up gradually by both long-time lateral and vertical mixing. The mare deposit at the Luna 16 landing site is likely to be relatively thin resulting in the abundant local-origin non-mare component.
4. Conclusions
A spatially-resolved numerical model tracing the diffusion of non-mare material was developed to study the source of the non-mare component in the lunar mare soil samples. We find that almost the entirety of the lunar mare regions contains some non-mare components. If the mare thickness is ~500 m, half of the areas possess a fraction ranging from 0.05 to 0.15. By comparing our results with the analysis of the collected soil samples, the most plausible geologic processes that may have altered the non-mare material abundance at the sampling sites are inferred.
References
[1] Wood J.A. (1970), JGR; [2] Rhodes J.M. (1977), Phil Trans Math Phys Eng Sci, 293-301; [3] Simon S.B. et al. (1982), LPSC, 371-388; [4] Huang Y. et al. (2017), JGR-Planets, 1–23; [5] Head J.W. (1982), The moon and the planets, 26(1), 61–88; [6] Budney C.J. and Lucey P.G. (1988), JGR-Planets, 103(E7), 16855–16870; [7] Evan A.J. (2016), GRL, 43(6), 2445–2455. [8] Aridson R. et al. (1975), The Moon, 13(1–3), 67–79; [9] Hörz, F. (1978), LPSC, 3311–3331; [10] Liu T. et al. (2020), Icarus, 113609. [11] Melosh, H.J. (1989), Oxford University. [12] Head J. W. and Wilson L. (1992), Geochim. Cosmochim. Acta, 56(6), 2155–2175.
How to cite: Liu, T., Michael, G., Zuschneid, W., Wünnemann, K., and Oberst, J.: Lunar megaregolith mixing by impacts: Evaluation of the non-mare component of mare soils, Europlanet Science Congress 2020, online, 21 September–9 Oct 2020, EPSC2020-186, https://doi.org/10.5194/epsc2020-186, 2020