Simulated phase curves of Vesta based on laboratory bidirectional reflectance spectroscopy
- 1Université Grenoble Alpes, CNRS, Institut de Planétologie et d'Astrophysique de Grenoble (IPAG), 414 rue de la Piscine, 38400 Saint-Martin d'Hères, France (sandra.potin@univ-grenoble-alpes.fr)
- 2Université Grenoble Alpes, CNRS, Inria, Grenoble INP, Laboratoire Jean Kuntzmann (LJK), Grenoble, France
Introduction: Reflectance spectroscopy is commonly used to retrieve chemical and physical properties of the Solar System bodies. However, the reflectance spectrum of a surface depends not only on its composition, but also on several parameters, including the viewing geometry [1]. Unlike laboratory measurements where the composition and texture of the sample and the geometry of measurement are fixed and controlled, observations of planetary bodies integrate spatial heterogeneities and changes of observation geometries due to both the shape and the topography of the surface. Here we compare two spectral photometric models to reproduce laboratory measurements of the Bidirectional Reflectance Distribution Functions (BRDFs) of a sample. We then employ the resulting models to calculate phase curves of the dwarf planet Vesta at different wavelengths and simulate spectral image cubes of its surface acquired with virtual telescopes.
Laboratory measurements: Bidirectional reflectance spectroscopy of a fine powder of howardite is acquired using the spectro-gonio radiometer SHADOWS [2], using the geometrical configurations presented in [1].
Inversion models: Inverting photometric models consists in estimating the best values of their parameters to reproduce the BRDFs sampled in the laboratory. It is then possible to generate the reflectance spectra that would have been measured under any geometrical configuration needed for the planetary simulation. We consider two photometric models: the Hapke model based on physical principles and a modified version of the Ross-Thick Li-Sparse model [3]. The model is able to recreate BRDFs of many natural surfaces and was recently modified by [4] to increase its performances. We use the following RTLSR form:
R(θ,Ω,Φ,λ)=fiso(λ)+fvol(λ)Kvol(θ,Ω,Φ)+fgeo(λ)Kgeo(θ,Ω,Φ)+ffwd(λ)Kvol(θ,Ω,Φ)
where the K terms play the roles of Lambertian (iso), volumetric (vol), geometric (geo), and forward scattering (fwd) components respectively. Spectral weights fiso , fvol , fgeo, and ffwd of the four components are determined by the surface reflectance properties. Note that the volumetric kernel contains a simplified treatment of the opposition effect with fixed width and amplitude as this effect is poorly constrained by our measurements. As for the inversion of the models, we consider a Bayesian framework using either a sampling approach based on Markov Chain Monte Carlo [5] or an inverse regression approach based on a preliminary learning step [6,7].
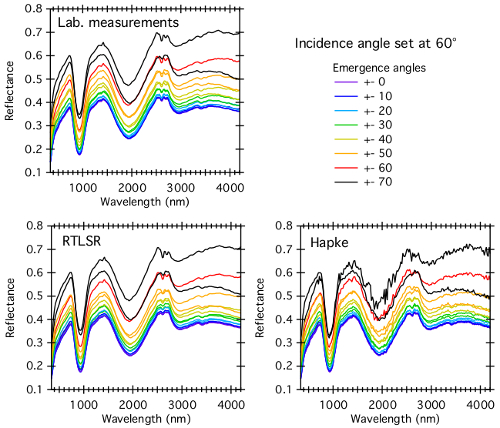
Results and comparison of the models: Both models, Hapke and RTLSR, accurately recreate the spectral features observed on the measurements (fig. 1)

Fig. 1: Bidirectional reflectance spectroscopy of the howardite measured in the laboratory (top left panel), and simulations based on inversion with the RTLSR model (bottom left panel) and with the Hapke model (bottom right model).
It has been shown previously [8] that the Hapke model can have difficulties when modeling the reflectance of chips that cannot be considered as loose agglomerates of grains. The parametric formulation of the RTLSR model can be a more robust descriptor of the BRDF but offers very limited physical interpretation. The sample of howardite used here consists of a fine powder with a narrow grain size distribution, thus the results found here are similar between the two models. We will thereafter use the RTLSR model, which has a slightly better SNR.
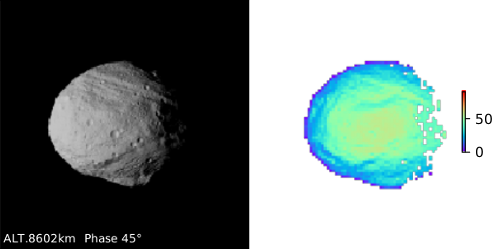
Application to surface: We then applied the RTLSR spectral BRDF on each facet of a shape model of Vesta. We create a simulated Vesta covered with the fine powder of howardite over the whole surface. We then simulate a serie of images taken during the fly-by of a spacecraft near this simulated object, with a fixed illumination source and a range of phase angle from 6° to 135°. Along with the varying phase angle due to the fly-by, the shape of the body and its surface topography induce local variations of the geometrical configuration (fig. 2), thus creating variations in the reflectance spectra.

Fig. 2: Left: Radiance image of Vesta at 400nm as observed with a representative imaging spectrometer. Right: Local emergence angles measured on each facet of the shape model of Vesta.
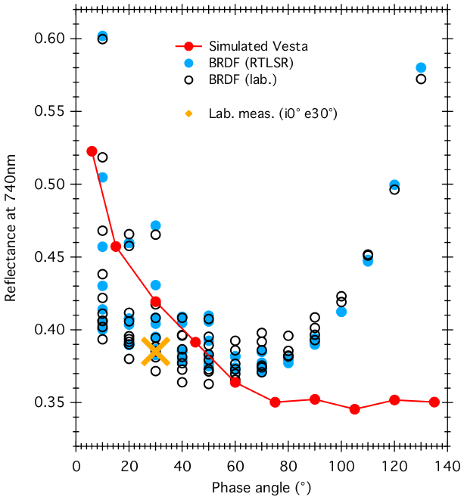
In the case of an unresolved observation, the reflectance spectrum of a body is integrated over its whole surface, thus averaging the reflectance at fixed phase angle over all geometrical variations due to the shape and topography. We then compare various spectroscopic and photometric phase curves of the simulated Vesta and the howardite sample measured in the laboratory as exemplified in fig. 3.

Fig. 3: Photometric phase curve of the simulated Vesta integrated over the whole surface (red solid line) compared to the BRDFs values measured in the laboratory (black circles) and inverted using the RTLSR model (blue circles).
The shape of the phase curve of the simulated Vesta shows a decreasing reflectance with increasing phase angle, typical of the micro and macroscale structures of the surface, drastically different from the phase curve measured in the laboratory. When comparing the spectroscopic parameters of the simulated Vesta to laboratory measurements acquired in the typical geometry of i0° e30°, we show that in the laboratory the reflectance is underestimated, while the spectral slope and amplitude of the absorption features are overestimated. As the composition of the surface of the simulated body is fully homogeneous, these differences are only due to the shape and topography of the asteroid.
Conclusion: We show here and application of a laboratory measured BRDF for the simulation of spectral image cubes and phase curves of a planetary body. If the observed body is not fully resolved, as it is often the case for asteroids spectroscopy, the measured reflectance spectrum is averaged over the whole surface. The observed spectra can be different from those measured in the laboratory, only because of geometrical effects due to the shape and topography of the surface.
References: [1] S. Potin et al. (2019) Icarus, 333, 415-428. [2] S. Potin et al. (2018) Applied Optics, 57, 8279-8296. [3] W. Lucht et al. (2000), IEEE Trans. Geosci. Remote Sens., 38, 977-998. [4] Z. Jiao et al. (2019) Remote Sens. Env., 221, 198-209. [5] F. Schmidt et al. (2015), Icarus, 260, 73-93. [6] A. Deleforge et al. (2014), Stat. & Comp. [7] B. Kugler et al. (2020), this conference [8] S. Potin et al. (2020), 51th LPSC, 1874.
How to cite: Potin, S., Douté, S., Kugler, B., Forbes, F., Beck, P., and Schmitt, B.: Simulated phase curves of Vesta based on laboratory bidirectional reflectance spectroscopy, Europlanet Science Congress 2020, online, 21 September–9 Oct 2020, EPSC2020-201, https://doi.org/10.5194/epsc2020-201, 2020

