

- University of Leicester, School of Physics and Astronomy, Leicester, United Kingdom of Great Britain and Northern Ireland (ortk1@le.ac.uk)
Introduction: Europa’s surface and subsurface will be explored by robotic spacecraft in the late 2020s and early 2030s, but significant advances from astronomical facilities will be possible in the coming decade. Its surface is composed of water ice, with significant contamination from sulfuric acid hydrates and potentially salts [2,10]. Infrared spectra from the Galileo orbiter Near-Infrared Mapping Spectrometer (NIMS) provide the highest spatial resolution IR spectra of Europa but with limited coverage in many locations. In recent years, ground-based adaptive optics observations in the infrared with Keck/OSIRIS and VLT/SINFONI have provided new insights into the distributions of surface materials on Europa [2,4,10].
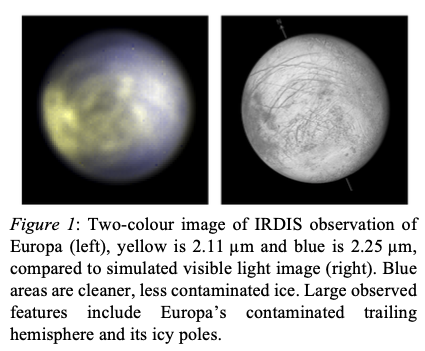
Datasets: Near-IR observations of Europa were taken during VLT/SPHERE [1] science verification in December 2014. Europa’s anti-jovian hemisphere was observed, with a sub-observer longitude of 192°W. Data were taken in IRDIFS_EXT mode, allowing simultaneous imaging with the Integral Field Spectrograph (IFS) and Infrared Differential Imaging Spectrometer (IRDIS) sub-systems of the SPHERE instrument. IFS [5,12] produces image cubes with spectra from 0.95 to 1.65 μm (R∼30). It has a high spatial resolution, with a pixel size of 7.46 mas/px, corresponding to ∼25 km/px at Europa. Accounting for diffraction, this allows features ∼150 km across to be resolved. For example, Europa’s largest lineae are resolved in Figure 1, the first time this has been possible from Earth. IRDIS produced simultaneous imaging through two filters, with transmissions centred on 2.11 and 2.25 μm. We have also analysed a series of Galileo/NIMS observations with similar spectral and spatial coverage to our SPHERE data. One of the detectors on the NIMS instrument failed early in the Galileo mission at Jupiter, meaning the NIMS coverage of the SPHERE spectral range is limited.
The datasets have been reduced and cleaned to produce mapped spectral cubes of Europa’s anti-Jovian hemisphere. Images are photometrically corrected to remove the variation in brightness towards the edge of the observed disc caused by varying viewing angles and illumination levels of the surface. Our photometric correction uses the Oren-Nayar model, which generalizes the Lambertian model to more accurately represent rough surfaces [13]. This enables regions at large emission angles to be mapped accurately, providing significant improvements over the Lambertian model which overcorrects the brightness towards the edge of the disc. The Oren-Nayar correction allows our mapping to reach emission angles ∼70°, higher than previous studies that extend to 50° to 60° [2,7,10].
Spectral modelling: We analyse the mapped cubes by fitting to laboratory spectra from reference cryogenic libraries. These reference spectra include water ice, sulfuric acid, and hydrated salts [3,8,11]. We have developed an implementation of the Hapke bidirectional reflectance model [9] which we use to model a range of ice grain sizes.
Our fitting routine is run for each observed location to produce compositional maps of Europa’s anti-jovian hemisphere. We treat each observed spectrum as a linear combination of discrete endmembers Ei(λ) with respective abundances ai, where the modelled spectrum is calculated as M(λ)=∑aiEi(λ). Our routine uses Markov Chain Monte Carlo techniques [6] to model an observed spectrum, producing a posterior distribution of fitted abundance values for each endmember, and combinations of different endmembers (Figure 2).
The median of each distribution is used as the best estimate abundance for each endmember, and the width of the distribution is used to estimate the uncertainty on that central value. The posterior distributions of combinations of endmembers can likewise be calculated, accounting for correlations in the uncertainties of the summed endmembers. Whilst the uncertainty on a specific endmember’s abundance may be large (e.g. a specific ice grain size), the uncertainty of the abundance of a combination of endmembers is often much smaller (e.g. the total abundance of all ice endmembers).
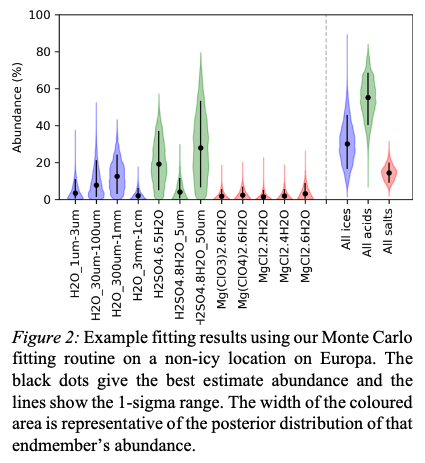
The use of Monte Carlo techniques allows better exploration of the endmember parameter space than a simple linear fit, and the uncertainty estimates allow more detailed understanding of potential detections.
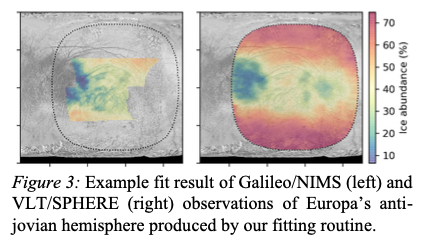
Modelling results from the SPHERE and NIMS data show strong similarities and are consistent with previously observed compositional features. These include the leading-trailing hemisphere difference in water ice fraction and the structure of non-ice material (mainly sulfuric acids) from the anti-jovian point to Powys Regio. Salts have a lower abundance and appear spatially constrained to geological features including Dyfed and Powys Regio, and the region around the northern hemisphere lineae.
Acknowledgments: We would like to thank the Royal Society for supporting this work.
References: [1] Beuzit et al 2019, arXiv: 1902.04080. [2] Brown & Hand 2013, The Astronomical Journal, 145(4):110. [3] Carlson, Johnson, & Anderson, 1999, Science, 286(5437):97–99. [4] Carlson et al., 1992, The Galileo Mission, pages 457–502. Springer. [5] Claudi et al., 2008: Ground-based and Airborne Instrumentation for Astronomy II, volume 7014, page 70143E. International Society for Optics and Photonics, SPIE. [6] Foreman-Mackey et al., 2013, Publications of the Astronomical Society of the Pacific 125(925):306. [7] Grundy et al., 2007, Science, 318(5848):234–237. [8] Hanley et al., 2014, Journal of Geophysical Research: Planets, 119(11):2370–2377.[9] Hapke, 1993, Theory of reflectance and emittance spectroscopy,Cambridge University Press. [10] Ligier et al., 2016, The Astronomical Journal, 151(6):163. [11] McCord et al., 1999, Journal of Geophysical Research: Planets, 104(E5):11827–11851. [12] Mesa et al., 2015, Astronomy & Astrophysics, 576:A121. [13] Oren & Nayar, 1944, Proceedings of the 21st annual conference on Computer graphics and interactive techniques, pages 239–246. ACM.
How to cite: King, O. and Fletcher, L.: Compositional mapping of Europa with VLT/SPHERE and Galileo/NIMS using Markov Chain Monte Carlo Fitting , Europlanet Science Congress 2020, online, 21 Sep–9 Oct 2020, EPSC2020-298, https://doi.org/10.5194/epsc2020-298, 2020.