New approach for systemic analysis of Hermean pyroclastic deposits
- 1LESIA, Observatoire de Paris, Université PSL, CNRS, Sorbonne Université, Université de Paris, 5 place Jules Janssen, 92195 Meudon, France
- 2Aurora Technology B.V., European Space Astronomy Centre/ESA, Madrid, Spain
Introduction
The MErcury Surface, Space ENvironnement, GEochemistry and Ranging (MESSENGER) mission highlighted the explosive volatile-driven volcanism on the surface of Mercury (Head et al. 2008). Witnesses of this volcanic activity are irregularly shaped depressions surrounded by deposits that are spectrally bright and red relative to the average surface of Mercury (Head et al. 2008, Kerber et al. 2009). The characteristics of these deposits (association with volcanic vents, spectral anomaly and diffuse margins) and the lack of Hermean atmosphere suggest an emplacement by ejection of pyroclasts along ballistic trajectories. A catalogue of around 200 candidates for pyroclastic deposits was established (Kerber et al. 2011, Goudge et al. 2014, Thomas et al. 2014). Besse et al. (2020) studied 14 of these deposits using the Mercury Atmospheric and Surface Composition Spectrometer (MASCS) on board MESSENGER. In some cases, the size of the deposit estimated in the previous catalogues (Kerber et al. 2011, Goudge et al. 2014, Thomas et al. 2014) using multispectral images is found to be underestimated. The spatial extent of the pyroclastic deposits is crucial to estimate the total amount of lava and the quantity of volatile species needed to drive the volcanic eruption on Mercury. Here we present the preliminary results of a global survey of pyroclastic deposits on the surface of Mercury using a spectral database containing MASCS observations.
Goals and preliminary results
We base our analysis on the MASCS data sets available on the Planetary Data System (PDS), grouped in a spectral database containing observations, along with and metadata provided by the MESSENGER team. The Mercury Surface Spectroscopy (MeSS) project provides MASCS spectra corrected according to the method proposed by Besse et al. (2015). From these corrected spectra we have computed several spectral parameters available in the database such as the UV-Downturn (Goudge et al. 2014) describing the drop of the reflectance in the ultraviolet (UV), spectral slope in the visible domain and the reflectance at 750 nm. The two first spectral parameters were used in the study of Besse et al. (2020) to determine the extent of some pyroclastic deposits. Our main objective is to extend this analysis to all the pyroclastic deposits of Mercury’s surface.
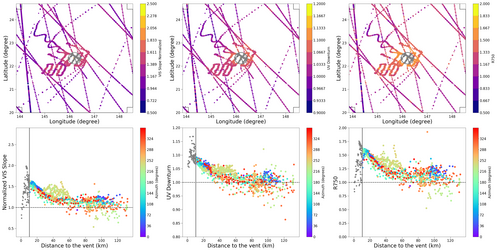
Thanks to the database we confirm that 40% of pyroclastic deposit candidates show a spectral anomaly with MASCS. In fact, the value of the spectral parameters is higher in the deposit than in the surrounding terrain (example in Figure 1). Therefore, we normalized the spectral parameters by a local mean for each cases. These spectral parameters decrease from the vent up to a certain distance before stabilizing around the local mean which we interpret as the limit of the deposit. We have implemented a method that allows us to determine the extent of pyroclastic deposits in a systematic way and with a level of confidence. The first results are in agreement with the previous results obtained by Besse et al. (2020) and show the robustness of the method.

Figure 1: Spectral analysis of Agwo facula using The MeSS (Mercury Surface Spectroscopy) database. Top: Maps of the Agwo facula region, each dot corresponds to MASCS spectrum. The color code shows the value of the spectral parameters (visible slope, UV-Downturn, near-infrared slope). The grey circle represents the limit of the volcanic vent. The squares indicate the regions where the local mean is calculated. Bottom: Normalized spectral parameters versus the distance to the volcanic vent. The horizontal black lines indicate the value of the local mean. The color code represents the geographical azimuth of the observations.
Acknowledgments
The authors acknowledge the Centre National d'Etudes Spatiales (CNES) for support.
The European Space Agency supported the research of S. Besse and O. Barraud through the European Space Astronomy Centre (ESAC) Faculty council.
References
Head J.W, et al. (2008), Science, 321, 69-72
Kerber, L. et al., (2009), Earth Planet. Sci. Lett. 285
Kerber, L. et al., (2011), Planet. Space Sci., 59
Goudge, T. A. et al., (2014), J. Geophys. Res. Planets, 119
Thomas, R. et al., (2014), J. Geophys. Res. Planets 119
Besse, S. et al., (2020), J. Geophys. Res. Planets, 125
Besse, S. et al., (2015), J. Geophys. Res. Planets, 120
How to cite: Barraud, O., Doressoundiram, A., Besse, S., Cornet, T., and Munoz, C.: New approach for systemic analysis of Hermean pyroclastic deposits, Europlanet Science Congress 2020, online, 21 Sep–9 Oct 2020, EPSC2020-301, https://doi.org/10.5194/epsc2020-301, 2020.

