- 1Space Telescope Science Institute, Baltimore, United States of America
- 2University of Southern California, Los Angeles, United States of America
- 3Southwest Research Institute, Boulder, United States of America
- 4University of Virginia, Charlottesville, United States of America
- 5New Mexico State University, Las Cruces, United States of America
Introduction. Pluto was first identified in 1930 and since that time has completed less than 40% of its orbit (248 Earth-years). Studies of Pluto's surface composition have been ongoing for only a small subset of this period, beginning with the first evidence for CH4 (methane) ice on the surface [1] only a few years before Pluto reached equinox in 1988 and perihelion in 1989. Therefore, the majority of spectroscopic studies have taken place during northern hemisphere spring, as Pluto recedes from the Sun. Since Pluto has a ~122° obliquity and an eccentric (e=0.25) orbit, these seasonal transitions ought to be extreme [2] and potentially observable over time. Simulations of Pluto's surface evolution suggest that the entire northern hemisphere, except for Sputnik Planitia, will be devoid of volatile ices (N2, CO, CH4) by 2030 [3]. Given that in 2015 New Horizons saw extensive deposits of volatile ices in the northern hemisphere [4,5] the removal process must occur relatively rapidly, if the models are correct. The duration of the New Horizons flyby was too brief to observe large-scale changes in surface composition or ice distribution.
Observations. One method for evaluating changes on Pluto on timescales of a few years while accounting for rotational variability is to obtain spectra at the same sub-observer latitude and longitude roughly a year apart [6]. This cadence is made possible by the inclination of Earth's orbit with respect to the ecliptic, which presents a limited range of sub-observer latitudes on Pluto repeating ~14 months later. In order to quantify Pluto's short-term surface changes, while correcting for its rotational variability, we designed a spectroscopic observing program specifically to make use of these “matched pairs.” Pluto was observed on 13 nights between June 2014 and August 2017 using TripleSpec, a cross-dispersed spectrograph [7] at the Apache Point Observatory’s Astrophysical Research Consortium 3.5-meter telescope. These spectra were obtained at an average resolving power of ~3500 from 0.91 to 2.47 μm. Matched pairs typically corresponded to spectra obtained in June of one year and August of the next year, at roughly the same (±10°) sub-observer longitude, avoiding opposition where the viewing geometry at small phase angles affects band depth and width [8]. Pluto’s solar phase curve is also relatively flat between phase angles of 0.5-1.5° [9], the range over which the matched pair components were acquired. Therefore, any differences in viewing geometry do not significantly affect the spectra.
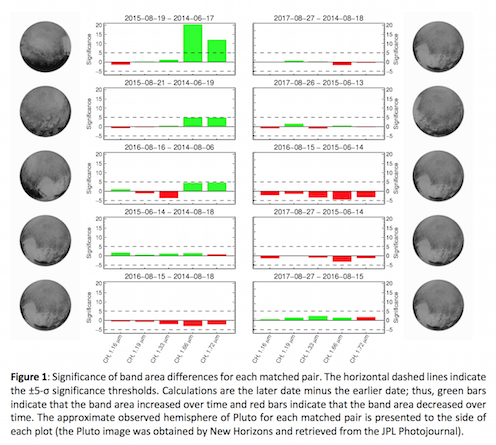
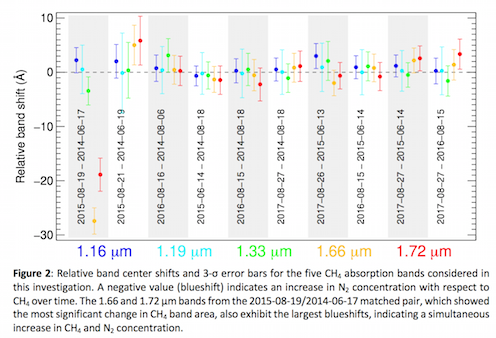
Analysis and Results. To evaluate changes in surface composition over time, we computed integrated band areas for the 1.16, 1.19, 1.33, 1.66, and 1.72 μm CH4 absorption features in each of the corrected nightly spectra. We also calculated shifts in the band centers for the same features as a proxy for the amount of N2 in solution with CH4 [10]. The changes in CH4 band depth and band center position for each matched pair (later date minus newer date) are presented in Figures 1 and 2, respectively. Only those changes detected at ±5-σ for band depth and ±3-σ for band center shift were considered statistically significant. The only significant changes were detected between 2014-06-17 and 2015-08-19, centered on a sub-observer longitude of ~280°, which showed an increase in CH4 band areas as well as a blueshift in the band centers. No other matched pair showed a significant change over the corresponding time period.

Discussion. Due to scheduling and weather, the majority of the matched pairs were obtained of the anti-Charon hemisphere, home to the bright, volatile-rich Sputnik Planitia. However, the only sub-observer hemisphere with a statistically significant band area increase included only a small portion of Sputnik but a large portion of the low-albedo, volatile-poor Cthulhu Macula [4,5]. The sub-observer hemisphere for the 2015-08-19/2014-06-17 matched pair was unique and contained the largest fraction of Cthulhu Macula.
The increase in CH4 band areas and the blueshifting of the band centers in the spectra of one unique sub-observer hemisphere between June 2014 and August 2015, and the lack of strong evidence for any decrease in band areas on any sub-observer hemisphere, points to real short-term changes in Pluto's surface composition over this time frame. The lack of significant detections on other hemispheres centered on Sputnik does not necessarily indicate a lack of changes on those hemispheres. Sputnik is a large reservoir of volatile ices that models suggest undergoes little change over a Pluto orbit [3], so the spectra of these sub-observer hemispheres should be dominated by Sputnik’s contribution, drowning out smaller changes on other areas of the surface. Conversely, the 2015-08-19/2014-06-17 sub-observer hemisphere contains a large portion of the volatile-depleted Cthulhu Macula, which would amplify the same changes in surface composition in the spectra.

On the sub-observer hemispheres not dominated by Sputnik, volatile N2 and CH4 ices are present primarily in the north polar region, with alternating latitudinal bands of CH4 diluted with N2 (55-90° N and 20-35° N) and N2 diluted with CH4 (35-55° N), as measured by New Horizons in 2015, about one month prior to the second half of the 2015-08-19/2014-06-17 matched pair [5]. The observed changes in the spectra of this sub-observer hemisphere indicate both an increase in CH4 concentration and an increase in N2 concentration in the north polar regions. While this sounds contradictory, it can be achieved by preferential sublimation of more-volatile N2 from latitudes northward of 55° as Pluto approaches northern hemisphere summer, resulting in an increase in CH4 concentration in those regions, combined with deposition of that N2 onto the latitudinal band from 35-55°.
References.
[1] Cruikshank, D.P., et al., 1976. Science 194, 835-837. [2] Binzel, R.P., et al., 2017. Icarus 287, 30-36. [3] Bertrand, T., Forget, F., 2016. Nature 540, 86-89. [4] Grundy, W.M., et al., 2016. Science 351, aad9189. [5] Protopapa, S., et al., 2017. Icarus 287, 218-228. [6] Grundy, W.M., et al., 2013. Icarus 223, 710-721. [7] Wilson, J.C., et al., 2004. SPIE 5492, 1295-1305. [8] Pitman, K., et al., 2017. P&SS 149, 23-31. [9] Verbiscer, A., et al., 2019. EPSC-DPS2019-1261. [10] Protopapa, S., et al., 2015. Icarus 253, 179-188.
How to cite: Holler, B., Yanez, M., Young, L., Protopapa, S., Verbiscer, A., and Chanover, N.: Evaluating Temporal Evolution of N2 and CH4 Ices on Pluto with APO/TripleSpec from 2014-2017, Europlanet Science Congress 2020, online, 21 Sep–9 Oct 2020, EPSC2020-336, https://doi.org/10.5194/epsc2020-336, 2020.

