
Venus upper atmosphere revealed by a GCM: Temperature, CO, O2 and O distribution in the puzzling transition region
 1,1,4,
- 1Instituto de Astrofísica e Ciências do Espaço (IA), FCiências.ID - Associação para a Investigação e Desenvolvimento de Ciências, Lisbon, Portugal (ggilli@oal.ul.pt)
- 2McGill University, Montreal, Canada
- 3Laboratoire de Météorologie Dynamique (LMD/IPSL), Centre National de la Recherche Scientifique, Sorbonne Université, École Normale Supérieure, École Polytechnique, Paris, France
- 4LATMOS/IPSL, Paris, France
- 5University of California, Los Angeles, CA, USA
Introduction
Venus Global Climate Models (VGCM) are powerful tools to investigate the amount of data recently acquired by Venus Express (VEx) and Akatsuki missions, as well as from ground-based telescopes. Our understanding of the Venusian climate has increased with recent progresses with these models. VEx observations revealed a more variable atmosphere than expected, in particular in the “transition” region (~70-120 km) between the retrograde superrotating zonal flow (RSZ) and the day-to-night circulation. This region exhibits latitude and day-to-day variations of temperature up to 80 K above 100-km at the terminator, and apparent zonal wind velocities measured around 96-km on the Venus nighttime highly changing in space and time. Those variations are not fully explained by current 3D models and specific processes (e.g. gravity wave (GW) propagation, thermal tides, large scale planetary waves) responsible for driving them are still under investigation. The role of convectively generated GW and their impact on zonal wind and temperature in the region of aerobraking can be explored with an update version of the Institut Pierre-Simon Laplace (IPSL) VGCM, thanks to the inclusion of a stochastic non-orographic GW parameterization based on the Earth GCM. A vertical coupling between the cloud level and the thermosphere generated by GW, modulated and periodically filtered by the oscillation of the background zonal wind associated with the Kelvin wave was recently suggested in Nara et al.2020. This mechanism can partially explain the observed variation of oxygen UV airglow in the dayside (Navarro et al.in preparation).
The IPSL VENUS GCM: data-model validation
This climate model has been used recently to investigate all regions of the Venusian atmosphere, as it covers the surface up to the thermosphere (150 km) (Gilli et al.2017; Garate-Lopez&Lebonnois2018, Navarro et al.2018). It involves a photochemical module with a simplified cloud scheme that enables the study of the composition and the coupling with the upper atmosphere, where non-LTE, EUV heating processes, molecular diffusion, play a crucial role on the thermal balance. Below 100-km, the infrared energy budget is computed based on a Net Exchange Rate formalism. The cold collar structure has been modelled when taking into account the latitudinal distribution of the cloud structure. Recent improvements in non-LTE parameterization included in the IPSL-VGCM allow a better representation of the thermal structure of Venus above 90-km. Overall, our model is able to simulate well the succession of warm and cool layers above 80-km, which is one of remarkable feature that has been systematically detected, but the intensity of the local nighttime mesospheric warm layer is about 20 K larger between 90-km and 120-km altitudes, approximately. CO2, CO and O densities above 100-km are also in good agreement with available dataset in term of trend and order of magnitude (Gilli et al.in preparation). The region between the cloud tops and 100-110 km is still puzzling, not only because of more substancial variability, especially at nighttime in contrast with a dynamically quieter daytime, but also because our model is reproducing quite well SOIR/VEx profiles at the evening (ET) but not at the morning terminator (MT), especially at low latitudes (Fig.1). Possible interpretations of those discrepancies will be discussed (e.g wind asymmetries produced by GW drag, fine-tuning of the current parameterization,consequence of the lower’s atmosphere superrotation extending up to 95-km).


Figure 1: Example of comparison of simulated CO densities by the IPSL-VGCM (green dashed line) with retrieved measurements (blue dots) and standard deviations at equatorial latitudes (0-30N), extracted from the Venus Atmosphere from SOIR measurements at the terminator (VAST) (Vandaele et al.2016). Top: Morning terminator. Bottom: Evening terminator.
Can we explain the observed variability by mean of 3D simulations?
Diurnal and latitudinal distribution of CO and O, together with O2 airglow are used to shed a light on the dynamics in a region poorly constrained by wind measurements and where direct measurements of winds are not possible. Several observations demonstrated that both RSZ and subsolar-to-antisolar (SS-AS) flow affect the global distribution of CO and other light species like NO/O2 airglows (e.g. Lellouch et al.2008, Moullet et al.2012, Gerard et al.2014) at mesospheric altitudes (70-120 km). The majority of Doppler winds retrieved at mesospheric and lower thermospheric altitudes (e.g. Clancy et al.2015) also suggested the presence of a substantial retrograde zonal flow at altitudes above 90 km.
We focus here on CO which, as other light species, is expected to pile up at the converging stagnation point of the wind field (i.e. where the horizontal velocity converges to zero). This point is at the anti-solar point for pure SS-AS flow and displaced toward the morning terminator when a retrograde zonal flow is added. The position of the maximum and its magnitude depend on the relative values of equatorial velocity and a maximum cross-terminator velocity. Our simulations indicate that a weak retrograde wind is present in the mesosphere, up to about 120-km, producing the CO bulge displacement toward 2h-3h in the morning. Moreover, simulations show periodic events of transient, local maxima of O2 nightglow at high latitudes, in agreement with observations (Hueso et al.2008, Soret et al.2014). These events are caused by the 5-day period Kelvin wave when it passes through the nightside, ejecting recombined molecular oxygen poleward.
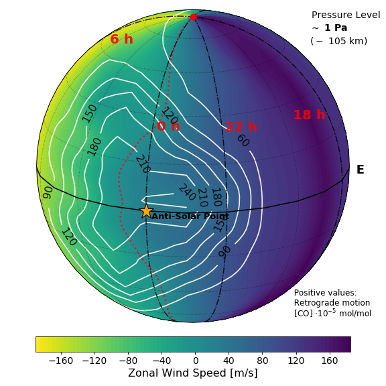
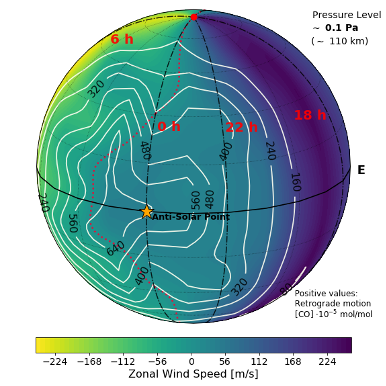
Figure 2: 3D maps of simulated CO volume mixing ratio (contour line) and zonal wind (color) by the IPSL-VGCM at two pressure layers: 1 Pa (top panel) and 0.1 Pa (bottom panel). The star indicates the Anti-Solar point. Dotted lines represent the region were horizontal wind converges to zero.
Acknowledgments: GG was supported by European Union′s Horizon 2020 research and innovation programme under the Marie Sklodowska-Curie grant agreement No.796923, and by FCT through the research grants UIDB/04434/2020,UIDP/04434/2020,P-TUGA PTDC/FIS-AST/29942/2017
References:
Garate-Lopez & Lebonnois 2018, Icarus 314,1-11; Gilli et al.2017, Icarus 281,55-72; Navarro et al.2018,Nature Geosci. 11,478-49; Nara et al.2020, JGR(Planets), 125,E006192; Clancy et al.2015,Icarus, 254,233-258; Moullet et al.2012,Vol 546,12pp;Lellouch et al.2008,PSS, 56,1355-1367; Vandaele et al. 2016,Icarus 272,48-59; Hueso et al. 2008,JGR,Vol.113;Soret et al. 2014,Icarus,217, 849-855; Gerard et al.2014,Icarus 236,902-103
How to cite: Gilli, G., Navarro, T., Lebonnois, S., Quirino, D., Silva, V., Lefevre, F., and Schubert, G.: Venus upper atmosphere revealed by a GCM: Temperature, CO, O2 and O distribution in the puzzling transition region, Europlanet Science Congress 2020, online, 21 Sep–9 Oct 2020, EPSC2020-353, https://doi.org/10.5194/epsc2020-353, 2020.