
Evidence for a close in satellite in the large TNO Varuna
 1,2,2,2,2,
- 1University of Central Florida, Florida Space Institute, Orlando, United States of America (estela@ucf.edu)
- 2Instituto de Astrofísica de Andalucía (IAA-CSIC), Granada, Spain
- 3LESIA, Observatoire de Paris, Meudon, France
Introduction
20000 Varuna is one of the most interesting TNOs due to its peculiar physical properties. It rotates relatively fast with a period of 6.3435674 h Santos-Sanz et al. (2013), producing a double-peaked rotational light-curve with a very large amplitude, ~ 0.45 mag, dominated by the body shape (e.g., Jewitt & Sheppard 2002, Lellouch et al. 2002, Hicks et al. 2005, Belskaya et al. 2006). Varuna's area-equivalent diameter is ~700 km (Lellouch et al. 2013) and its estimated density, under the assumption of hydrostatic equilibrium (Chandrasekhar et al. 1987), has a value of ~ 1000 kgm-3, which is somewhat high compared to other TNOs of similar sizes (Ortiz et al. 2012).
Observations
We present here a collection of new rotational light-curves from 2005 to 2019, taken from three different observatories in Spain (Sierra Nevada Observatory, Calar Alto Observatory and Roque de los Muchachos Observatory), using telescopes of 1.5-m, 1.23-m and 2.2-m, and 3.6-m diameter, respectively. Additionally, we have included three rotational light-curves from the literature (Jewitt & Sheppard 2002, Lellouch et al. 2002, Hicks et al. 2005) to our study. This data set provides different rotational light-curves in a time span of 19 years.
Results
We have detected that the amplitude of the rotational light-curve has evolved over time, producing a considerable change along these 19 years, increasing ~ 0.13 mag. We think that this change is due to a variation in Varuna's aspect angle. We model this variation assuming a simple triaxial shape for Varuna's body. The best fit to the data corresponds to a family of solutions with axial ratios b/a between 0.56 and 0.60, which constrains the pole orientation in two different ranges of solutions (see figure 1).
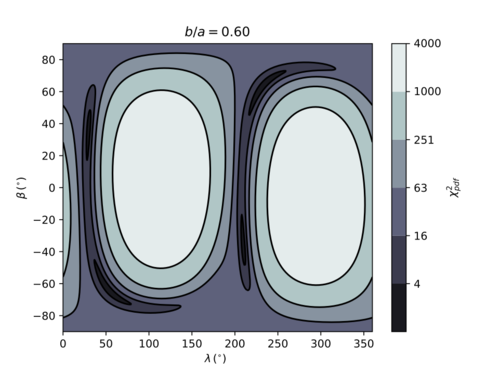
Figure 1. χ2 map of possible values for the axis ratio b/a = 0.60. λP and βP are the ecliptic longitude and latitude of the pole orientation (Schroll et al. 1976). The best solution is given by the range λP∈[43, 63]º and βP∈[-70, -58]º (with its complementary direction also possible for the same values of χ2PDF). Figure from Fernandez-Valenzuela et al. (2019).
Apart from the remarkable variation of the rotational light-curve amplitude along the 19-year time span, we have detected changes in the overall shape of the rotational light-curve in shorter time scales. After the analysis of the periodogram of the residuals to a 6.3435674 h double-peaked rotational light-curve fit, we found a clear additional periodicity (see figure 2). We propose that these changes in the rotational light-curve shape are due to a large and close-in satellite whose rotation induces the additional periodicity. The peak-to-valley amplitude of this oscillation is in the order of 0.06 mag (see figure 3). We estimate that the proposed satellite orbits Varuna with a period of 11.9897 h (or 23.9794 h), assuming that the satellite is tidally locked at a distance of 1300 km (or 2000 km) from Varuna. For more detailed information see Fernandez-Valenzuela et al. (2019).

Figure 2. Lomb periodogram spectral power derived from the residuals of the Fourier function fit to Varuna's photometric data. A maximum spectral power of 45 is obtained at the frequency of 2.003 cycles/day (11.9819 h). This periodicity corresponds to the satellite's revolution period. Figure from Fernandez-Valenzuela et al. (2019).
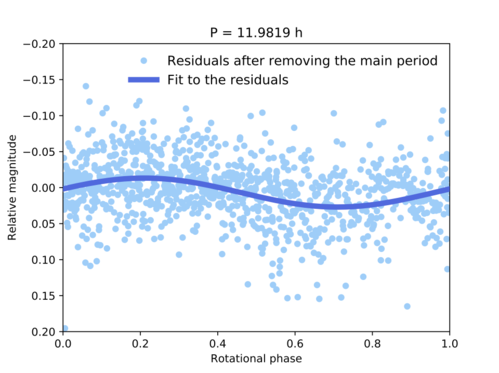
Figure 3. Residuals of Varuna's observational data folded to the 11.9819 h period detected using the Lomb periodogram technique. The blue line represents a one-order Fourier function fit to the points. Figure from Fernandez-Valenzuela et al. (2019).
Acknowlegements: EFV acknowledges UCF 2017 Preeminent Postdoctoral Program (P3). Part of the research leading to these results has received funding from the European Unions Horizon 2020 Research and Innovation Programme, under Grant Agreement No. 687378 (SBNAF). P.S-S. acknowledges financial support by the Spanish grant AYA-RTI2018-098657-J-I00 "LEO-SBNAF" (MCIU/AEI/FEDER, UE). We would like to acknowledge financial support by the Spanish grant AYA-2017-84637-R and the financial support from the State Agency for Research of the Spanish MCIU through the "Center of Excellence Severo Ochoa" award for the Instituto de Astrofísica de Andalucía (SEV- 2017-0709).
How to cite: Fernández-Valenzuela, E., Ortiz, J. L., Morales, N., Santos-Sanz, P., Duffard, R., and Lellouch, E.: Evidence for a close in satellite in the large TNO Varuna, Europlanet Science Congress 2020, online, 21 Sep–9 Oct 2020, EPSC2020-393, https://doi.org/10.5194/epsc2020-393, 2020.