
Sub-Seasonal Variations in Neptune's Stratospheric Infrared Emission from VLT-VISIR, 2006-2018
 1,1,2,2,3,4
- 1University of Leicester, School of Physics and Astronomy, United Kingdom of Great Britain and Northern Ireland (mr359@le.ac.uk)
- 2Jet Propulsion Laboratory/California Institute of Technology
- 3Space Science Institute
- 4University of Oxford
Above the dynamic clouds in Neptune’s atmosphere, the temperatures and photochemical composition within Neptune’s stratosphere are expected to respond to slowly modulating insolation over decades [1]. With Neptune’s seasons stretching over more than forty years, the entire history of reliable infrared observations resolving the planet’s disk comprises a mere fraction of a season. Yet, as we shall show, within this relatively brief window, observations appear to show changes in emission that would imply that sub-seasonal processes are significantly modifying the chemical and/or thermal structure in Neptune's stratosphere.
We present an analysis of the mid-infrared images and spectra of Neptune acquired using the VISIR instrument at the Very Large Telescope (VLT) between 2006 and 2018. Images in Q-band (17.65, 18.72, 19.50 µm) are used to infer upper-tropospheric temperatures (~200 mbar), while Neptune’s stratosphere (~1 mbar) is analyzed using a combination of imaging and spectra sensitive to emission from ethane (12.2 µm), methane (7.9 µm), and the S(1) hydrogen quadrupole (17.03 µm).
While we find that temperatures in the upper troposphere show no significant changes in time (remaining consistent with temperatures inferred from 1989 Voyager-IRIS measurements [2, 3]), the stratospheric emission appears to have changed unexpectedly over the past decade. Absolute radiances are uncertain, but relative trends in the spatially resolved emission are robust and show an asymmetric change in brightness temperature of up to ~3 K between and 2006 and 2008. The 2008 trend in emission continued throughout 2009 observations before returning to a relatively more symmetric pattern in 2018 (see Figure 1). Combined with the 2006 H2 S(1) quadrupole data, the observations indicate that the distribution of stratospheric emission observed in 2006 can likely be explained by the stratospheric temperature structure. However, no contemporaneous VLT-VISIR observations of the quadrupole emission were made in subsequent years, and so the nature of the observed changes between 2006 and 2008-2009 are ambiguous–they can potentially be explained by changes in the stratospheric temperatures, changes in the ethane abundances, or changes in both temperature and chemistry. The timing of these changes coincides with an extended maximum in Neptune’s photometric brightness following the 2005 southern summer solstice [4] and a decline in the discrete cloud coverage apparent in HST imaging [5]. Altogether, these observations suggest that Neptune’s stratosphere experiences intra-seasonal changes that may be coupled to dynamical forcing or variable mixing from the troposphere on timescales of years or less.
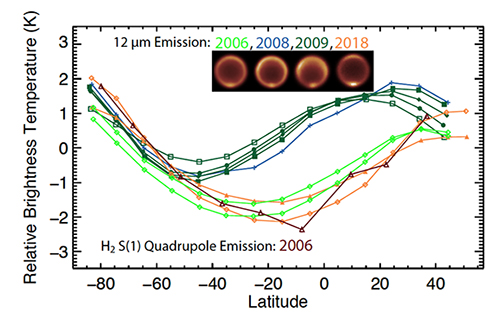
Figure 1. Relative variation in the longitudinally averaged brightness temperatures inferred from 12.2 µm emission (ethane at ~1 mbar) as a function of latitude for observations from 2006 (light green), 2008 (blue), 2009 (dark green) and 2018 (orange). Example images corresponding to these years are shown in the inset. Absolute calibrations are uncertain and show some spread, so relative trends have been normalized to roughly coincide (arbitrarily) at southern latitudes and the planet limbs, with zero here chosen by the mean. These trends show that the stratospheric emission in 2008 and 2009 differed in shape from those observed in 2006 and 2018, possibly indicating a change in stratospheric temperatures or ethane. The red curve shows the trend in stratospheric hydrogen quadrupole emission for 2006 and suggests that the observed trend in 12.2 µm emission in 2006 was likely primarily determined by the temperature structure.
[1] Moses, J. I., Fletcher, L. N., Greathouse, T. K., Orton, G. S., & Hue, V. 2018, Icar, 307, 124.
[2] Conrath, B.J., Flasar, F.M., Gierasch, P.J., 1991. Thermal structure and dynamics of Neptune’s atmosphere from Voyager measurements. J. Geophys. Res. 96, 18931–18939.
[3] Fletcher, Leigh N., et al. "Neptune at summer solstice: zonal mean temperatures from ground-based observations, 2003–2007." Icarus 231 (2014): 146-167.
[4] Lockwood, G. W. "Final compilation of photometry of Uranus and Neptune, 1972–2016." Icarus 324 (2019): 77-85.
[5] Karkoschka, Erich. "Neptune’s cloud and haze variations 1994–2008 from 500 HST–WFPC2 images." Icarus 215.2 (2011): 759-773.
How to cite: Roman, M. T., Fletcher, L. N., Orton, G. S., Vatant d'Ollone, J., Sinclair, J. A., Rowe-Gurney, N., Moses, J., and Irwin, P. G. J.: Sub-Seasonal Variations in Neptune's Stratospheric Infrared Emission from VLT-VISIR, 2006-2018, Europlanet Science Congress 2020, online, 21 September–9 Oct 2020, EPSC2020-471, https://doi.org/10.5194/epsc2020-471, 2020