Keck Time-resolved Spectrophotometry of Temporarily-Captured Minimoon 2020 CD3
- 1Division of Physics, Mathematics and Astronomy, Caltech, Pasadena, CA 91125, USA
- 2IPAC, Mail Code 100-22, Caltech, 1200 E. California Blvd., Pasadena, CA 91125, USA
- 3Centre for Astrophysics, University of Southern Queensland, Queensland, Australia
- 4Southwest Research Institute, Department of Space Studies, Boulder, CO. USA.
- 5Dept. of Metallurgical Engineering and Materials Science, Indian Institute of Technology Bombay, Powai, Mumbai-400076, India
- 6Université Côte d’Azur, Observatoire de la Côte d’Azur, CNRS, Laboratoire Lagrange, Boulevard de l’Observatoire, CS 34229, F-06304 Nice cedex 4, France
- 7Dept. of Astronomy, San Diego State University, 5500 Campanile Dr, San Diego, CA 92182, U.S.A.
- 8Kavli Institute for the Physics and Mathematics of the Universe (WPI), The University of Tokyo Institutes for Advanced Study, The University of Tokyo, Kashiwa, Chiba 277-8583, Japan
Keck Time-resolved Spectrophotometry of Temporarily-Captured Minimoon 2020 CD3
Bryce T. Bolin (1,2), Christoffer Fremling (1), Timothy R. Holt (3,4), Matthew J. Hankins (1), Shreya Anand (1), Kishalay De (1), Kunal Deshmukh (5), Mansi M. Kasliwal (1), Alessandro Morbidelli (6), Josiah Purdum(7), Robert Quimby (7,8)
(1) Division of Physics, Mathematics and Astronomy, Caltech, Pasadena, CA 91125, USA (bbolin@caltech.edu)
(2) IPAC, Mail Code 100-22, Caltech, 1200 E. California Blvd., Pasadena, CA 91125, USA
(3) Centre for Astrophysics, University of Southern Queensland, Queensland, Australia
(4) Southwest Research Institute, Department of Space Studies, Boulder, CO. USA.
(5) Dept. of Metallurgical Engineering and Materials Science, Indian Institute of Technology Bombay, Powai, Mumbai-400076, India
(6) Université Côte d’Azur, Observatoire de la Côte d’Azur, CNRS, Laboratoire Lagrange, Boulevard de l’Observatoire, CS 34229, F-06304 Nice cedex 4, France
(7) Dept. of Astronomy, San Diego State University, 5500 Campanile Dr, San Diego, CA 92182, U.S.A.
(8) Kavli Institute for the Physics and Mathematics of the Universe (WPI), The University of Tokyo Institutes for Advanced Study, The University of Tokyo, Kashiwa, Chiba 277-8583, Japan
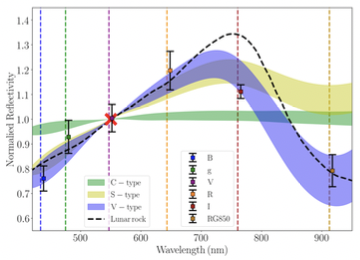
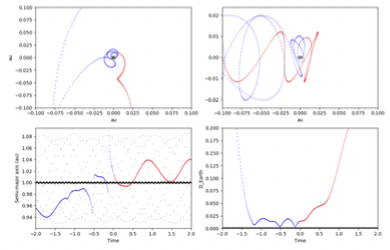
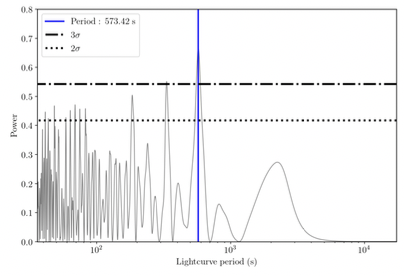
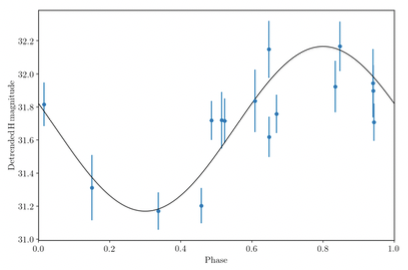
We report on rotationally-averaged visible spectrophotometry of minimoon 2020 CD3, the second known asteroid to be temporarily gravitationally captured by the Earth-Moon system, taken with Keck I/LRIS between 434 nm and 912 nm in B, g, V, R, I and RG850 bands as it was leaving the Earth-Moon system on 2020 March 23 UTC. We find that the broad-band spectrum of 2020 CD3 most closely resembles a V-type asteroid and some lunar rock samples with a reddish surface with a slope of 18 +/- 3 % between 434 nm and 761 nm corresponding to colors of g-r = 0.62 +/-0.08, r-i = 0.21 +/- 0.06 and an absorption band at ~900 nm corresponding to i-z = -0.54 +/- 0.10 (Isaacson et al. 2011, DeMeo & Carry 2013) as seen in the left panel of Fig. 1. Assuming typical albedos of V-type asteroids, we constrain 2020 CD3's size to be ~1.0 +/- 0.1 m in diameter when combined with our measured H magnitude of 31.74 +/- 0.14. In our time-series data, we detect periodic lightcurve variations corresponding to a rotation period of ~573 s and a Lomb-Scargle false alarm probability of <10-4 (Fig. 2, left panel) with a lightcurve amplitude of ~1 magnitude implying a b/a axial ratio of ~2.5 (Fig. 2, right panel), though this is atypical for meter-scale asteroids which are thought to have rotation periods ~60 s (Bolin et al. 2014). In addition, we refine the orbit of 2020 CD3 with our observations extending the observational arc to 37 days between 2020 February 15 and 2020 March 23 constraining its duration of capture of 2020 CD3 to be ~1.2 years a typical capture lifetime for minimoons (Granvik et al. 2012) as seen in the right panel of Fig. 1. We also constrain the effect of radiation pressure on its orbit with an estimated area-to-mass ratio of 6.9 +/- 2.1 10-4 m2/kg*. Using our diameter and area-to-mass ratio estimates, we calculate a density of 1.6-3.3 g/cm3, broadly compatible with the densities of other small asteroids with densities constrained by radiation pressure measurements (Micheli et al. 2012) and lunar rock (~2.4 g/cm3, Kiefer et al. 2012) somewhat less dense than the typical ~3.5g/cm3 density of V-type asteroids (Carry 2012). We searched for pre-discovery observations of 2020 CD3 in the ZTF archive (Masci et al. 2019) but were unable to locate any positive detections.
References: Bolin et al. 2014, Icarus, 241, 280-297, Carry 2012, PSS, 73, 98-118, DeMeo & Carry 2013, Icarus, 226, 723-741, Kiefer et al. 2012, GRL, 39, 7, Isaacson et al. 2011, M&PS, 46, 228-251, Granvik et al. 2012, Icarus, 218, 262-277, Masci et al. 2019. PASP, 131, 018003, Micheli et al. 2012, NA, 17, 446-452, Rein & Liu. 2012. A&A, 537, A128
*calculated using find_orb by Bill Gray: https://www.projectpluto.com/find_orb.htm


Figure 1. Left panel: reflectance photometric spectrum of 2020 CD3 consisting of B, g, V, R, I and RG850 observations of 2020 CD3 on 2020 March 23 UTC. The 1 σ uncertainties of the normalized reflectivity are indicated by the error bars on the datapoints. The spectrum has been normalized to unity at 550 nm indicated by the red cross. The spectral range of S, V and C-type asteroids from the Bus-DeMeo asteroid taxonomic catalogue (DeMeo et al. 2009) are over-plotted with the V-type spectrum most closely resembling the spectra of 2020 CD3. The average spectrum of coarse bulk lunar rock samples is plotted for reference (Isaacson et al. 2011). Right panel: Orbital evolution of 2020 CD3 based on the orbit determined by publicly available observations of 2020 CD3 available from the Minor Planet Canter dated from 2020 February 15 UTC to our observations taken on 2020 March 23 UTC, performed using REBOUND n-body integrator (Rein & Liu. 2012). Sub-right panel top left: x vs. y Earth-centred co-rotating frame showing the orbital path of 2020 CD3. The blue data points show the orbital path before 2020 March 23 and the red data points show the orbital path after March 23. Sub-right panel top right: x vs. z Earth-centred co-rotating frame showing the orbital path of 2020 CD3. Sub-right panel bottom left: time vs semi-major axis showing the orbital evolution of 2020 CD3. Sub-right panel bottom right: time vs. geocentric distance in au of 2020 CD3.


Figure 2. Left panel: Lomb-Scargle periodogram of lightcurve period vs spectral power using the B, g and R lightcurve data from our 2020 March 23 UTC Keck I/LRIS observations. A peak in the power is located at single-peaked rotation period of 573.4 s with a false alarm probability of <10-4. Right panel: phased lightcurve using data converting the B, g and R into H magnitudes corresponding to a single-peak lightcurve period of 574 s and a peak-to-trough amplitude of ~1 magnitude. The 1 σ uncertainties of the magnitudes are indicated by the error bars on the datapoints.
How to cite: Bolin, B., Fremling, C., Holt, T., Hankins, M., Anand, S., De, K., Deshmukh, K., Kasliwal, M., Morbidelli, A., Purdum, J., and Quimby, R.: Keck Time-resolved Spectrophotometry of Temporarily-Captured Minimoon 2020 CD3, Europlanet Science Congress 2020, online, 21 September–9 Oct 2020, EPSC2020-489, https://doi.org/10.5194/epsc2020-489, 2020

