
Comparison of LEND's hydrogen signal with modeled (sub-)surface temperatures in the lunar polar regions
 1,2,
1,2,- 1Technische Universität Berlin, Geodesy and Geoinformation Science, Planetary Geodesy, Berlin, Germany (philipp.glaeser@tu-berlin.de)
- 2Ronin Institute for Independent Scholarship, Montclair, NJ 07043, USA
- 3Institute for Space Research of Russian Academy of Sciences, Moscow 117997, Russian Federation
- 4Department of Earth, Planetary and Space Sciences, University of California Los Angeles, 595 Charles Young Drive East, Box 951567, Los Angeles, CA 90095-1567, USA
- 5German Aerospace Center, Institute of Planetary Research, Rutherfordstrasse 2, 12489 Berlin, Germany
Abstract
We modeled (sub-)surface temperatures for the upper two-meter regolith layer near the lunar poles. The temperature maps are compared to the observed hydrogen signal from the Lunar Enhanced Neutron Detector (LEND). We focused our study on six Neutron Suppression Regions (NSRs).
Introduction
The lunar poles offer a thermal environment with surface temperatures allowing for water ice to accumulate, especially in Permanently Shadowed Regions (PSRs) commonly found at crater floors [1]. Extensive remote sensing and modeling techniques were applied from a series of missions to detect and quantify potential deposits (e.g. [2][3]). Although plausible evidence was found from orbiting spacecrafts, alternative explanations are still possible, e.g. roughness, fresh surface material, hydroxyl (OH) bearing minerals etc. However, the Lunar Crater Observation and Sensing Satellite (LCROSS) found direct evidence of water through impacting within the PSR of Cabeus crater. LEND [4] observations revealed several NSRs [5], i.e. hydrogen-rich areas which are typically found within PSRs. However, some NSRs are occasionally in sunlight creating surface temperatures at which water ice cannot be stable. At specific thermal conditions, i.e. maximum and average temperatures are 120 K and 105 K respectively, an ice pumping mechanism into the sub-surface is activated [6].
We investigate to which extent temperatures correlate with LEND’s hydrogen signal and whether or not ice pumping can explain the existence of some of the NSRs.
Data and Method
Our study is based on polar 650x650 km Lunar Orbiter Laser Altimeter (LOLA) Digital Terrain Models (DTMs) [7][8].
Lunar (sub-)surface temperatures are modeled by solving the 1D heat equation [9]. We treat the Sun as an extended source considering the limb-darkening effect. Heat conduction is modeled within the upper two meters of regolith and temperatures are derived for 30 layers. Multiple scattering and re-radiation of VIS and IR is evaluated at each pixel from a 50x50 km window. Earth-shine (VIS and IR) and a constant radiogenic heat source of 0.016 W/m² are also incorporated in the model.
The DTMs were synthetically illuminated [10] in 12-h time steps for a 19-year period, 01-01-1991 to 01-01-2010. Since similar illumination conditions occur at the start and end time we could iterate the process until temperatures converged. After 5 iterations (i.e. 95 years) we found an equilibrated solution from which we derived results presented in this study.
Our investigated NSRs are: areas near Whipple, Fibiger and Peary at the north pole and areas inside Shoemaker, Haworth and Cabeus crater at the south pole. For each NSR we derived minimum, average and maximum temperature maps. Additionally, maps of suppression parameter ξ were prepared. The suppression parameter represents the ratio between the average neutron counting within LEND’s field-of-view to the average neutron counting of a hydrogen-poor reference area [5].
3. Results
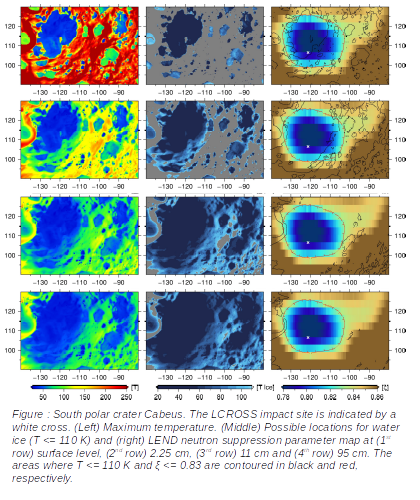
To determine whether or not temperature and suppression parameter maps correlate we needed to set thresholds. For instance, the threshold for temperature below which we assume water ice to be stable is 110 K [11]. The threshold for the suppression parameter ξ was set to 0.83. We found this threshold by evaluating the observed ξ around the LCROSS impact site for which we know that water ice is present.
At each depth layer we compared the overlap of the two emerging areas of potential water ice, one determined by temperature and the other determined by ξ (see Fig. 1). We also derived growth rates (%/cm) indicating whether significant increase in overlap (%) is achieved by comparing ξ to temperature layers in greater depth (cm). For the south polar NSRs we find that both areas overlap > 95% and ice appears to be present within the upper 19 cm of regolith. The north polar NSRs show an overlap of ~50-70% and ice seems to be buried to greater depths, e.g. 65 cm. In fact, we found that maximum and average temperatures create ideal conditions for ice pumping into the sub-surface.
4. Discussion
Our south polar NSRs reside in PSRs, i.e. the coldest areas on the Moon. They follow the classical view on how water ice deposits at the poles: water molecules hop over the lunar surface and eventually get trapped and accumulate in PSRs. Our selected north polar NSRs, however, reside in non-PSR areas which are occasionally in sunlight and are generally too warm for water ice to be stable. Ice pumping seems to be the explanation for those locations. We could show that NSRs and modeled temperatures do correlate, either at surface or sub-surface level.
Acknowledgements
P. Gläser was funded by a Grant of the German Research Foundation (GL 865/2-1). We gratefully acknowledge the support of NVIDIA Corporation with the donation of a Quadro P6000 GPU used for this research. Last, we wish to thank the LRO Science Teams for releasing such wonderful data products.
References
[1] Watson, K. et al. 1961, Journal of Geophysical Research 66, 1598–1600
[2] Nozette, S. et al. 1996, Science 274, 1495–1498
[3] Paige, D.A. et al. 2010, Science 330, 479
[4] Mitrofanov, I.G. et al. 2010, Science 330, 483
[5] Sanin, A.B. et al. 2017, Icarus 283, 20–30
[6] Schorghofer, N. et al. 2010, The Astrophysical Journal 788, 169
[7] Gläser, P. et al. 2018, Planetary and Space Science 162, 170–178
[8] Gläser, P. et al. 2013, Planetary and Space Science 89, 111–117
[9] Gläser, P. et al. 2019, Astronomy & Astrophysics 627, A129
[10] Gläser, P. et al. 2014, Icarus 243, 78–90
[11] Vasavada, A.R. et al. 1999, Icarus 141, 179–193
How to cite: Gläser, P., Sanin, A., Williams, J.-P., Mitrofanov, I., and Oberst, J.: Comparison of LEND's hydrogen signal with modeled (sub-)surface temperatures in the lunar polar regions, Europlanet Science Congress 2020, online, 21 September–9 Oct 2020, EPSC2020-530, https://doi.org/10.5194/epsc2020-530, 2020