
Emissivity Spectroscopy (7-14 μm) of Powdered Silicates under Simulated Mercury Daytime Surface Conditions: Supporting MERTIS Payload onboard ESA/JAXA Bepicolombo Mission
 1,2,1,1,
- 1German Aerospace Center (DLR), Institute of Planetary Research (PF), Berlin, Germany (indhu.varatharajan@dlr.de)
- 2Helmholtz Centre Potsdam - GFZ German Research Centre for Geosciences, Potsdam, Germany
- 3Wilhelms Universität Münster, Germany.
Introduction: ESA/JAXA’s BepiColombo mission was launched to Mercury on October 20, 2018. MERTIS (Mercury Radiometer and Thermal Imaging Spectrometer) onboard BepiColombo will be the first thermal infrared (TIR) hyperspectral imager (7–14μm) and radiometer (7–40μm) to orbit Mercury mapping global spectral emissivity and surface temperature of Mercury at a spatial resolution of ~500 m/pixel and ~2 km/pixel respectively [1]. This spectral region is especially sensitive to the abundance of Si-O, unlike the visible-near infrared (VNIR) spectral region which is sensitive to the presence of transition metals such as Fe and Ti in the crystal structure. Due to Fe2+-poor nature of the Mercury surface, MASCS spectrometer onboard MESSENGER which mapped Mercury in the VNIR spectral region (0.3-1.45μm) could not reveal the planet’s silicate mineralogy.
MERTIS will therefore provide spatially resolved surface mineralogy of Mercury including its hollows and pyroclastic deposits along with the rock abundance, grain size, thermal inertia, and surface temperature [2]. In this study, we built a specialized spectral library of 10 silicate analogues and emissivity spectral behavior as a function of temperature (100°C-500°C) under vacuum. Furthermore, the spectral parameters have been derived to understand their change in emissivity spectral behavior under Mercury daytime surface conditions to effectively characterize them in MERTIS data.
Sample selection and preparation: Over a decade, the Planetary Spectroscopy Laboratory (PSL) at DLR, Berlin has been undertaking huge efforts in collecting natural silicate endmembers from various sources in preparation to MERTIS data science [4]. These silicates are suggested by ground-based observations of Mercury and indirect mineralogy derived from NASA MESSENGER geochemistry suite [e.g.,3,5].
The studied silicates include; a) olivine: forsterite (Mg1.76Fe0.22SiO4), b) pyroxenes: enstatite ((Ca0.01Mg1.73Fe0.25)Si2O6), diopside ((Ca1Mg0.9Fe0.1)Si2O6), c) plagioclase feldspar: hypersthene ((Mg0.7Fe0.2 Ca0.1)2Si2O6), anorthite (An95.5Ab4.5), labradorite (An51.2Ab46.5Or2.3), andesine (An47.4Ab50Or2.6), oligoclase (An19.3Ab76Or4.7), d) K-feldspar: orthoclase (An0.5Ab31.9Or67.6), and d) feldspathoid: nepheline (Na3K0.7(Al3.8Si4O16)). The samples composition were characterized by electron microprobe analysis (EMPA).
Facility and Methods: A Bruker Vertex 80V instrument with MCT HgCdTe detector (cooled by liquid nitrogen) and KBr beamsplitter is used at PSL to measure the TIR emission spectra. This spectrometer is attached to an external chamber where the samples are placed in steel cups which are heated up to Mercury’s peak daytime temperatures via induction technique under vacuum. Each sample is heated from 100°C to 500°C (step 100°C) at medium vacuum (0.7hPa) and then cooled down in vacuum. Radiance from the heated samples is collected by a gold (Au) coated 90° off-axis parabolic mirror and reflected into the spectrometer which records the TIR spectra of the silicates at wavelength intervals of 7-14μm at spectral resolution of 4cm-1.
These spectra are then calibrated against blackbody spectrum at the same geometry and temperature as the samples. Fig. 1 shows the resulting emissivity measurements at temperatures of 100°C, 200°C, 300°C, 400°C, and 500°C.
Results: Christiansen feature (CF) and Reststrahlen bands (RBs) in the TIR spectra are widely used for remote identification and characterization of silicates. CF is emissivity maximum which is used as the indicative of silica polymerization where the CF position shifts to shorter wavelengths for highly polymerized silicates [6,7]. However, some silicates have overlapping CF positions which makes it difficult for their unique identification. RBs relate to fundamental vibration bonds due to stretching and bending of Si-O and various cations. Therefore, RB positions are used to identify the nature of the minerals such as olivines, pyroxenes, and feldspars [e.g.,8,9,10].
In order to remotely characterize these silicate groups, we introduce CF vs RB1 plot where CF position (emissivity maxima) is plotted against RB1 position (Fig. 2). RB1 position is the first RB minimum longward of CF position occurs for all temperatures as marked in Fig. 1.
CF vs RB1 plot shows that CF position of plagioclase feldspars (Group A) and forsterite (olivine) is least affected with increase in temperature; however, the RB1 position increases to longer wavelengths with increase in temperature. On the other hand, pyroxene group and nepheline show that with increase in temperature CF position shifts shortwards and RB1 position only slightly shifts longward. The significant result from the CF vs RB1 plot is that the olivine, pyroxenes (and nepheline) (Group B) and plagioclase (Group A) classes of silicates can be unambiguously identified when comparing both spectral parameters instead of one (CF position).
CF vs RB1 plot will therefore enable first-hand surface mineral identification of Mercury in MERTIS and ground-based telescope observations of Mercury in the TIR spectral region.
Conclusions: The new emissivity measurements in this study will directly support MERTIS data analysis. CF vs RB1 plot introduced in this study can be widely used for detection of surface mineralogy of planets studied in the TIR spectral region.
References: [1] Hiesinger, H. and J. Helbert (2010) PSS,58(1-2): pp.144-165. [2] Helbert J. et al. (2013) SPIE, 8867, 886705. [3] Vander Kaaden, K et al. (2017) Icarus, 285,155-168. [4] Helbert J. et al (2007) Adv.Space.Res., 40, 272-279. [5] Namur and Charlier (2017) Nat. Geosci., 10,9-13. [6] Conel J.E. (1969) JGR, 1896-1977,74,1614-1634. [7] Logan L.M. et al. (1973) JGR, 1896-1977,78, 4983-5003. [8] Donaldson Hanna K.L. et al. (2012) JGR Planets, 117. [9] Hamilton V. (2000) JGR Planets, 105, 9701-9716. [10] Lyon R.J.P (1965) Econ. Geol. 60, 715-736.
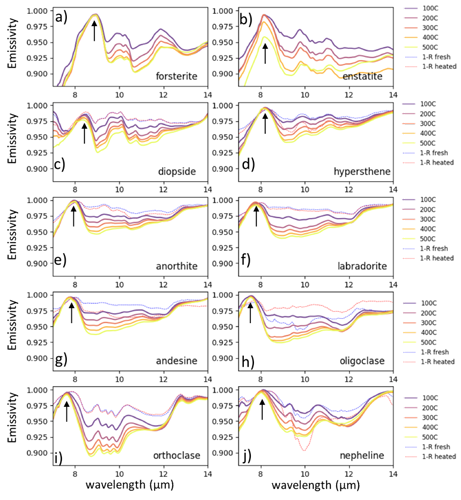
Figure 1. (a-j) Emissivity spectra (solid lines) of silicates as a function of temperature studied. Black arrow marks the position of CF position for all silicates. Dotted spectra indicate the 1-R fresh (blue-dotted) and heated (red-dotted) spectra is the inverted reflectance spectra of the fresh and thermally weathered silicates at room temperature under vacuum measured at phase angle of 26°.
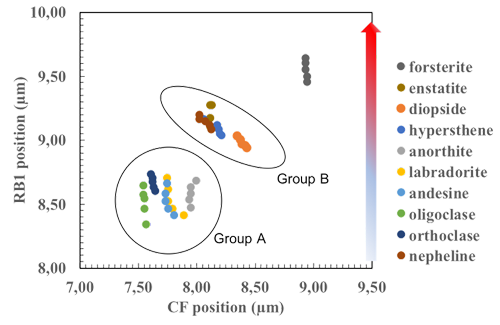
Figure 2. CF vs RB1 plot which shows that forsterite (olivine), pyroxenes including nepheline (silica undersaturated group belonging to feldspathoid), and plagioclase feldspars are grouped under separate classes. RB1 position shifts longwards for all silicates with increase in temperature. The increase in temperature and is denoted by blue-red color scale indicating the low (100°C) to high (500°C) temperature measurements respectively.
How to cite: Varatharajan, I., Stangarone, C., Wilke, F. D. H., Maturilli, A., Helbert, J., and Hiesinger, H.: Emissivity Spectroscopy (7-14 μm) of Powdered Silicates under Simulated Mercury Daytime Surface Conditions: Supporting MERTIS Payload onboard ESA/JAXA Bepicolombo Mission, Europlanet Science Congress 2020, online, 21 Sep–9 Oct 2020, EPSC2020-631, https://doi.org/10.5194/epsc2020-631, 2020.