MapX: An In-situ X-ray µ-Mapper for Habitability and Biosignature Studies
- 1NASA Ames Research Center, Moffett Field, CA USA (david.blake@nasa.gov; thomas.f.bristow@nasa.gov)
- 2SSRL, Stanford University, Stanford, CA USA (rwalroth@stanford.edu)
- 3SETI Institute, Mountain View, CA USA psarrazin@seti.org; katalinat@earthlink.net)
- 4Institut Matériaux Microélectronique Nanosciences de Provence, Aix-Marseille Université, Marseille, FR (marc.gailhanou@im2np.fr)
- 5Dept. of Geoscience, University of Arizona, Tucson, AZ (rdowns@arizona.edu)
Introduction: The search for evidence of life or its processes on Mars takes on two major themes: 1), the identification of environments that have or once had the potential to harbor life (habitability); and 2), the detection of morphological or chemical features suggestive of extinct or extant life (biosignatures). Compositional heterogeneity at the mm-to-100µm scale can reveal geological processes indicative of past or present habitability, and morphological and compositional heterogeneity on a similar length scale can provide evidence of life’s processes. The Mapping X-ray Fluorescence Spectrometer (MapX) is an arm-based in-situ instrument designed to identify these features on planetary surfaces [1].
Instrument Description: MapX is a full-field elemental imager capable of analyzing samples in situ without sample preparation. MapX has no moving parts, a 1-cm depth of field, and is designed to utilize 244Cm radioisotope sources, eliminating the need for a High Voltage Power Supply or X-ray tube. Figure 1 shows a schematic of the instrument, which consists of X-ray / ϒ-ray / α-particle sources, a focusing optic, and a CCD. The focusing lens is an X-ray micro-pore optic (MPO) which focuses X-ray photons 1:1 onto the CCD. The MPO has a large depth of field (~1cm) allowing rough unprepared surfaces to be imaged with minimal loss of resolution. The CCD is read out fast enough (several frames per second) so that each pixel records either a single photon from the sample or background. The number of electron hole pairs generated in a single pixel is directly proportional to the energy of the X-ray photon, and after summing a large number of individual frames, an XRF spectrum is generated for each pixel of the CCD. Each individual 0.3 sec. frame is a complete image; however many frames are necessary to produce quantifiable XRF spectra. Longer collection times will allow for improved signal to noise, but in the event a collection is interrupted the partial data will still yield a complete image. Downlinked data products include: Elemental maps 11<Z<40, instrument-selected [2] Regions of Interest (ROI) having common compositions, and quantifiable XRF spectra from ROI.
Figure 1. Schematic representation of MapX.
Example MapX datasets: rough surfaces, polished stubs, or petrographic thin-sections were imaged first on an EDAX commercial laboratory instrument (~50 µm resolution), then on MapX-III, a third generation prototype of MapX (~150 µm resolution). MapX-III data are collected in vacuum; on Mars, images will be collected at ambient pressure.
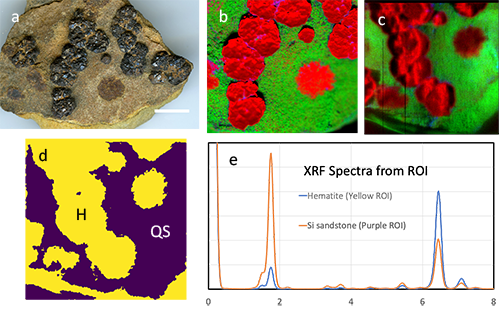
Figure 2 shows a partial MapX dataset collected from a quartz sandstone decorated with hematite crystals (similar to magnetite crystals observed on the surface of mudstones by the MSL Curiosity rover). The instrument nominally collects ~10,000 0.3 second images into an HDF5 data cube. An unsupervised machine learning algorithm resident on the instrument computer produces ROI comprised of common elemental compositions. Quantifiable XRF spectra are generated from each ROI, which are analyzed off-line using a fundamental parameters technique. ROI compositions are used in conjunction with the RRUFF database [3] to determine putative mineralogy.

Figure 2. Hematite crystals on quartz sandstone. a). image of sandstone fragment, scale bar = 1 cm; b). RGB elemental image from EDAX commercial instrument, Fe=Red, Si=Green, K=Blue; c). RGB elemental image from MapX-III prototype, same color scheme as b); d). instrument selected ROI, H = hematite, QS = quartz sandstone; e). XRF spectra from yellow ROI (hematite) and purple ROI (quartz sandstone).
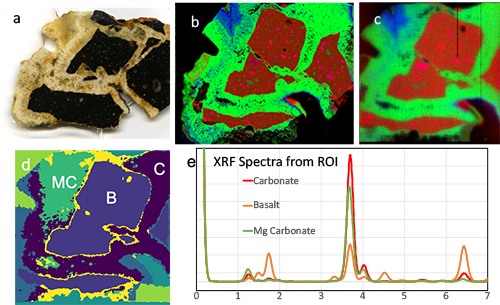
Figure 3 shows a partial MapX-III dataset collected from a brecciated basalt infilled with hydrothermal carbonate cements from Spitsbergen, Norway (analogous to Comanche Carbonate reported from MER).

Figure 3. Basalt breccia cemented by carbonate. a). image of basalt breccia, scale bar = 1 cm (note: the image shown is the obverse of the side used for elemental imaging); b). RGB elemental image from EDAX commercial instrument, Fe=Red, Ca=Green, Mg=Blue; c). RGB elemental image from MapX-III prototype, same color scheme as b); d). instrument selected ROI, B = basalt breccia, C = Carbonate, MC = magnesian carbonate; e). XRF spectra from ROI.
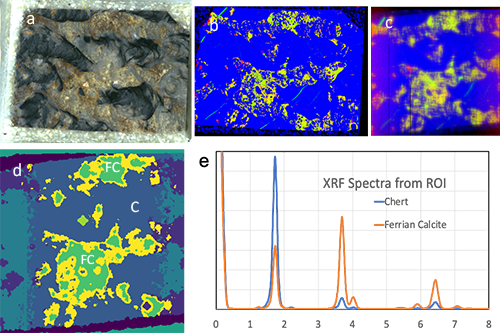
Figure 4 shows a partial MapX-III dataset collected from a polished stub of 1.9 Gyr old Gunflint Chert Stromatolite (Schrieber Beach locality). While the compositional features in the rock are <50µm, the elemental images, ROI and XRF spectra returned by MapX-III are sufficient to identify this rock as a chert with preserved carbonates displaying stromatolitic features, deserving of further in-situ analysis or return to Earth.

Figure 4. Precambrian Gunflint Stromatolitic Chert. a). image of Gunflint Chert, scale bar = 1 cm; b). RGB elemental image from EDAX commercial instrument, Fe=Red, Ca=Green, Si=Blue; c). RGB elemental image from MapX-III prototype, same color scheme as b); d). instrument selected ROI, C = Chert, FC = Ferroan Carbonate; e). XRF spectra from ROI.
MapX Flight Instrument. Figure 5 shows cut-away and solid 3D views of the MapX camera head, containing the sources, imaging optics, CCD and camera electronics (“Arm Unit”). A second processing unit (“RAMP Unit”) is located in the body of the rover and contains the computer processor, communications and instrument control software. Table 1 shows the proposed mass, volume and power requirements of the instrument as well as survival and operating temperatures.

Figure 5. 3D models of the MapX flight instrument. MapX. Right: Rendering of the arm mounted instrument in a flight like configuration.
Acknowledgements: This work was supported by the Ames Center Investment Fund (CIF), NASA’s PICASSO (13-PICASSO-0111) and MatISSE (16-MATISE16_2-0005) programs, and the NASA Postdoctoral Program.
References: [1]. Walroth, R.C. et al. (2019). 9th Intl. Conf. on Mars, abstr. #6329. [2]. Walroth, R.C. et al. (2019). AbSciCon abstr. #142-177. [3] Lafuente B, Downs R T, Yang H, Stone N (2015). The power of databases: the RRUFF project. In: Highlights in Mineralogical Crystallography, T Armbruster and R M Danisi, eds. Berlin, Germany, W. De Gruyter, pp 1-30 (link)
How to cite: Blake, D., Walroth, R., Sarrazin, P., Bristow, T., Gailhanou, M., Downs, R., and Thompson, K.: MapX: An In-situ X-ray µ-Mapper for Habitability and Biosignature Studies, Europlanet Science Congress 2020, online, 21 September–9 Oct 2020, EPSC2020-70, https://doi.org/10.5194/epsc2020-70, 2020

