
 2,1,2,2
- 1Université catholique de Louvain, Earth Life Institute, Secteurs des sciences et technologies, Belgium (anne-constance.imbreckx@uclouvain.be)
- 2Royal Observatory of Belgium, Brussels, Belgium
We study the evolution of the size of the polar ice caps on Mars using data collected by the CRISM spectrometer onboard MRO. The presence of H2O and CO2 on the surface is determined with the help of spectral indices. This study represents an extension of previous works to the latest data available, and aims at validating methods which have been applied to observations of similar kind by the NOMAD spectrometer onTGO. Moreover, mesoscale simulations using MarsWRF model will be performed to be compared with the observations.
1. Introduction
The Martian polar caps experience seasonal variability related to mass exchanges with the atmosphere. The evolution of the Martian polar caps has been studied using different satellite observations including gravity field [1], Epithermal Neutron [2] and optical in thermal infrared [3], visible [4], and near-infrared [5]. In particular, in this study we use publicly available datafromtheCompactReconnaissanceImagingSpectrometer for Mars (CRISM) which is a visible to nearinfrared spectrometer (operating in the range of wavelengths between 0.4 and 4.0µm) onboard the Mars Reconnaissance Orbiter (MRO) spacecraft.
2. Data and Methods
The principal data considered in this project are the CRISM pushbroom observations, in particular those obtained in the multispectral (MSP) and hyperspectral (HSP) mapping modes. The dataset analyzed by Brown et al. [6, 7] will be expanded to include the latest observations overlapping with the first science measurements from NOMAD. These measurements are available on the Planetary Data System in units of I/F, and are converted to reflectance factors (R) after dividing by the cosine of the incidence angle. The signature of surface ice in these spectra is detected by studying the strength of absorption bands typical of H2O and CO2 ice. The most prominent ones within the set of wavelengths sampled by CRISM are those centered at 1435 nm for CO2 ice and around 1500 nm for H2O ice. In addition, absorption bands in the region between 2.2 and 2.3 µm are considered, both because they fall in the range of wavelengths detectable by NOMAD and because may prove helpful in the determination of the ice grain sizes [6]. The absorption bands are modeled with simple linear models, so that their band depth (BD) is described by algebraic spectral indices, as provided by Viviano-Beck et al. [8]. The depth of the absorption band (and thus the value of the ice index) for each spatial pixel is not directly related to the abundance of the corresponding substance on the surface, for it depends also on factors like the contamination from dust and the size of the ice grains. These factors are accounted for by comparison with synthetic spectra provided by the Planetary Spectrum Generator (PSG). The data are grouped in bins of solar longitude (LS) and (areocentric) longitude, and for each image the pixels in the cross-track direction are averaged together to increase the signal-to-noise ratio (SNR). The ice indices are evaluated for each of the resulting spectra. A threshold is selected for the values of both indices, below which the corresponding species is assumed to be absent from the surface. Thus, for each LS and longitude bin, the latitude of the pixel furthest away from the pole presenting a value of the ice index higher than the threshold is taken as a point of the polar cap edge. The points are linearly interpolated, to obtain the H2O and the CO2 polar cap edges, also referred to as CROHUS and CROCUS lines, respectively. The results are compared with the other observations as well as Global Circulation Models (MarsWRF) [9].
3. Discussion and Outlook
Figure 1: Evolution of the CO2 ice in the South polar cap from MY30 to MY33. The plot in the lower part displays the corresponding areas. Those obtained by Brown et al. (MY 29) [6] are also shown for comparison.
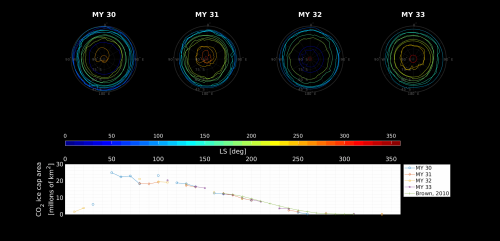
Figure1 shows results describing the variability of the South polar CO2 ice cap during four Mars years(MY), from MY30 to MY33. In this phase, the values of the thresholds for the H2O and CO2 are set to those employed by Brown et al. [7], which limit the contributions from noisy spectra and clouds absorptions. The plot in the lower part displays the corresponding areas. Those obtained by Brown et al. (MY 29) [6] are also shown for comparison, which exhibits a good agreement with ours. Finally, the interannual differences in cap evolution seem to be of the same order or below the uncertainty of the estimates and therefore, could not be separated from uncertainties of the detection method.
References
[1] O.Karatekin,T.V.Hoolst,andV.Dehant. Martian global-scale CO2 exchange from time-variable gravity measurements. Journal of Geophysical Research: Planets, 111(E6), 2006.
[2] D. Golovin, I. Mitrofanov, A. Anikin, et al. Variations of polar CO2 caps during the first Martian year of FREND onboard TGO. EGU General Assembly 2020, Online, 4–8 May 2020, EGU20209303, 2020.
[3] S.Piqueux,A.Kleinböhl,P.O.Hayne,etal. Variability of the martian seasonal CO2 cap extent over eight Mars Years. Icarus,251:164–180,May 2015.
[4] W.M.Calvin,P.B.James,B.A.Cantor,andE.M. Dixon. Interannual and seasonal changes in the north polar ice deposits of Mars: Observations from MY 29–31 using MARCI. Icarus, 251:181– 190, May 2015.
[5] T. Appéré, B. Schmitt, Y. Langevin, et al. Winter and spring evolution of northern seasonal deposits on Mars from OMEGA on Mars Express. Journal of Geophysical Research: Planets, 116(E5), May 2011.
[6] A. J. Brown, W. M. Calvin, P. C. McGuire, and S. L. Murchie. Compact Reconnaissance Imaging Spectrometer for Mars (CRISM) south polar mapping: First Mars year of observations. Journal of Geophysical Research: Planets, 115(E2), 2010.
[7] A. J. Brown, W. M. Calvin, and S. L. Murchie. Compact Reconnaissance Imaging Spectrometer for Mars (CRISM) north polar springtime recession mapping: First 3 Mars years of observations. Journal of Geophysical Research: Planets, 117(E12), December 2012.
[8] C. E. Viviano-Beck, F. P. Seelos, S. L. Murchie, et al. Revised CRISM spectral parameters and summary products based on the currently detected mineral diversity on Mars. Journal of Geophysical Research: Planets, 119(6):1403–1431, 2014.
[9] O. Temel, Ö. Karatekin, E. Gloesener, M. A. Mischna, and J. van Beeck. Atmospheric transport of subsurface, sporadic, time-varying methane releases on mars. Icarus, 325:39–54, 2019.
How to cite: Imbreckx, A.-C., Caldiero, A., Ruiz Lozano, L., Temel, O., and Karatekin, Ö.: Evolution of Mars polar caps extent from CRISM data, Europlanet Science Congress 2020, online, 21 Sep–9 Oct 2020, EPSC2020-747, https://doi.org/10.5194/epsc2020-747, 2020.