
Unsupervised Machine Learning Algorithms to Detect CO2 Clouds on Mars
 1,
1,- 1LATMOS, Sorbonne Université, UVSQ Paris-Saclay, CNRS, Paris, France
- 2LMD/IPSL, Sorbonne Université, Paris, France - Institut Universitaire de France, France
- 3NASA Goddard Space Flight Center, Greenbelt, Maryland, USA
Modeling clouds is a challenge we are currently facing in the development of Mars climate models. In particular, CO2 clouds are exotic components of the Mars’ atmosphere that may imply rethinking some microphysical theories. Moreover, available datasets that could allow a better understand of involved processes are rare and, thus, must be analysed the best we can to acquire more information. The Mars Orbiter Laser Altimeter (MOLA, Smith and al., 1999) was an instrument aboard the Mars Global Surveyor spacecraft for a mission around Mars between 1997 and 2006 (MOLA provided data until 2001). MOLA’s first goal was to study Mars’s topography using laser altimetry in order to draw a precise map. However, range measurements have been made with a better precision than expected, allowing detection of features that were not assignable to the planet surface. Those features include clouds, especially polar winter CO2 ice clouds that MOLA has been the first to detect. Previous studies conducted in the early 2000s (Neumann and al. (2003), Ivanov & Muhlemann (2001)) demonstrated that among all the laser returns, some were clearly clouds signatures coming from the atmosphere. However, the huge amount of data limited the manual analysis and forced the use of very strict distinction criteria, eventually leading to some misses.
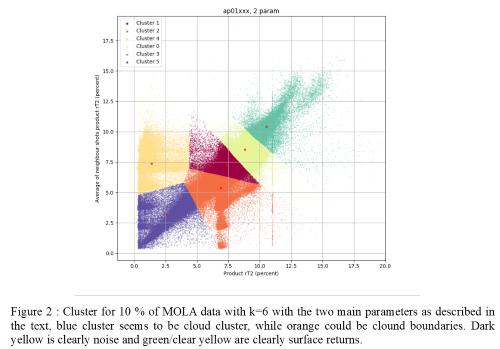
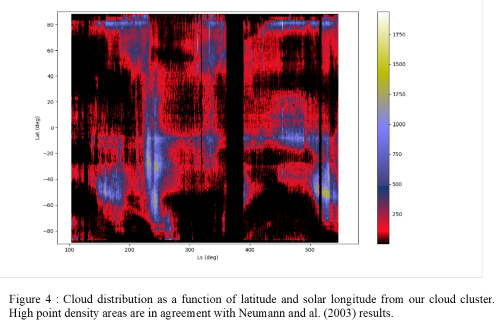
Our goal is to distinguish different categories of laser returns in MOLA data. A good modern option to computionally analyse MOLA data could be clustering methods, and K-means clustering methods in particular (Ackerman & Ben-David (2009)). For numerical reasons, we proceed to a first pruning to reduce the amount of data, assuming cloud returns could not be too close to the surface, by a typical range of less than ten meters from the MOLA vertical resolution (Abshire and al. (2010)) . We first apply the method on a single data file (that represents about 10 % of total data) then enlarge to the whole data set. We have led preliminary studies through empirical tests in order to define the best observational parameters for clustering among all those available in the raw data, best parameters being those allowing us to separate surface, noise and clouds returns. K-means methods are efficient ways of clustering but they require providing a predetermined number of clusters. That’s why we used three totally independent optimisation methods. Elbow method computes the total intra-cluster variation through total within-cluster sum of squares. Average silhouette method analyses clusters through « silhouette » score from distance of each point to its cluster and to closest one. Finally, gap statistic method (Tibshirani and al. (2001)) determines how far our clustering structure is from a random uniform distribution of points. All of these methods give us an « optimised » number of clusters to work with. The idea in this study is to find one cluster that would be a « cloud » cluster, containing all the non-surface non-noise laser returns. We plot geographical and temporal distribution of the different clusters separately in a first step, then more specifically for the wanted cloud cluster to verify the reliabily by comparison with previous studies. We can then work within the cloud cluster itself with clustering methods, to eventually find different types of cloud (and possibly dust).
Following the reference paper for cloud detection in MOLA data (Neumann and al., 2003), the product of surface reflectivity and two-way transmissivity of the atmosphere, rT², appears as the best parameter for distinguishing cloud and surface returns, through the product of each laser return itself but also the average product of previous and next returns. Working on our test case (10 % of the data), our three independent optimisation methods converge to the same number of clusters. Among the clusters, cloud cluster is the one with both low rT² product and low average neighbors rT² (making a well-like shape in the time/rT² figure). Plotting the clusters shows that one of them identifies clouds returns. Another cluster could represent clouds boundaries or thinner clouds, while the other ones identify noise (low rT² product but high average neighbors product) and surface returns (high rT² product and high average neighbors product). We then move on to the whole data by applying our clustering method to each data file (around 10 % of data each time), plotting clusters for every file to eventually adjust the necessary number of clusters. Geographic and temporal plots of our cloud returns are in agreement with previous studies, presenting similar distributions. However, it seems like our method allows to find more clouds due to less stringent detection criteria. So far, we have not been able to find parameters to clearly separate the different type of clouds but a lot of possibilities are still to be tested.
Because absorptive clouds can not really be attributed to a precise altitude, some of them may have been eliminated through our first pruning. It would be interesting to be able to cluster directly the whole data set but this requires some optimisation of our program. Moreover, evolution of the equipement capacities during the mission leads to different rT² continuum depending on the orbit : working with a normalised rT² product instead of raw rT² product itself should also be tested. Finally, if K-means methods are not adapted to work within the cloud cluster to distinguish reflective and absorptive clouds for example, it will be necessary to find another clustering method for the second step of our study. However, our results are promising and will hopefully help in complementing the first MOLA cloud climatology (Neumann and al. (2003)). Such observations are very important for comparing with microphysical model results ans helping us understand cloud formation process on Mars.
Acknowlegdements :
We thank the Agence National de la Recherche for funding (projet MECCOM, ANR-18-CE31-0013).


How to cite: Caillé, V., Määttänen, A., Spiga, A., Falleti, L., and Neumann, G. A.: Unsupervised Machine Learning Algorithms to Detect CO2 Clouds on Mars, Europlanet Science Congress 2020, online, 21 September–9 Oct 2020, EPSC2020-758, https://doi.org/10.5194/epsc2020-758, 2020