
On the asymmetry of Nathair Facula
 1,2,3,4,1,1,4
- 1The Open University, Dept of Physical Sciences, Milton Keynes, United Kingdom of Great Britain and Northern Ireland (d.a.rothery@open.ac.uk)
- 2LESIA, Observatoire de Paris, France
- 3European Space Astronomy Centre (ESAC) Camino Bajo del Castillo s/n, Ur. Villafranca del Castillo 28692 Villanueva de la Canada, Madrid, Spain
- 4INAF - IAPS, Roma, Italy
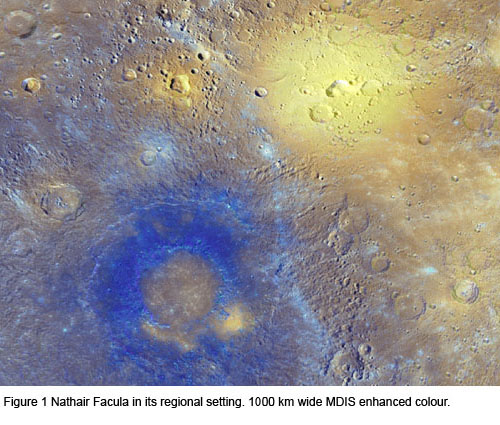
Nathair Facula (Figure 1) is the largest and most spectrally distinct of nearly 200 ‘bright red’ spots on Mercury’s surface. Most are accepted to be deposits from explosive volcanic eruptions. Nathair Facula hosts a central pit, but the mid-point of this facula is displaced about 20 km northwards from the middle of the pit. This poses unresolved questions about the eruption mechanism. The vent area is almost certainly a ‘compound vent’ where the eruption site migrated between eruptive episodes. It is unclear how a consistent asymmetry could be repeatedly engendered and reinforced by a series of eruptions rather than averaging out to a symmetrical distribution.
Nathair Facula’s radius was conservatively estimated at 71 km using MESSENGER fly-by images. However, orbital imagery reveals the radius to be double this. The vent was blasted through intercrater plains, but younger age constraints can be inferred because the facula overlies both smooth plains and ejecta from the c4 crater Rachmaninoff (Wright et al 2019), making it Mansurian or younger in age (younger than 1.7 Ga and possibly younger than 0.85 Ga).
When a facula results from explosive volcanism, the dispersal range can be used to estimate gas content at the seat of the eruption. Having been given their ejection velocity by gas expansion, the explosive ejecta particles would travel on ballistic trajectories in near-vacuum conditions. The large size of Mercury’s faculae supports the consensus that Mercury (or at least its crust) is rich in volatiles. These arguments remain broadly valid even for faculae that may be the cumulative product of a series of eruptions, which is particularly likely in the case of faculae whose central vent is a compound structure comprising multiple overlapping vents. Pegg et al. (2020) have shown that about 70% of vent sites on Mercury fall into this category.
Nathair Facula’s vent structure is a pit measuring 39 km on its long axis and 30 km on its short axis. As shown by Thomas et al. (2014) the brink of this pit is scarcely raised above the level of the surrounding terrain, but inside it plummets steeply (at about 30°) to an uneven floor more than 2 km below, with a greatest depth of about 3 km. In map view the brink is non-elliptical, having some sectors whose curvature is convex inwards, alternating with more strongly curved convex-outward sectors. Unlike many compound vents, this example lacks clear septa forming internal divisions between individual vents, although the floor has changes in texture and level that may reflect migration of the locus of explosive activity over time (Pegg et al., 2020).
The size and shape and asymmetry of Nathair Facula
A facula is a thin surficial deposit. It is visible because its spectral properties contrast with the underlying unit, possibly because of loss of carbon or sulfur from the ejected material. The original visible outer edge of the facula would have been radially gradational, where the cover by volcanic ejecta particles fell from 100% to zero. The spectral distinctiveness of a facula, particularly its thinner distal region, is likely to further blur over time because of impact gardening and general space weathering.
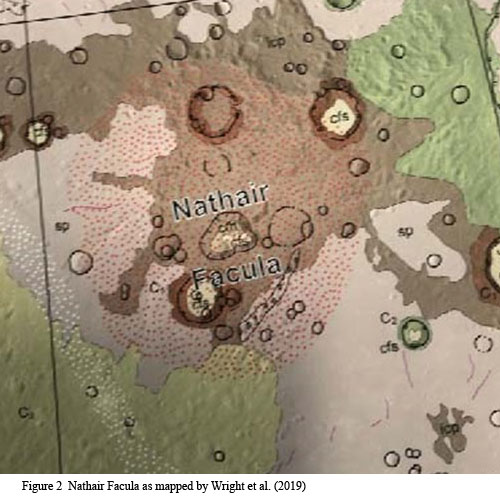
Thomas et al. (2014) and Wright et al. (2019) identified the radius of Nathair Facula visually, on enhanced MESSENGER MDIS images, as 130 km and 120 km respectively. Rather than fitting a notional circle to it, they attempted to show its true shape by drawing a slightly irregular boundary defining a roughly equidimensional deposit. The exact position of this boundary is subjective and depends on the whether it is drawn on the basis of a monochrome or colour image, and the contrast stretching used for display.
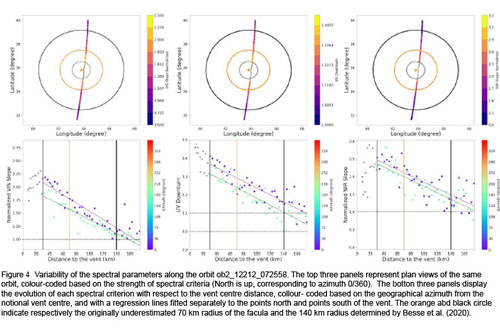
Besse et al. (2020) took a more objective approach to defining the edge of this facula (and several others) using spectroscopic data from MESSENGER’s MASCS (Mercury Atmospheric and Surface Composition Spectrometer) instrument, a non-imaging instrument that recorded UV-visible-near IR spectral along the spacecraft ground-tracks. They defined spectral parameters that are extreme in the inner part of faculae and decline to the planetary background value at the edge of the facula: the UV downturn, the VIS slope and the NIR slope. Along a nearly north-south line across Nathair Facula they used these data from one track to determine a radius of 140 km.
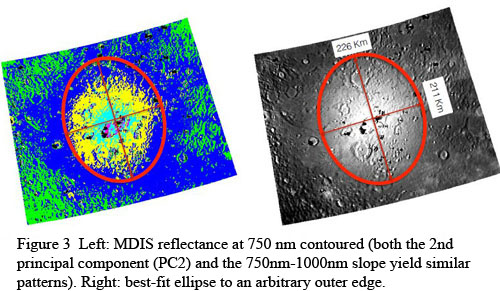
Careful inspection of enhanced MESSENGER colour images, such as Figure 1, and the map of Wright et al. (2019; Figure 2) shows that the facula is not actually centred on the vent, but is displaced northwards by about 20 km. Spectral analysis of MDIS data suggests the midpoint of the facula is in the NE of the vent, and reveals a slightly elliptical shape to the faculae edge (Figure 3). We interrogated data from five north-south MASCS crossings of Nathair Facula, distinguishing between data points north and south of the vent. One of these is illustrated in Figure 4, showing that each spectral parameter falls to the background level at a greater distance north than south of the notional vent centre. Table 1 gathers data from a total of five tracks. While each spectral parameter records a slightly different radius, in all cases where a radius can be determined it is greater in the north than in the south. In the case of the UV downturn, the mean and median agree on an approximately 21 km discrepancy between the north and south radii. This would be eliminated if the notional centre were shifted north by 10 km, but that would lie about 4 km north of the midpoint of even the northern part of the vent structure.
Future work will consider other spectral parameters.
Acknowledgements: Mapping and MDIS spectral studies have received funding from the EU Horizon 2020 research and innovation programme under grant agreement No. 776276, Planmap.
References
Besse, S. et al. 2020, J. Geophys. Res. Planets, 125(5)
Pegg, D. et al., 2020, British Planetary Science Conference
Thomas, R. et al., 2014, J. Geophys. Res. Planets 119, 2239
Wright, J. et al. 2019, J. Maps, 15, 509

How to cite: Rothery, D., Barraud, O., Besse, S., Carli, C., Pegg, D., Wright, J., and Zambon, F.: On the asymmetry of Nathair Facula, Europlanet Science Congress 2020, online, 21 Sep–9 Oct 2020, EPSC2020-782, https://doi.org/10.5194/epsc2020-782, 2020.