
Simulating Variability due to Faculae and Spots on GKM Stars
- 1Imperial College London, Department of Physics, United Kingdom of Great Britain and Northern Ireland (l.johnson17@imperial.ac.uk)
- 2Max Planck Institute for Solar System Research, Justus-von-Liebig-Weg 3, 37077 Göttingen, Germany
Stellar variability is a dominant noise source in exoplanet surveys and results largely from the presence of photospheric faculae and spots. The implementation of faculae in lightcurve models is an open problem, with scaling based on spectra equivalent to hot stellar atmospheres or assuming a solar-derived facular contrast. We model the lightcurves of active late-type stars as they rotate, using emergent intensity spectra calculated from 3D magnetoconvection simulations of G, K and M-type stellar atmosphere regions at different viewing angles to reproduce centre-to-limb brightness variations. We present mean expected variability levels for several cases and compare with solar and stellar observations. We also investigate the wavelength dependence of variability.
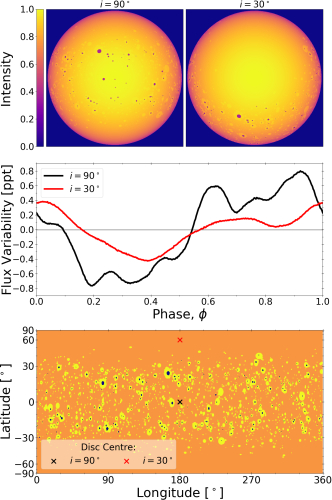
Fig. 1: Example of our geometrically accurate lightcurve modelling approach. Top: normalised intensity maps of a limb darkened, solar-type star viewed in the \textit{Kepler} band at rotational phase 0.5 with stellar inclinations 90 deg (left) and 30 deg (right). At 90 deg, the star is viewed equator-on. Middle: Corresponding lightcurves calculated at inclinations 90 deg (black line) and 30 deg (red line). Bottom: HealPix map representing the active stellar surface, cosine-scaled in latitude and flattened in longitude to resemble a solar synoptic map. The quiet photosphere is displayed in orange, facular regions are bright yellow and spot regions are dark blue. The crosses represent the centres of the stellar discs in the top panel.
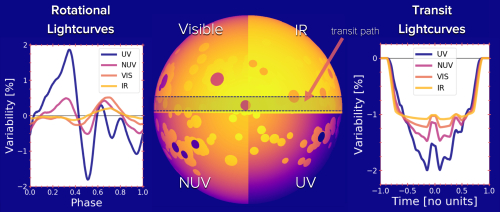
Fig. 2: Example showing simulated lightcurves calculated at different wavelengths. Rotational lightcurves are on the left, transit lightcurves on the right. In the centre, one hemisphere of the simulated stellar surface is shown, with a quarter of the disc shown in each wavelength band. 'Giant' spots and facular regions are used in this example. The transit path is highlighted in grey.
How to cite: Johnson, L., Unruh, Y., Norris, C., Solanki, S., Krivova, N., Witzke, V., and Shapiro, A.: Simulating Variability due to Faculae and Spots on GKM Stars, Europlanet Science Congress 2020, online, 21 September–9 Oct 2020, EPSC2020-844, https://doi.org/10.5194/epsc2020-844, 2020