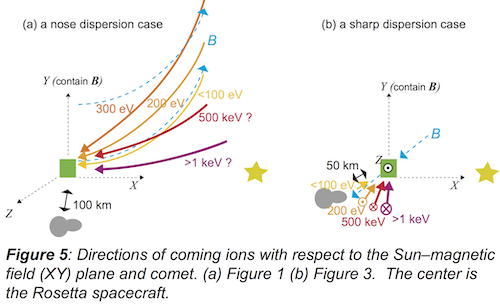
Europlanet Science Congress 2020
Virtual meeting
21 September – 9 October 2020
Europlanet Science Congress 2020
Virtual meeting
21 September – 9 October 2020

Oral presentations and abstracts

TP7

Ionospheres are a fundamental part of planetary and cometary atmospheres that are formed by solar radiation and are affected by a myriad of different processes, such as space weather activity or neutral atmosphere variations. Moreover, ionospheres play an important role in controlling the dynamics of the system, as they are the link between the neutral atmosphere, exosphere and surrounding plasma environments (e.g. the solar wind for Mars, Venus, Pluto and comets, and the Kronian magnetosphere for Titan). Understanding how each unmagnetized body reacts to all these factors is a key in comparative aeronomy because although a priori all of them have a general similar behavior, they also have scientifically important differences caused by their different natures.

This session focuses on the ionospheres of Mars, Venus, Pluto, Titan, and comets, and solicits abstracts concerning remote and in situ data analysis, modeling studies, instrumentation and mission concepts. Topics may include, but are not limited to, day and night side ionospheric variability, sources and influences of ionization, ion-neutral coupling, current systems, comparative ionospheric studies, and solar wind-ionosphere interactions and responses of the ionized and neutral regimes to transient space weather events. Abstracts on general plasma and escape processes are also welcome.

Co-organized by OPS
Convener: Beatriz Sanchez-Cano | Co-conveners: Matteo Crismani, Niklas Edberg, Xiaohua Fang, Francisco González-Galindo

Session assets

Session summary

Chairperson: Beatriz Sanchez-Cano, Niklas Edberg
EPSC2020-408ECP
Shaosui Xu, Shannon Curry, David Mitchell, Janet Luhmann, Robert Lillis, and Chuanfei Dong

Superthermal electron precipitation is one of the main sources supporting the Mars nightside ionosphere. It is expected that solar wind electron fluxes are to increase significantly during interplanetary coronal mass ejections (ICME) and therefore an enhanced nightside ionospheric density. This study is to quantify the variation of the precipitating and deposited electron fluxes during five of the most extreme ICMEs encountered by Mars Global Surveyor (MGS). We find energy fluxes correlate better with the upstream dynamic pressure proxy than number fluxes and electron fluxes increase more at high energies, which means electrons tend to have a lower peak production altitude during storm times. The precipitating and net/deposited fluxes are increased up to an order of magnitude from low to high dynamic pressures. The estimated total electron content (TEC) is a few times of 1014 m-2 for quiet times and on the order of 1015 m-2 for storm times, with an enhancement up to an order of magnitude locally near strong crustal fields. Crustal magnetic fields have an effect on the deposited fluxes with more prominent magnetic reflection over strong magnetic fields during quiet periods, which is significantly reduced during storm times. Lastly, we estimate a global energy input from downward fluxes of 1.3×10⁸ W and 5.5×10⁸ W and the globally deposited energy from net fluxes of 2.3×10⁷ W and 1.6×10⁸ W for quiet and storm time periods, a factor of 4 and 7 enhancement globally, respectively, but up to an order of magnitude locally near strong crustal fields.

How to cite: Xu, S., Curry, S., Mitchell, D., Luhmann, J., Lillis, R., and Dong, C.: Superthermal electron deposition on the Mars nightside during ICMEs, Europlanet Science Congress 2020, online, 21 Sep–9 Oct 2020, EPSC2020-408, https://doi.org/10.5194/epsc2020-408, 2020.

EPSC2020-687
Mark Lester, Beatriz Sanchez-Cano, Daniel Potts, Rob Lillis, Roberto i Orosei, Bruce Campbell, Olivier Witasse, Hermann Opgenoorth, Steve Milan, Marco Cartacci, Fabrizio Bernardini, Matthew Perry, Nathaniel Putzig, Pierre-Louis Blelly, and Francois Leblanc

We present an analysis of radar blackouts observed by MARSIS on Mars Express and SHARAD on Mars Reconnaissance Orbiter for the interval 2006 – 2017.  The period of interest encompasses the extended solar minimum between solar cycles 23 and 24 as well as the solar maximum of cycle 24.  Blackouts have been identified by eye through scanning daily plots of the surface reflection for both radars.  A blackout occurs when, for no apparent instrumental reason, the surface reflection normally expected is either not observed (total) or when the surface reflection is seen for only part of the orbit or the surface reflection is both weaker and spread over a significant time delay (partial).  Such blackouts are caused by enhanced ionisation at altitudes below the main ionospheric electron density peak resulting in increased absorption of the radar signal.  There are more occurrences observed by MARSIS than SHARAD, which is expected due to the lower absorption at the higher operating frequency of SHARAD.  We also observe more blackouts during solar maximum than solar minimum.  Indeed, there are no total blackouts during the extended solar minimum, although both radars do have partial blackouts.  There is no apparent relationship between blackout occurrence and crustal magnetic fields.  Following previous work, which has indicated that solar energetic particles, specifically electrons are responsible for the enhanced ionisation in the atmosphere, we also present the analysis of the MAVEN SEP electrons between 20 keV and 2 MeV during events when all three spacecraft were operational.  We find that the SEP electron flux-energy relationship is much enhanced during the total blackouts, in particular where both radars are impacted, while for partial blackouts the flux-energy spectrum is closer to those from orbits where no blackout occurs.  We also find that for certain events, the average spectrum which result in a blackout is particularly enhanced at the higher energy end of the spectrum, above 50 keV. The average spectra from each condition is presented.  We conclude that there is a higher probability of a radar blackout during solar maximum, that crustal magnetic fields play no apparent role in the their observational occurrence, that the higher energy (< 50 keV) electrons are responsible, and that for events where both radars observe a radar blackout the SEP electron fluxes are at their highest.

How to cite: Lester, M., Sanchez-Cano, B., Potts, D., Lillis, R., Orosei, R. I., Campbell, B., Witasse, O., Opgenoorth, H., Milan, S., Cartacci, M., Bernardini, F., Perry, M., Putzig, N., Blelly, P.-L., and Leblanc, F.: A Statistical Analysis of Radar Blackouts at Mars: MARSIS, SHARAD and MAVEN Observations, Europlanet Science Congress 2020, online, 21 Sep–9 Oct 2020, EPSC2020-687, https://doi.org/10.5194/epsc2020-687, 2020.

EPSC2020-819
Philippe Garnier, Christian Jacquey, Christian Mazelle, Xiaohua Fang, Jacob Gruesbeck, Benjamin Hall, Kei Masunaga, Jasper Halekas, Jared Espley, Bruce Jakosky, Vincent Genot, and Emmanuel Penou

The Martian interaction with the solar wind is unique due to the influence of remanent crustal magnetic fields. The recent studies by the Mars Express and Mars Atmosphere and Volatile Evolution missions underline the strong and complex influence of the crustal magnetic fields on the Martian environment and its interaction with the solar wind. Among them is the influence on the dynamic plasma boundaries that shape this interaction and on the bow shock in particular.

Compared to other drivers of the shock location (e.g. solar dynamic pressure, extreme ultraviolet fluxes), the influence of crustal magnetic fields are less understood, with essentially differences observed between the southern and northern hemispheres attributed to the crustal fields. In this presentation we analyze in detail the influence of the crustal fields on the Martian shock location by combining for the first time datasets from two different spacecraft (MAVEN/MEX). An application of machine learning techniques will also be used to increase the list of MAVEN shocks published to date. We show in particular the importance for analyzing biases due to multiple parameters of influence through a partial correlation approach. We also compare the impact of crustal fields with the other parameters of influence, and show that the main drivers of the shock location are by order of importance extreme ultraviolet fluxes and magnetosonic Mach number, crustal fields and then solar wind dynamic pressure.

How to cite: Garnier, P., Jacquey, C., Mazelle, C., Fang, X., Gruesbeck, J., Hall, B., Masunaga, K., Halekas, J., Espley, J., Jakosky, B., Genot, V., and Penou, E.: The influence of crustal magnetic fields on the Martian bow shock : a statistical analysis of Mars Volatile EvolutioN and Mars Express observations, Europlanet Science Congress 2020, online, 21 Sep–9 Oct 2020, EPSC2020-819, https://doi.org/10.5194/epsc2020-819, 2020.

EPSC2020-410
Lukas Maes, Markus Fraenz, James McFadden, and Mehdi Benna

Next to its main constituent O2+, the Martian ionosphere consists of several other ion species, like CO2+, O+, CO+, HCO+, N2+, etc. The ionospheric escape is dominated by O2+ and O+ ions, and as a result the escape of these species is well studied. The other, minor ion species are more difficult to measure in the escaping plasma, because their contribution is typically obscured in the mass spectra of ion instruments by the more abundant O2+ peak.

In this study we use data from the SupraThermal And Thermal Ion Composition instrument (STATIC) on board MAVEN to investigate the escape of these ions. We use a peak-fitting method to separate the contribution of several ion species, including O2+, CO2+, O+ and ions with a mass between 28-30 AMU. Our method is validated against Neutral Gas and Ion Mass Spectrometer (NGIMS), also onboard MAVEN, and results in the ionosphere agree qualitatively very well.

We apply this method to STATIC data from January 2016 until May 2019 to perform a statistical study examining the escape of low energy (<100 eV) heavy (>=16 AMU) ions throughout the Martian magnetosphere and its surrounding. We find that CO2+ ions do escape through the tail but at a very limited rate, namely at less than 1% of the O2+ escape rate. Ions with a mass between 28-30 AMU, however, are found to constitute a significant part of the ionospheric outflow, with an escape rate 30% of the O2+ rate and 15% of the total heavy ion escape.

How to cite: Maes, L., Fraenz, M., McFadden, J., and Benna, M.: The escape of CO2+ and other heavy minor ions from Mars, Europlanet Science Congress 2020, online, 21 Sep–9 Oct 2020, EPSC2020-410, https://doi.org/10.5194/epsc2020-410, 2020.

EPSC2020-576ECP
Tsubasa Kotani, Masatoshi Yamauchi, Hans Nilsson, Gabriella Stenberg-Wieser, Martin Wieser, Sofia Bergman, Satoshi Taguchi, and Charlotte Götz

Introduction

The Plasma Consortium Ion Composition Analyzer (RPC/ICA) onboard ESA's Rosetta mission has revealed that comet-origin water ions are accelerated in a more complicated manner than previously thought[1]. Understanding these acceleration mechanisms in a cometary environment is an important issue in both cometary science and plasma physics. Very close to the comet, ambipolar diffusion accelerates newly ionized (by solar Extreme-UV (EUV) radiation, electron impact ionization, or charge-exchange) outgassing water molecules from the comet. If moderately far from the comet where solar winds can access, water ions are picked up by the solar wind and accelerated by the solar wind electric field[1].

However, water ions are also accelerated in the magnetosphere, where solar wind ions cannot intrude and background neutrals may play some role. The acceleration mechanism there is not fully understood due to an unknown electric field environment. One common characteristic as observed by ICA near in the comet 67P/Churyumov-Gerasimenko is energy-angle dispersion when the acceleration is > 100 eV[2,3].  If the acceleration is > 300 eV (particularly > 1 keV), we found that dispersion becomes reversed for almost all cases. In our presentation, we show two typical types of energy-angle dispersions. We also discuss a possible acceleration mechanism.

Instrument

RPC-ICA measures the distribution function of positively charged ions with mass-separation capability, has a field of view (FOV) of 360° with 22.5° resolution in azimuthal angle, and scanning 90° in the elevation direction over 192 sec with ~ 5° resolution for each elevation scan.  To survey all the comet-rendezvous data from 2014 August to 2016 September, we used one-hour quick-look (QL) data as shown in Figure 1 and Figure 3. The magnetometer RPC-MAG measures the three components of the magnetic field, with an accuracy of ~ ±3 nT per component.

Observation

1. Nose-dispersion:  Figure 1 shows the energy-time, energy-angle, and energy-mass spectrograms of positively charged ions from 7 December 2015, 23:00-24:00 UTC. In Figure 1, the direction of the energy-elevation dispersions is reversed between above 500 eV and below 200 eV, making the entire pattern nose-like.  This pattern is also seen in the integrated energy-elevation spectrograms in Figure 1b.  Figure 1c indicates that they are heavy ions whereas the solar wind ions (H+, He2+, He+) are not observed. The energy of the "nose", where the direction of dispersion reversed, is about 300-500 eV. We find 68 events (in terms of 1-hour QL data) for this type of dispersion with maximum energy > 1 keV out of 12268 hours QL data during 2 years.

Next, we investigate where water ions come from with respect to the directions of the sun, the comet, and the magnetic field. We note that, although high-energy water ions (> 200 eV) are dispersed in the elevation plane, lower energy water ions (< 200 eV) are spread wider in the azimuthal direction than higher energy ions as shown in Figure 1d. Still, Figure 2 shows that the H2O+ flow direction is close to the magnetic field direction, and the pitch-angles are larger at mid energy than low and high energies, causing the nose-dispersion as illustrated in Figure 5, in addition to different (and limited) gyrophase angles for different energy.

2. Sharp-dispersion: 

In Figures 3 and 4, we show another type of dispersion event with maximum energy > 1 keV.  In this example, water ions are dispersed more "sharply" in the elevation plane. The maximum energy exceeds 1 keV, and the energy where these "sharp dispersion" events seem to be reversed is also about 100-300 eV. We find 51 events during 2 years of observation (see, Table 1).  Figure 4 indicates that higher energy water ions (>300 eV) are dispersed in the elevation plane and lower energy water ions are spread widely in the azimuthal direction, which is in good agreement with the nose-like events. However, higher energy water ions come from the direction quasi-perpendicular to the magnetic field and lower energy water ions come from the nucleus of the comet along magnetic field. This means that sharp-like dispersion occurs separately in different energy ranges in the example.

Interpretation

In previous studies where acceleration of water ions < several hundred eV is reported, dispersion direction is not reversed and therefore we could interpret it as acceleration by the electric field that is simply a transition from the solar wind electric field and the polarization (ambipolar type) electric fields[2, 4].  The sharp-dispersion event can be understood along this view, i.e., low energy water ions ( < several hundred eV) are accelerated along the magnetic field by the ambipolar electric field and the high energy water ions might be accelerated quasi-perpendicular to the magnetic field by the solar wind electric field. However, these electric fields are not enough to explain nose-like reversed dispersion. To explain the reversal of the dispersion direction, just magnetic curvature in not sufficient as illustrated in Figure 5a. In this configuration, we can explain the dispersion at lower energy with respect to pitch angle, but not the high energy part simultaneously. This means that we need more complicated non-uniformness in the magnetic field configuration. We must also note that gyroradius of 1 keV H2O with 20° pitch angles under 20 nT magnetic field is about 300 km (cf. Rosetta-comet distance is about 100 km) when considering such non-uniformity. 

References

How to cite: Kotani, T., Yamauchi, M., Nilsson, H., Stenberg-Wieser, G., Wieser, M., Bergman, S., Taguchi, S., and Götz, C.: Energy structure of the accelerated H2O ions above 1 KeV: the comet 67P/Churyumov-Gerasimenko observed by the Rosetta spacecraft, Europlanet Science Congress 2020, online, 21 Sep–9 Oct 2020, EPSC2020-576, https://doi.org/10.5194/epsc2020-576, 2020.

EPSC2020-349ECP
Gwen Hanley, David Mitchell, James McFadden, Christopher Fowler, Shane Stone, Marcin Pilinski, Mehdi Benna, Meredith Elrod, Laila Andersson, Robert Ergun, and Bruce Jakosky

Background

The ion temperature is a key parameter controlling the structure of planetary ionospheres. In the lower ionosphere, where ion motion is dominated by collisions with neutrals, ion temperatures directly affect collision frequencies. At higher altitudes, in the collisionless regime, ion temperatures influence whether some fraction of the distribution can overcome the planet’s gravity to escape to space. Reliable knowledge of ion temperatures is critical to understanding current ionospheric structures as well as the long-term evolution of planetary atmospheres.  

For nearly 40 years, the only in-situ measurements of ion temperatures at Mars were obtained from ~375 km to ~120 km altitude during the descents of the Viking landers in 1976 [1]. These measurements were made by retarding potential analyzers. Assumptions about ion composition were required to derive temperatures, and all ion species were assumed to be the same temperature. While this assumption is reasonable in the collisional regime below the exobase (~200 km), mass-dependent electromagnetic acceleration can cause temperatures to diverge at higher altitudes.

Until recently, ion temperatures at Mars have primarily been investigated using models. The majority of work has focused on explaining elevated electron temperatures in the upper ionosphere, concluding that a topside heat source (e.g. the solar wind) is required to achieve agreement between modeled profiles and Viking observations [2, 3]. The Combined Atmospheric Photochemistry and Ion Tracing (CAPIT) model reproduced Viking profiles by tracing ion paths while accounting for magnetic fields, major chemical reactions, and wave heating [4]. Models of the solar wind interaction with Mars (e.g. [5],[6]) have traditionally adopted a simplified lower boundary assuming equal electron and ion temperatures, which is significantly in error above ~200 km, in contrast to findings by Matta et al. [7] that different ion species have different temperatures. Recently, Ma et al. [8] showed that the electron pressure gradient significantly affects ion temperatures.

Since 2014, comprehensive measurements of the ionosphere above 120 km have been made by the Mars Atmosphere and Volatile EvolutioN (MAVEN) orbiter at all local times and most latitudes. Studies based on these data are beginning to revolutionize our understanding of the planet’s ionosphere. In this study, we use data collected by the MAVEN SupraThermal And Thermal Ion Composition (STATIC) instrument to present the first measurements of ion temperature at Mars since the Viking landers.


Methodology

We will present O2+ temperature profiles measured in the Martian ionosphere by STATIC. STATIC measures ion energies from 0.1 eV to 30 keV over a 360°x90° field of view, with mass resolution capable of distinguishing the main ionospheric and escaping species: CO2+, O2+, O+, and H+ [9]. Several instrumental effects contribute to the challenge of extracting ion temperatures from STATIC data, some of which require empirical corrections that are currently being calculated. Three different methods are used to calculate the O2+ temperature using different assumptions which are valid over different, overlapping altitude ranges. These calculations include corrections for spacecraft potential, ion suppression, and instrument response, as well as backscatter, straggling, and molecular fragmentation inside the instrument, among other effects. These calibrations have not been finalized, meaning that the O2+ temperatures presented require further correction.

Selection of the best temperature is based on characteristics of the measured distribution. If the population is beam-like (i.e. narrow in energy or angle), then the width of the beam indicates the temperature. However, if the distribution is broad, then calculating moments of the three-dimensional velocity distribution function provides a kinetic temperature, which can be higher than the thermal temperature of the Maxwellian core of the distribution. Once temperatures have been calculated, the data are processed automatically to determine which estimate is the most appropriate. The resulting temperature profiles are largely continuous from MAVEN’s periapsis near 150 km up to altitudes well above 350 km.


Results and Discussion

We present O2+ temperature profiles measured by STATIC when MAVEN’s periapsis occurred close to local noon, midnight, dawn, and dusk. These temperature profiles will be presented alongside the neutral Ar temperature measured by the Neutral Gas and Ion Mass Spectrometer, and the electron temperature measured by the Langmuir Probe and Waves experiment [10, 11]. We use profiles measured on the inbound segment of the orbit to minimize the effect of changing solar zenith angle. In addition, Ar temperatures are only available on the inbound segment. The Ar temperature is expected to be representative of the entire neutral population. At altitudes below ~250 km, the ion distribution is usually dominated by O2+, and we anticipate that all ions will converge to the O2+ temperature.

The ion, neutral, and electron temperatures are expected to converge below the exobase, where high collision rates force these populations to equilibrate. Although this thermalization begins to occur below ~200 km, temperature differences between Ar and O2+ persist down to MAVEN’s periapsis of 150 km. The electron temperature is several times higher than the ion temperature in this altitude range, contrary to the assumptions made in most modeling studies.

We note differences in profiles measured at different local times. Unsurprisingly, the median periapsis ion temperature at midnight is colder than at noon, reaching ~250 K at noon compared to ~175 K at midnight. Variations in temperature between successive orbits are larger on the nightside than the dayside, indicated by the larger range of temperatures measured on the nightside, which is to be expected due to the patchy, tenuous nature of the nightside ionosphere.

Measuring the cold thermal ion temperature at another planet poses many challenges. MAVEN STATIC is the first instrument capable of making such measurements at Mars–indeed, it is the first instrument capable of measuring the ion temperature since the Viking landers. Substantial progress has been made toward deriving ion temperatures from STATIC. Once the necessary calibrations are finalized, O2+ temperatures will be calculated for nearly the entire MAVEN mission, providing a new tool for systematically analyzing the Martian atmosphere.

References

[1] Hanson et al. https://doi.org/10.1029/JS082i028p04351

[2] Shinagawa & Cravens. https://doi.org/10.1029/JA094iA06p06506

[3] Cui et al. https://doi.org/10.1002/2014JE004726

[4] Andersson et al. https://doi.org/10.1016/j.icarus.2009.07.009

[5] Dong et al. https://doi.org/10.1002/2014GL059515

[6] Brecht & Ledvina. https://doi.org/10.1016/j.icarus.2009.04.028

[7] Matta et al. https://doi.org/10.1016/j.icarus.2013.09.006

[8] Ma et al. https://doi.org/10.1029/2019JA027091

[9] McFadden et al. https://doi.org/10.1007/s11214-015-0175-6

[10] Stone et al. https://doi.org/10.1029/2018JE005559

[11] Ergun et al. https://doi.org/10.1002/2015GL065280

How to cite: Hanley, G., Mitchell, D., McFadden, J., Fowler, C., Stone, S., Pilinski, M., Benna, M., Elrod, M., Andersson, L., Ergun, R., and Jakosky, B.: O2+ Temperature Profiles Measured in the Martian Ionosphere, Europlanet Science Congress 2020, online, 21 Sep–9 Oct 2020, EPSC2020-349, https://doi.org/10.5194/epsc2020-349, 2020.

EPSC2020-208
Beatriz Sanchez-Cano, Clara Narvaez, Mark Lester, Michael Mendillo, Majd Mayyasi, Mats Holmstrom, Jasper Halekas, Laila Andersson, Christopher M. Fowler, James P. McFadden, and Sofija Durward

The ionopause is a tangential discontinuity in the ionospheric thermal plasma density profile that marks the upper boundary of the ionosphere for unmagnetized planets. Since only Venus and Mars have no global “dipole” magnetic fields, ionopauses are unique to those planets. For Venus, the ionopause formation is well characterized because the thermal pressure of the ionosphere is usually larger than the solar wind dynamic pressure. For Mars, however, the maximum thermal pressure of the ionosphere is usually insufficient to balance the total pressure in the overlying magnetic pileup boundary. Therefore, the Martian ionopause is not always formed, and when it does, it is highly structured and is located at different altitudes. In this study, we characterise the Martian ionopause formation from the point of view of the electron density and electron temperature, as well as the thermal, magnetic and dynamic pressures. The objective is to investigate under which circumstances the Martian ionopause is formed, both over and far from crustal magnetic fields, and compare to the Venus’ case. We use several multi-plasma and magnetic field in-situ observations from the three deep dip campaigns of the MAVEN mission that occurred on the dayside of Mars (near subsolar point), as well as in-situ solar wind plasma observations from the Mars Express mission. We find that that 36% of the electron density profiles over strong crustal magnetic field regions had an ionopause event in contrast to the 54% of electron density profiles far from strong crustal magnetic field regions. We also find that the topside ionosphere is typically magnetized at mostly all altitudes. The ionopause, if formed, occurs where the total ionospheric pressure (magnetic+thermal) equals the upstream solar wind dynamic pressure.

How to cite: Sanchez-Cano, B., Narvaez, C., Lester, M., Mendillo, M., Mayyasi, M., Holmstrom, M., Halekas, J., Andersson, L., Fowler, C. M., McFadden, J. P., and Durward, S.: Mars’ ionopause characterization based on MAVEN and Mars Express observations, Europlanet Science Congress 2020, online, 21 Sep–9 Oct 2020, EPSC2020-208, https://doi.org/10.5194/epsc2020-208, 2020.

EPSC2020-684
Arnaud Beth, Herbert Gunell, Charlotte Götz, Maria Hamrin, Hans Nilsson, and Cyril Simon Wedlund

A common plasma feature which has been observed at comets during a relatively high outgassing activity is the presence of a magnetic field-free region, the so-called diamagnetic cavity. Observed for the first time at 1P/Halley, such structures have also been crossed many times at low relative speed at 67P/Churyumov-Gerasimenko by the ESA/Rosetta spacecraft.

Many questions have been raised about the origin of this boundary. It is quite clear that, as one goes from an unmagnetised to a magnetised medium, one of the forces playing a role is the magnetic (pressure and tension) force. But what other force counter-balances the latter and helps form the boundary? For 1P/Halley, one formerly accepted explanation was the ion-neutral friction which has been investigated many times with magneto-hydrodynamic and hybrid simulations. However, the ion-neutral friction does not explain the observations at 67P/C-G as the outgassing rate was much lower than that of 1P/Halley.

In this work, we investigate the balance between the electromagnetic forces at the boundary with a collisionless Particle-In-Cell 1D3V simulation and the open source code Smilei. It allows us to go down to scales which are not modelled by the more common MHD or hybrid simulations. In addition, this fully kinetic simulation give us access to the different moments (e.g., number density, mean velocity, pressure tensor) of the distribution function without extra assumptions (e.g., Ohm's law and adiabatic electrons). In particular, we investigate at the balance between the different forces at play on the electrons, i.e., the electron pressure gradient and the Lorentz force.

For example, first results show that there is a sharp increase in the electric field at the boundary which decelerates ions coming from the diamagnetic cavity before reaching the magnetised part and being backstreamed towards the comet.

How to cite: Beth, A., Gunell, H., Götz, C., Hamrin, M., Nilsson, H., and Simon Wedlund, C.: Balance at the edge of the diamagnetic cavity: first results from a Particle-In-Cell simulation, Europlanet Science Congress 2020, online, 21 Sep–9 Oct 2020, EPSC2020-684, https://doi.org/10.5194/epsc2020-684, 2020.

EPSC2020-543
Francisco González-Galindo, David Eusebio, Frantisek Němec, Kerstin Peter, Andrew Kopf, Sylvia Tellman, and Martin Pätzold


Introduction


The Martian dayside ionosphere features a well-defined maximum in the electron density profile placed at about 130 km from the surface and produced by the interaction of the incoming UV solar radiation with the upper atmosphere. The ionosphere of Mars is thus strongly affected by changes in the underlying neutral atmosphere and in the amount of solar radiation getting to the planet. Being one of the main reservoirs for atmospheric escape to space, it is important to characterize the variability of the ionosphere and its potential implications for the long-term evolution of the Martian climate.


The major variability factor affecting the ionospheric main peak region is the change in the solar zenith angle (SZA), which produces an increase in the peak altitude and a decrease in the peak electron density when approaching the terminator (Withers, 2009). It is also well known that an increase in the solar activity would produce an increase in the peak electron density due to the enhanced ionization. Less attention has been devoted to the ionospheric seasonal variability. The significant eccentricity of the Martian orbit is expected to induce changes in the ionosphere. The changing Sun-Mars distance during the Martian year affects the amount of solar radiation getting to the planet, and thus is expected to modify the peak electron density. The changes in the temperature of the lower/middle atmosphere driven by the orbital eccentricity are also expected to affect the altitude of the peak. While previous works have confirmed these expectations (e.g. Zou et al., 2005; Morgan et al., 2008; Němec et al., 2011), a complete characterization of the seasonal variability has not yet been performed due to the limited seasonal coverage of the existing datasets. In this work we take advantage of the large ionospheric dataset collected by two instruments on Mars Express, the radar MARSIS on its Active Ionospheric Sounding (AIS) mode, and the radio-occultation experiment MaRS, during the more than 16 years (and still running) of the mission.


Results


In order to isolate the seasonal variability, we first remove the main variability factors, the change in the SZA and the change in the intrinsic solar activity, by using the well-known and thoroughly tested expressions derived from Chapman theory. Then we average the obtained corrected peak electron densities and peak altitudes in bins of 5 degrees of Ls. Finally we fit a sinusoidal function to the obtained seasonal variability. The main results we obtain are:


1. The seasonal variability of both the peak electron density and the peak altitude can be well reproduced by sinusoidal functions maximizing around the date of the perihelion. The fitted amplitudes are, for the peak electron density, about 9% of the annually-averaged value, and for the peak altitude about 9 km.


2. We find hints of latitudinal differences in the seasonal evolution. However the large spread of the data does not allow for a detailed study of these latitudinal effects.


3. By separating the variability obtained during Mars Year 28 (MY28) from the rest of the years we find that the global dust storm during MY28 produced an increase in the peak altitude of about 10-15 km, in line with previous works (Girazian et al., 2020)


4. We do not find an increase in the peak electron density around Ls=30-70, such as previously found for the TEC (Sánchez-Cano et al., 2018)

Fig. 1. Seasonal variability of the latitudinally-averaged, SZA and solar activity corrected peak electron density

Fig. 2. Seasonal variability of the latitudinally-averaged, SZA corrected peak altitude

References

Girazian, Z., et al., Variations in the Ionospheric Peak Altitude at Mars in Response to Dust Storms: 13 Years of Observations From the Mars Express Radar Sounder. Journal of Geophysical Research (Planets), 125 (5), e06092. doi: 10.1029/2019JE006092, 2020

Morgan, D. D., et al., Variation of the Martian ionospheric electron density from Mars Express radar soundings. Journal of Geophysical Research (Space Physics), 113 , 9303. doi: 10.1029/2008JA013313, 2008


Němec, F., et al., Dayside ionosphere of Mars: Empirical model based on data from the MARSIS instrument. Journal of Geophysical Research (Planets), 116 (E7), E07003. doi:10.1029/2010JE003789, 2011


Sánchez-Cano, B., et al., Spatial, Seasonal, and Solar Cycle Variations of the Martian Total Electron Content (TEC): Is the TEC a Good Tracer for Atmospheric Cycles? Journal of Geophysical Research (Planets), 123 (7), 1746-1759. doi: 10.1029/2018JE005626, 2018JE005626, 2018


Withers, P.. A review of observed variability in the dayside ionosphere of Mars. Advances in Space Research, 44 , 277-307. doi: 10.1016/j.asr.2009.04.027, 2009


Acknowledgements

F.G.-G. is funded by the Spanish Ministerio de Ciencia, Innovación y Universidades, the Agencia Estatal de Investigación and EC FEDER funds under project RTI2018-100920-J-I00, and acknowledges financial support from the State Agency for Research of the Spanish MCIU through the Center of Excellence Severo Ochoa award to the Instituto de Astrofísica de Andalucía (SEV-2017-0709). F. Němec was supported by MSMT Grant LTAUSA17070

How to cite: González-Galindo, F., Eusebio, D., Němec, F., Peter, K., Kopf, A., Tellman, S., and Pätzold, M.: Seasonal variability of the Martian dayside ionosphere from Mars Express observations, Europlanet Science Congress 2020, online, 21 Sep–9 Oct 2020, EPSC2020-543, https://doi.org/10.5194/epsc2020-543, 2020.

EPSC2020-798ECP
Peter Stephenson, Marina Galand, Jan Deca, Pierre Henri, and Gianluca Carnielli

The plasma instruments, Mutual Impedance Probe (MIP) and Langmuir Probe (LAP), part of the Rosetta Plasma Consortium (RPC), onboard the Rosetta mission to comet 67P revealed a population of cold electrons (<1eV) (Engelhardt et al., 2018; Wattieaux et al, 2020; Gilet et al., 2020). This population is primarily generated by cooling warm (~10eV) newly-born cometary electrons through collisions with the neutral coma. What is surprising is that the cold electrons were detected throughout the escort phase, even at very low outgassing rates (Q<1e26 s-1) at large heliocentric distances (>3 AU), when the coma was not thought to be dense enough to cool the electron population significantly.

 Using a collisional test particle model, we examine the behaviour of electrons in the coma of a weakly outgassing comet and the formation of a cold population through electron-neutral collisions. The model incorporates three electron sources: the solar wind, photo-electrons produced through ionisation of the cometary neutrals by extreme ultraviolet solar radiation, and secondary electrons produced through electron-impact ionisation.

The model includes different electron-water collision processes, including elastic, excitation, and ionisation collisions.

 The electron trajectories are shaped by electric and magnetic fields, which are taken from a 3D collisionless fully-kinetic Particle-in-Cell (PIC) model of the solar wind and cometary plasma  (Deca 2017, 2019). We use a spherically symmetric coma of pure water, which gives a r-2 profile in the neutral density. Throughout their lifetime, electrons undergo stochastic collisions with neutral molecules, which can degrade the electrons in energy or scatter them.

We first validate our model with comparison to results from PIC simulations. We then demonstrate the trapping of electrons in the coma by an ambipolar electric field and the impact of this trapping on the production of cold electrons.

How to cite: Stephenson, P., Galand, M., Deca, J., Henri, P., and Carnielli, G.: Cooling of Electrons in a Weakly Outgassing Comet , Europlanet Science Congress 2020, online, 21 Sep–9 Oct 2020, EPSC2020-798, https://doi.org/10.5194/epsc2020-798, 2020.

EPSC2020-382
Angeline Burrell, Beatriz Sánchez-Cano, Olivier Witasse, Mark Lester, and Marco Cartacci

Planetary ionospheres undergo many changes at dawn and dusk due to both photochemical and transport processes.  The relative importance of these different processes vary depending on a variety of factors, including the amount of solar radiation, the composition of the thermosphere, and the characteristics of any local magnetic fields.  This study uses the similarities between the ionospheres on Mars and Earth to examine the behaviour of the ionosphere at dawn and dusk.  It has notable implications for comparative aeronomy, as a solid understanding of ionospheric processes on planets with and without magnetic fields is important for characterising the environments of solar and exoplanets, as well as atmospheric evolution over long time scales.

The amount of plasma present in the ionosphere was measuring using the total electron content (TEC), and grouped so that both solstices and different phases of the solar cycle could be examined.  To allow comparisons between the ionospheres of Mars and Earth, which differ greatly in density, the rate of change of TEC as a function of solar zenith angle was used to compare the plasma production and losses in the main layer of each planetary ionosphere.  Examination of the dawn and dusk TEC slopes shows that, to first order, the Martian slopes are symmetric while those at Earth are not.  This symmetry is interpreted as an indicator of photochemical equilibrium, and different reasons for deviations from symmetry were explored.  The presence or absence of a magnetic field played a large role in shaping plasma transport, with photochemical processes in both ionospheres behaving similarly in the absence of a magnetic field.  At Mars, it was found that transport processes were most important at solar maximum, while at Earth transport processes were most important at solar minimum. 

How to cite: Burrell, A., Sánchez-Cano, B., Witasse, O., Lester, M., and Cartacci, M.: Comparison of Terrestrial and Martian TEC at Dawn and Dusk during Solstices, Europlanet Science Congress 2020, online, 21 Sep–9 Oct 2020, EPSC2020-382, https://doi.org/10.5194/epsc2020-382, 2020.

EPSC2020-507
Zachary Girazian and Jasper Halekas

The nightside ionosphere of Mars is mainly produced by a combination of electron impact ionization and day-to-night ion transport. The relative contribution of these two sources, and their variability over the solar cycle, has not been well established. To address this issue, we use Mars Atmosphere and Volatile EvolutioN (MAVEN) observations to search for cyclical variability in nightside ion densities over the solar cycle. We find that nightside densities (O+ in particular) were significantly higher during solar maximum (2014) than during solar minimum (2019). Our results suggest that, similar to the nightside ionosphere of Venus, day-to-night transport of O+ ions is more prominent during solar maximum.

How to cite: Girazian, Z. and Halekas, J.: A Search for Solar Cycle Variability in the Nightside Ionosphere of Mars, Europlanet Science Congress 2020, online, 21 Sep–9 Oct 2020, EPSC2020-507, https://doi.org/10.5194/epsc2020-507, 2020.

EPSC2020-734
Özgür Karatekin, Ananya Krishnan, Julien Drevon, Ahmed El Fadhel, Nicolas Bergeot, David Hinson, and Olivier Witasse

ESA’s Mars Exress spacecraft has been exploring the red planet since January 2004. The spacecraft is able to receive and transmit signals at both S-band and X-band. Changes in the radio signals properties while propagating through the atmosphere yield information on the electron density profile. The Mars’ ionosphere is very variable in time. One source of its variability is the solar activity. Here we study the effect of solar flares and coronal mass ejections on the Mars’ ionosphere using the publicly available Mars Express radio occultation data. A new software in python was developed to process the residual frequencies data sets, and was validated using higher-level archival data. We calculate the electron density profiles before, during, and after such solar events. The variations in ionospheric parameters (total electron content, peak density and altitude) are quantified in order to understand the ionospheric changes due to solar activity. As expected, significant variations in these parameters have been identified. The results are compared with additional measurements and models. 


Figure 1: The snapshots of the solar wind disturbances on 9 June  2011 (left).  Electron density profiles observed by  MEX  (Right)

How to cite: Karatekin, Ö., Krishnan, A., Drevon, J., El Fadhel, A., Bergeot, N., Hinson, D., and Witasse, O.: Analysis of solar events with Mars Express radio occultation data, Europlanet Science Congress 2020, online, 21 Sep–9 Oct 2020, EPSC2020-734, https://doi.org/10.5194/epsc2020-734, 2020.

EPSC2020-248ECP
Paul Stefan Szabo, Herbert Biber, Noah Jäggi, Markus Wappl, Reinhard Stadlmayr, Daniel Primetzhofer, Andreas Nenning, Andreas Mutzke, Jürgen Fleig, Klaus Mezger, Helmut Lammer, André Galli, Peter Wurz, and Friedrich Aumayr

Experimental quantification of sputtering of planetary surface analogs provides important constraints for the understanding of space weathering [1]. Whereas the Moon and Mars are mostly irradiated by solar wind ions, the Martian moon Phobos is also exposed to atmospheric ions that escape from Mars [2]. In the Martian tail region O+ and O2+ ions at energies of several 100 to several 1000 eV are the predominant contribution to the sputtering of the surface of Phobos [3].

Validating and improving such models requires a more detailed experimental investigation of sputtering with relevant analog samples. Therefore, sputtering experiments with O+, C+, O2+ and CO2+ were performed with energies from 1 to 5 keV, corresponding to energies relevant for Martian ions [4]. Augite (Ca, Mg, Fe)2Si2O6 mineral samples were chosen as a Phobos analog since their elemental composition is close to the current understanding of the composition of Phobos’ surface [5]. Thin films were deposited from augite onto Quartz Crystal Microbalances (QCM), which allow in-situ measurements of sputtering yields [6]. SDTrimSP simulations with established input parameters for augite were performed to compare the simulation outcomes with experimental results [7].


Figure 1 Sputtering yields of 2 keV (blue) and 5 keV (orange) O+ ions under different angles of incidence. Experimental values (dots) are compared to SDTrimSP (dashed lines) and SRIM simulations (dotted lines).


Measured mass changes during O+ and C+ irradiation are slightly smaller than predicted by the SDTrimSP sputtering simulation, which indicates implantation of projectile ions into the samples (for O+ results, see Figure 1). SRIM simulations are known to overestimate sputter yields for such samples, as is also observed here. Measurements with O2+ and CO2+ show no indication of molecular effects. Their behavior is thus equivalent to sputtering by the sum of their atomic constituents at the same velocity.


Figure 2 Calculated ratio of sputtering by atmospheric O ions and solar wind ions. The result from Nenon et al. (blue dashed line) is compared to rescaled calculations on our new experimental data for sputtering by O ions (red line).


For the sputtering of the surface of Phobos, the new experimental results support previous assumptions that only O+ and O2+ ions have to be considered. The sputtering by CO2+ ions is most likely negligible. Regarding the O ions, the new experimental results suggest lower sputtering yields by about 50%. Nevertheless, sputtering in the Martian magnetotail region will still be dominated by atmospheric O ions, as previously calculated (Figure 2) [2, 3]. Over the whole orbit of Phobos, our results predict that atmospheric O ions account for 10 to 15% of the sputtering of Phobos’ surface.


List of References

[1]          B. Hapke, J. Geophys. Res.: Planets 106, 10039 (2001).

[2]          A.R. Poppe, S.M. Curry, Geophys. Res. Lett., 41, 6335 (2014).

[3]          Q. Nenon, et al., J. Geophys. Res.: Planets 124, 3385 (2019).

[4]          P.S. Szabo, et al., submitted to J. Geophys. Res.: Planets (2020).

[5]          F. Cipriani, et al., Icarus 212, 643 (2011).

[6]          G. Hayderer, et al., Rev. Sci. Instrum. 70, 3696 (1999).

[7]          A. Mutzke, IPP-Report 2019-02 (2019).

How to cite: Szabo, P. S., Biber, H., Jäggi, N., Wappl, M., Stadlmayr, R., Primetzhofer, D., Nenning, A., Mutzke, A., Fleig, J., Mezger, K., Lammer, H., Galli, A., Wurz, P., and Aumayr, F.: Experimental Investigation of Sputtering on Phobos by Atomic and Molecular Ions in the Martian Wake, Europlanet Science Congress 2020, online, 21 Sep–9 Oct 2020, EPSC2020-248, https://doi.org/10.5194/epsc2020-248, 2020.