Introduction: Telescopic and spacecraft observations of the surfaces of Jupiter’s icy moons have provided information on their composition, mostly from the spectral analysis of the reflected light [1-4]. The surfaces of these bodies are made of crystalline and amorphous water ice and several highly hydrated salty phases [1 – 9]. As several potential chemical composition are relevant for the surfaces of these moons, as much as for other bodies covered with hydrated salty phases, the laboratory work ongoing at the University of Bern intends to enlighten how different salts mixed with water ice in different ways affect the reflectance. We prepared several samples by mixing MgSO4, NaCl, MgCl2 and Na2SO4 with ices to better constrain how these components, thought to be present at global and/or local scale, can form hydrated phases depending on the preparation method, which roughly simulate processes for the production of renewed / pristine material at the surface of icy moons. The effects of the strong irradiation at the surface of Jupiter’s moons are also investigated.
Flash-frozen salty ices: Granular ices have been produced through a flash-freezing process by nebulizing droplets into liquid nitrogen [10] with the SPIPA setup from the University of Bern. This preparation process tends to simulate a production of particles through an active plume or geyser at, or close to, the surface. The water ice itself is not able to incorporate salt in its crystal lattice at ambient pressure, contrary to high pressure [11, 12]. Given the temperature of liquid nitrogen, particles solidify forming amorphous or glassy phases of salt and water. This process is described in other fields of science [13] and demonstrates to which extent a flash-freezing procedure generates highly complex particles, made of different phases, both amorphous and crystalline.
Slabs of salty ices: Starting from similar composition but simulating a slow freezing process, slabs of salty ices have been produced with different concentrations of salts, from low to saturated proportions (wt% of salt is varying in function of the salt). We identify the signature of different hydrates, regarding different salts, expected to form through slow crystallisation following their phase diagrams and thermodynamic equilibrium [14]. The ice itself has the time to expels salt from its crystal. This procedure could be more relevant for ice produced either inside “hydrological” analogues systems inside ice shells, or at the interface of the ice shell and the global salty ocean. By letting slabs samples sublimate slowly in vacuum, absorptions bands related to the hydrated phases appeared.

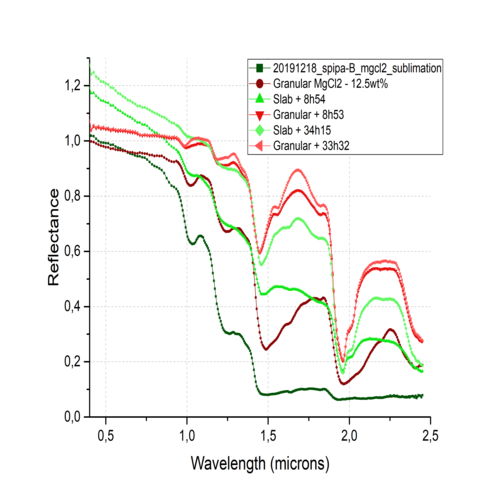
Figure 1: Reflectance spectra of slabs (green) and granular ices (red) made of two different brines containing water and 12.5wt% of MgCl2.
Figure 1 shows a comparison and evolutions between slabs (green) and granular ice (red) in the case of MgCl2. These samples have been produced from initial brines with 12.5wt% MgCl2. The differences observed between these spectra are in part due to the particles themselves, in terms of size as well as their production process, generating different hydrated phases and in different proportions.
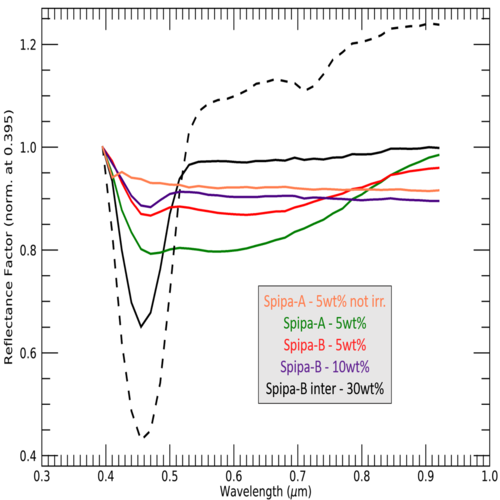
Irradiated Ices: F and M-centres are well-known defects in alkali halides crystals [15], formed through electrons replacement in crystal lattice. Due to the coloration induced by this effect, the relevance of this process for the surface of Europa has been strongly suggested [8, 9]. We irradiated salty ices with energetic electrons of 1 and 5 keV, for 15 minutes. Generating a deposition of 1016 e-/cm2, equivalent of weeks to months at the surface of Europa. The ices were produced either from liquid solutions with different concentrations of NaCl (5, 10 and 30wt%) in intimate mixture or as inter-mixture (salt and water ice particles are mixed at solid state [10]). Figure 2 shows the different spectra of salty ices after e- irradiations; normalized at their reflectance value at 0.395 nm. The variations showed from one sample to another are due to their production procedure. The grain size, the concentrations in salt and the mixing process of water ice and salt (hydrated or not) are all playing a role in the resulting alteration of the analogue and will be detailed at the conference.

Figure 2: Reflectance spectra of irradiated ices containing 5 10 or 30 wt% of NaCl. Spipa-A and Spipa-B has respectively grains sizes of 4.5±2 µm and 67 ± 31 µm. The orange spectrum is of a non-irradiated ice containing 5wt% of NaCl. The electron irradiation has been conducted at the energy of 1keV, except for the black dot spectra, at 5keV.
Summary and Perspectives:
This work demonstrates the major influence of the production method on the spectroscopic properties of salty ices prepared as analogues for the surfaces of the icy moons. Simulating irradiation conditions occurring at the surface of the icy moons reveals puzzling differences between the behaviours of different samples. New series of experiments are conducted to understand the systematics behind these behaviours. Once validated, spectral data will be distributed through the DACE and SSHADe platforms (https://dace.unige.ch/lossySearch/ ; https://www.sshade.eu/db/bypass).
Acknowledgments: The team from the University of Bern is supported by the Swiss National Science Foundation and through the NCCR PlanetS.
References: [1] Ligier, N., et al., (2016), The Astronomical Journal 151. [2] Ligier, N., et al., (2019), Icarus 333. [3] Trumbo, S., et al., (2019), The Astronomical Journal 158. [4] Trumbo, S., et al., (2019), Science Advances 5. [5] Carlson, R. W., et al., (2005), Icarus, 177. [6] McCord, T. B., et al., (2001), Science, 292. [7] Johnson, P. V., et al., (2019), Icarus 321. [8] Hand, K.P., Carlson, R.W., (2015), Geophysical Research Letter. [9] Poston, M. J., et al., (2018), Journal of Geophysical Research: Planets, 122. [10] Pommerol, A., et al (2019), Space Sci Rev 215. [11] Bove, L. E., et al, (2019), Phil. Trans. R. Soc. A 377. [12] Klotz, S., et al., (2009), Nature Materials, Vol.8. [13] Uchida, T., et al, (2010), Phys. Chem. Chem. Phys., 12. [14] Li, D., et al, (2016), CALPHAD: Computer Coupling of Phase Diagrams and Thermochemistry 53. [15] Seitz, F., (1946), Review of modern physics, Vol.18 – number 3. .


