Europlanet Science Congress 2020
Virtual meeting
21 September – 9 October 2020
Europlanet Science Congress 2020
Virtual meeting
21 September – 9 October 2020

Poster presentations and abstracts

OPS3

Despite its satellite status, Titan has nothing to envy to planets: it has planetary dimensions, a substantial and dynamic atmosphere, a carbon cycle, a variety of geological features (dunes, lakes, rivers, mountains…), seasons and a hidden ocean. It even now has its own mission: Dragonfly, selected by NASA in the frame of the New Frontiers program.
In this session, scientific presentations are solicited to cover all aspects of current research on Titan: from its interior to its upper atmosphere, using data collected in the frame of the Cassini-Huygens mission (2004-2017) or from ground-based telescopes (e.g., ALMA) or based on modelling and experimental efforts to support the interpretation of past and future observations of this unique world.

Convener: Alice Le Gall | Co-conveners: Anezina Solomonidou, Sandrine Vinatier, Giuseppe Mitri, Marco Mastroguiseppe, Sarah M. Hörst

Session assets

Session summary

Chairperson: Alice Le Gall
Ionosphere
EPSC2020-791
Niklas Edberg, Jan-Erik Wahlund, and Erik Vigren

Titan, the largest moon of Saturn, has a dense and nitrogen-rich atmosphere, which is similar to that of early Earth before lived evolved. Solar EUV radiation and energetic particles ionizes the atmosphere and thereby forming a layer of plasma, the ionosphere, in the uppermost part of the atmosphere. The Cassini spacecraft flew past the moon Titan 127 times during its 14-year mission in the Saturn system. During most of these close flybys Cassini entered the ionosphere and some reached the ionospheric peak, located at some 1400 km above the moon surface. With the Langmuir probe instrument, we could study the plasma properties, e.g. ion and electron density, temperature etc., and a very dynamic ionospheric structure was found. In particular, significant and apparently sporadic density spikes in the upper ionosphere were found. These density peaks are manifested as a sudden increase in the measured density by some 10-100 cm-3 over a time period of roughly minutes. These have so far been left unattended in our studies of Titan. We will present some statistics on their appearance and initial result on the mechanism forming them.


How to cite: Edberg, N., Wahlund, J.-E., and Vigren, E.: Density spikes in Titan’s upper ionosphere, Europlanet Science Congress 2020, online, 21 Sep–9 Oct 2020, EPSC2020-791, https://doi.org/10.5194/epsc2020-791, 2020.

Atmosphere
EPSC2020-85
Athena Coustenis, Donald Jennings, Richard Achterberg, Panayotis Lavvas, Georgios Bampasidis, Conor Nixon, and F. Michael Flasar

In our recent publication [1] we reported new results concerning the seasonal atmospheric evolution near Titan’s poles and equator in terms of temperature and composition using nadir spectra acquired by the Cassini Composite Infrared Spectrometer (CIRS) at high spectral resolution during the last year of the Cassini mission in 2017 complementing previous investigations covering almost two Titan seasons. In previous papers [2,3], we reported on monitoring of Titan’s stratosphere near the poles after the mid-2009 northern spring equinox. In particular we have reported on the observed strong temperature decrease and compositional enhancement above Titan’s southern polar latitudes since 2012 and until 2014 of several trace species, such as complex hydrocarbons and nitriles, which were previously observed only at high northern latitudes. This effect accompanied the transition of Titan’s seasons from northern winter in 2002 to northern summer in 2017, while at that latter time, the southern hemisphere was entering winter. Our new data, acquired in 2017 and analyzed here, are important because they are the only ones recorded since 2014 close to the south pole in the mid-infrared nadir mode at high resolution. A large temperature increase in the southern polar stratosphere (by 10-50 K in the 0.1 to 0.01 mbar pressure range) is found associated with a change in the temperature profile’s shape. The 2017 observations also show a related significant decrease in most of the southern abundances which must have started sometime between 2014 and 2017 [1]. For the north, the spectra indicate a continuation of the decrease of the abundances which we first reported to have started in 2015 and small temperature variations [1]. We discuss comparisons with other results and with current photochemical and dynamical models which could be updated and improved by the new constraints set by the findings presented here.

[1] Coustenis et al., 2019, Icarus 344, 1 July 2020, 113413 ; [2] Coustenis et al., 2016, Icarus 270, 409-420; [3] Coustenis et al., 2018, Astroph. J. Lett. 854, no2.

How to cite: Coustenis, A., Jennings, D., Achterberg, R., Lavvas, P., Bampasidis, G., Nixon, C., and Flasar, F. M.: Titan’s neutral atmosphere seasonal variations up to the end of the Cassini mission, Europlanet Science Congress 2020, online, 21 Sep–9 Oct 2020, EPSC2020-85, https://doi.org/10.5194/epsc2020-85, 2020.

EPSC2020-908
Tersi Arias-Young and Jonathan Mitchell

ABSTRACT

Examining the morphologies of Titan’s clouds can provide a general physical interpretation of observed storms and their relation to atmospheric dynamics of the moon. Through a combined analysis of observations of images collected by Cassini ISS during Titan flybys, we search for cloud phenomena to identify various types of storms. Several of the observed cloud features also give us both spatial and temporal information that reveals how the clouds evolve in time. We employ the cloud activity of the observed clouds to describe their characteristics and search for time evolution patterns to try to identify the dynamics behind them, for instance Rossby and gravity waves.

Observations of a predominant example of a mid-latitude cloud system was captured by Cassini ISS cameras over a period of about 24 hours from Dec. 13 to 14, 2009, after the onset of a new season of the Saturn system. The images show methane clouds in the troposphere concentrated in a band between 45o and 63o south latitude, a streak-shaped mid-latitude cloud system extending across half the globe, traveling several hundred kilometers during the observation period. The sequence of images obtained throughout this flyby allowed us to create maps (see image below) that were made into movies of clouds moving across the moon's surface background.

We present the analysis of these  “streamer clouds”, as we have dubbed them, and a handful of other mid-latitude cloud system events based on observations of the movies produced from their ISS-mapped images. The results of the analysis and the implications for Titan's atmospheric instabilities will be discussed.

How to cite: Arias-Young, T. and Mitchell, J.: Morphology and time evolution of observed mid-latitude clouds on Titan as tracers of storm types, waves and instabilities., Europlanet Science Congress 2020, online, 21 Sep–9 Oct 2020, EPSC2020-908, https://doi.org/10.5194/epsc2020-908, 2020.

EPSC2020-790
Reevaluation of Methane vertical profile at Huygens Landing site from Huygens/GCMS measurements
(withdrawn)
Thomas Gautier, Joseph Serigano, Cyril Szopa, Sarah Hörst, and Melissa Trainer
Surface
EPSC2020-1013ECP
Yue Yu, Julia Garver, Xinting Yu, and Xi Zhang

Titan is a dynamic world with a unique N2-CH4 atmosphere where photochemistry is actively converting nitrogen and methane into organic hydrocarbon and nitrile molecules such as C2H6, C2H2, C3H8, C6H6, HCN, etc (Horst, 2017). These simple organic molecules could also further polymerize into more complex molecules and coagulate to form the refractory aerosols that make up Titan’s opaque haze layers. Observations from ground-based telescopes and spacecrafts have shown layers of clouds in Titan’s atmosphere and we have detected multiple hydrocarbon and nitrile compounds residing in the clouds, such as CH4, C2H6, C6H6, HCN, C4N2, HC3N (e.g., Anderson et al., 2018). The discovery of Titan’s clouds has made us wonder about their origin and formation and their role in Titan’s dynamics. The goal of this project is to provide a theoretical framework to better understand cloud formation on Titan through wetting and contact angle estimation. Many of the hydrocarbon and nitrile ice cloud species would remain solid when they fall onto Titan’s surface, so we also aim to study the interactions between these species and the surface of Titan’s lakes.

We first determined the species that are condensable in Titan’s atmosphere by plotting their condensation curves and the temperature profile of Titan. We found that CH4, C2H6, C2H2, C3H4, C3H6, C4H2, C6H6, C2N2, C4N2, HCN, and HC3N are able to condense into ice clouds and C3H8 are able to condense into liquid clouds. The refractory solid aerosols in Titan’s atmosphere are proposed to be cloud seeds for the observed cloud species. The surface energy of Titan’s aerosol analog “tholin” has been determined previously (Yu et al., 2017, in revision), which enabled us to estimate the liquid-solid/ice-solid contact angle between the potential cloud condenses and Titan’s aerosol. With the surface tension of the liquid cloud condensate (C3H8) and the surface energy of the solid cloud condensates (CH4, C2H6, C2H2, C3H4, C3H6, C4H2, C6H6, C2N2, C4N2, HCN), we found that the contact angle between all the organic condensates (solid CH4, C2H6, C2H2, C3H4, C3H6, C4H2, C6H6, C2N2, C4N2, HCN, and HC3N and liquid C3H8) and the aerosols are all relatively small (<35 degree). This indicates that Titan’s aerosols are easily wettable by the cloud condensates and are thus good cloud seeds for most simple hydrocarbon and nitrile clouds in Titan’s atmosphere. We also found small contact angles between solid organic species and the Titan lakes (a mixture of methane/ethane/nitrogen) before they fall into the lakes (assuming they are not soluble in the lakes), which means that these organic are likely unable to float on Titan’s lakes to damp the surface waves.

Figure 1: Condensation curve of the hydrocarbon species in Titan's atmosphere. The solid lines indicate gas-solid transitions and the dashed line indicates gas-liquid transition.

Figure 1: Condensation curve of the nitrile species in Titan's atmosphere. The solid lines indicate gas-solid transitions.

References:

1. Anderson, C. M., Samuelson, R. E., & Nna-Mvondo, D. 2018, SSRv, 214, 125

2. Hörst, S. M. 2017, JGR-Planets, 122, 432–482.

3. Yu, X., Hörst, S. M., He, C. et al., 2017 JGR-Planets, 122, 2610.

4. Yu, X., Hörst, S. M., He, C., et al. In revision

How to cite: Yu, Y., Garver, J., Yu, X., and Zhang, X.: Aerosol-Organic Condensates-Lake Interactions on Titan, Europlanet Science Congress 2020, online, 21 Sep–9 Oct 2020, EPSC2020-1013, https://doi.org/10.5194/epsc2020-1013, 2020.

EPSC2020-816ECP
James McKevitt

Introduction

Key questions surrounding the origin and evolution of Titan and the Saturnian system in which it resides remain following the Cassini-Huygens mission. In-situ measurements performed at key locations on the moon are a highly effective way to address these questions, and the aerial-aquatic platform proposed in this report serves to deliver unprecedented access to Titan's northern surface lakes, allowing an understanding of the hydrocarbon cycle, the potential for habitability in the environment and the chemical processes that occur at the surface. The proposed heavier-than-air flight and plunge-diving aquatic landing spacecraft, ASTrAEUS, requires modelling of the conditions which can be expected on Titan's surface lakes, the initial stages of which are detailed here through the use of multiphysics fluid-structure interaction (FSI) CFD simulations with a coupled meshfree smoothed-particle hydrodynamics (SPH) and finite element method (FEM) approach in LS-DYNA.

Spacecraft

The ASTrAEUS (erial urveyor for itan with quatic Operation for xtended ability) spacecraft provides an aerial-aquatic platform inspired by the flight and ‘plunge-diving’ landing of the gannet sea bird.


Figure 1: Impression of a 'plunge-diving' manoeuvre by an aerial-aquatic aircraft inspired by the gannet seabird (inset). Inset adapted from Liang et al. (2013).

A key and unique benefit of the ASTrAEUS proposal is the ability to make in-situ measurements in various separate bodies of surface liquid on Titan, allowing characterisation of these areas to a level currently unavailable with any planned or proposed mission. Kraken Mare is selected as an initial landing site due to it being Titan’s largest lake and due to its proximity to a number of other lakes of key interest to the scientific community.

Numerical Modelling

This numerical study involves the CFD simulation of a rigid body entering a finite domain free-surface without heat transfer.

A nitrogen-ethane-methane mix, approximated from Kraken Mare and having density ρ=664 kg/m3 and dynamic viscosity of μ=1014 µPas (Hartwig et al. 2018) was used, with the additional gravitational acceleration taken to be g=1.35 m/s (Ori et al. 1998).

The liquid is modelled by an SPH, pure Lagrangian method using meshfree particles and serves to efficiently model situations where large boundary deformations are present, or when a free-surface flow needs to be defined. It acts as the most appropriate for free-surface flow and hydrodynamics problems due to the versatility and simple method of numerical analysis and uses interpolation to compute smooth field variables. It is widely accepted that for problems with large deflections or boundary deformations, an SPH method is more appropriate than the alternative meshed method as it avoids problems such as mesh distortion, mesh tangling and inaccurate modelling due to unrealistic mesh interdependence.

These SPH particles were modelled using the Murnaghan equation of state, which defines the pressure in a fluid as:

where

ρ and ρ0 are the local and global densities respectively, γ is a constant defined as approximately 7 according to the conditions and vmax is the maximum observed velocity in the fluid.

A definition of k0 was presented by J. Monaghan and A. Kos (1999) as

where g is the acceleration due to gravity and H is a characteristic simulation length. Taking the characteristic depth of a test tank as 1 m, k0 takes the value of ~1.2x10⁴, compared to a value of  ~1.5x10⁵ for water in the same conditions.

Bulk viscosity controls were placed on the fluid, in the form of the quadratic and linear bulk viscosity coefficients. It was found realistic fluid behaviours were observed with these taking values of 0.015 and the near-zero value of 1x10-12 respectively.

Contact modelling techniques were key in ensuring the accuracy of simulations given the magnitude of the observed boundary deformations. A penalty-based approach to this modelling was taken, where a restoring spring force was applied between the fluid particle and FEM mesh boundary. 

The spacecraft quasi-ellipsoid fuselage impact was approximated by a projectile formed by a rotated NACA 0010 aerofoil. A higher resolution was applied to the nose given the increased curvature, with this resolution and the associated computational power being a limiting factor of the simulation. A mesh sensitivity study was used to find the highest possible nose resolution realistically modelled within the computational limitations of the study.


Figure 2: High SPH resolution, double-precision solved solution with nodes travelling over a specific velocity shown and with attached velocity vectors


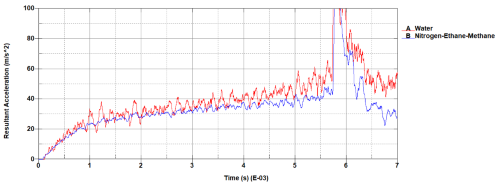
Figure 3: Projectile deceleration due to water and N/C2H6/CH4 mix

The decelerations experienced by this projectile in both liquid water and the nitrogen-ethane-methane mix were observed. These showed little divergence initially, but increased as the projectile penetrated the fluid surface. It could be expected that the comparative viscosities would mean nitrogen-ethane-methane would demonstrate more inertia to deformation. However, the lower density of this fluid can be seen to have a more dominant effect. The spike in experienced acceleration is caused by the reflected shockwave, having interacted with the simulation limits, returning to the projectile. Therefore results after this are discarded.

For interest and fluid understanding, the respective sloshing behaviours of liquid water and nitrogen-ethane-methane were also modelled.


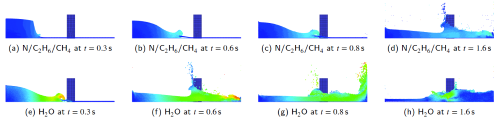
Figure 4: Wave development and FSI of Kraken Mare liquid and Earth water with velocity displayed. Red corresponds to a higher relative velocity.

Acknowledgements

This work is the result of a research project funded by the Royal Academy of Engineering, the Royal Astronomical Society and the British Interplanetary Society.

References

Hartwig, Jason, Peter Meyerhofer, Ralph Lorenz, and Eric Lemmon. 2018. “An Analytical Solubility Model for Nitrogen–Methane–Ethane Ternary Mixtures.” Icarus 299 (January): 175–86. https://doi.org/10.1016/j.icarus.2017.08.003.

J. Monaghan, and A. Kos. 1999. “Solitary Waves On A Cretan Beach.” Journal of Waterway, Port, Coastal and Ocean Engineering 125 (3): 155.

Liang, Jianhong, Xingbang Yang, Tianmiao Wang, Guocai Yao, and Wendi Zhao. 2013. “Design and Experiment of a Bionic Gannet for Plunge-Diving.” Journal of Bionic Engineering 10 (3): 282–91. https://doi.org/10.1016/S1672-6529(13)60224-3.

Ori, Gian Gabriele, Lucia Marinangeli, Antonio Baliva, Mario Bressan, and Robert G. Strom. 1998. “Fluid Dynamics of Liquids on Titans Surface.” Planetary and Space Science 46 (9–10): 1417–21. https://doi.org/10.1016/S0032-0633(97)00125-6.

How to cite: McKevitt, J.: Multiphysics feasibility study of an aerial-aquatic spacecraft’s plunge into Kraken Mare, Europlanet Science Congress 2020, online, 21 Sep–9 Oct 2020, EPSC2020-816, https://doi.org/10.5194/epsc2020-816, 2020.

EPSC2020-618
Alice Le Gall, Léa Bonnefoy, Robin Sultana, Michael Janssen, Ralph Lorenz, and Tetsuya Tokano

At first order, the physical temperature of Titan’s surface can be regarded as nearly constant and predictable. Due to the low incident solar flux reaching its surface (1/1000 of what Earth receives) and the high thermal inertia of its atmosphere, diurnal, seasonal (including latitudinal) and altitudinal variations of temperature are limited as well as the effect of surface albedo (Lorenz et al., 1999). Voyager 1 radio-occultation measurements indeed show no diurnal effect and point to lapse rates in the lower atmosphere smaller than 1.5 K/km (McKay et al 1997). Voyager infrared observations indicate a pole-to-equator temperature contrast of 2-3 K (Flasar et al., 1981; 1998).

The Cassini mission (2004-2017) somewhat confirmed these predictions and first measurements. On board the Cassini spacecraft, two instruments were able to measure the physical temperature of Titan’s surface: the Cassini’s Composite IR Spectrometer (CIRS) through a spectral window of low opacity in the thermal IR and the Cassini radar used as a microwave radiometer. Both instruments monitored the surface brightness temperature at their respective wavelengths (19 microns and 2.2 cm, respectively) during the almost two Titan’s seasons of the Cassini mission. Interestingly, these two instruments probe different depths; the very surface for CIRS and at least several decimeters in the lands for the microwave radiometer (Janssen et al., 2016), much more in the lakes (Mastrogiuseppe et al., 2014). Combining these datasets thus provides insights into the vertical variations of the thermal and physical properties of the surface.

From the analysis of CIRS dataset, Cottini et al. (2012) report a diurnal signal of 1-1.5 K indicative of a thermal inertia of 300-600 MKS while Jennings et al. (2009; 2016) investigate seasonal changes confirming a constant maximum temperature of 93.65 +/- 0.15 K (as measured by the Huygens probe at 10.3°S latitude, Fluchignoni et al., 2005) and a variation of the latitude at which this maximum occurs following the sub-solar latitude (which moved from 24°S to 23°N between 2004 and 2017).  Jennings et al. (2016) also found a 2-4 K equator-to-pole difference and note a delay in the northern warming at the end of the mission, as summer was on its way. This later was interpreted as a cooling effect of both the lakes and the surrounding moist lands as CIRS observations show no difference in the thermal behavior of these two types of terrains (within measurement uncertainty of about 0.5 K).

From the radiometry dataset, Janssen et. (2016) find latitude-dependent seasonal temperature variations smaller than those measured by CIRS by a factor of 0.87 +/- 0.05 in relative amplitude which is consistent with a penetration depth of 40 cm-1 m in organic sands. The difference with CIRS observations is slightly more pronounced in the northern hemisphere likely owing to the presence of lakes and seas in which microwaves penetrate deeper than in dry lands. In the North pole, Le Gall et al. (2016) also report the hint of a slower than expected rise in temperature in the second largest sea of Titan, Ligeia Mare, toward the end of the mission. Any diurnal effect was neglected considering that the radiometer would probe much deeper depths than the diurnal skin depth (Lorenz et al., 2003). 

In this work, in order to investigate further the seasonal variations of Titan’s temperature, we present the analysis of the high-resolution radiometry observations recorded in the northern pole from 2007 to 2017. This analysis demonstrates that the seas warm more slowly than their surrounding lands and are therefore responsible for the global lag in summer warming observed in Titan’s high northern latitudes both by CIRS and the Cassini radiometer. This cooling effect could be due to the high thermal inertia of liquid hydrocarbons, their high transparency (which leads microwaves to sense the coldness buried from last winter, Le Gall et al., 2016) and/or methane evaporation (Mitri et al., 2007).

In addition, we present for the first time the analysis of the 118 distant observations of Titan collected during the course of the Cassini mission. These observations were designed for the computation of the disk-integrated brightness temperature of Titan. Though unresolved, they provide clues on the seasonal and longitudinal variations of Titan’s surface thermal emission. In particular, they clearly show Xanadu, a large-scale low emissivity/radar-bright feature on the leading side of the satellite. The analysis of this dataset reveals a possible diurnal component of amplitude 0.6 K and peaking at 4 pm in Titan’s radar-dark terrains and of amplitude 0.8 K and peaking at 2 pm in Xanadu. Unfortunately, such a signal cannot be isolated in high resolution observations because of the way data are calibrated (Janssen et al., 2016). If confirmed, this detection would bring a further argument for a smaller than expected electrical skin depth (i.e., a more absorptive subsurface) in most of Titan’s equatorial lands and/or a larger diurnal thermal skin depth (i.e. a higher thermal inertia), especially in Titan’s radar-dark dune terrains.

To conclude, monitoring surface temperature brings key insights into the surface properties and its coupling with the atmosphere. Cassini findings provide a global context for the future observations of DraGMet, the geophysics and meteorology package on board the Dragonfly quadcopter (Lorenz et al., 2018) which will investigate the ground thermal properties and record temperature variations in parallel with the atmosphere humidity, the ground moisture and wind speed.


How to cite: Le Gall, A., Bonnefoy, L., Sultana, R., Janssen, M., Lorenz, R., and Tokano, T.: Evidence of diurnal variations of Titan’s near-surface temperature and of a cooling effect of the northern seas from the Cassini radar/radiometer, Europlanet Science Congress 2020, online, 21 Sep–9 Oct 2020, EPSC2020-618, https://doi.org/10.5194/epsc2020-618, 2020.