
Experimental Observations of Jupiter in the Optical Ammonia Band at 645 nm

Abstract
Jupiter’s tropospheric ammonia abundance distribution is measured using a simple filter ratio technique that exploits the 645nm absorption band. The method provides disk-integrated photometric measurements, meridional profiles, and localized feature detection consistent with the literature. The equipment is affordable and could provide a means for routine monitoring of Jovian ammonia and its role in Jovian weather systems.
1. Introduction
Ammonia clouds are responsible for Jupiter’s cloud structure seen in visible light. As a condensable gas, the distribution of ammonia gas is non-uniform and is dependent on vertical and horizontal motions along with sources and sinks. In essence, it is a proxy for weather in the upper troposphere and its distribution is an active area of study [1, 2] (Fig. 1).

This work establishes the efficacy of an optical filter ratio technique by demonstrating: 1) Quantitative measurement of global ammonia [3], 2) Qualitative matching of meridional profiles including the Equatorial Zone (EZ) enhancement [1], and 3) Qualitative matching of smaller scale ammonia features [1, 2].
2. Observations
A 0.28m aperture telescope was used to observe Jupiter with a CMOS lucky-imaging camera for fine detail and a cooled CCD camera for quantitative analysis. A commercially available 647±5nm filter was procured to measure ammonia absorption. Because the absorption signal is weak, the flux at the adjacent 656nm wavelength was measured as a continuum reference. A total of four nights of CMOS observations in July and six nights of CCD observations in September are considered here.
Context images in other spectral bands are important to disambiguate potential contaminating signals. Potential factors that could influence the detection of ammonia include variations in broadband reflectivity, color slope, cloud height (methane optical depth), and aerosol absorption (NUV absorption).
3. Disk-Integrated Photometry
The Galilean moons provide photometric references without NH3 absorption that are used to estimate the continuum flux of Jupiter at 647 nm:

where the subscript m or J designates Jupiter or moons and 647 or 656 designates the filter center wavelength. The NH3 absorption is then:

Between two and four moons were available as references for each CCD observation. The average ammonia absorption found was aNH3 =0.032±0.010, where the uncertainty represents the 95% confidence interval. A correction was then applied for the differences between the Jovian and moons’ known color slopes [4, 5]. Also, Io was eliminated as a photometric reference because it has the most variable color slope with rotational phase. We then find aNH3=0.043±0.011 which is greater by about 10% than the absorption predicted by the curves in Fig. 2. This is well within the confidence interval of ±25%.

4. Meridional Profile
Ratio images (656/647) were mapped onto a cylindrical map projection within 45 degrees of the equator and central meridian. Averages were then computed for each latitude across all the maps. While not photometric, the form of latitude variation can be compared to the literature [1] (Fig. 3).
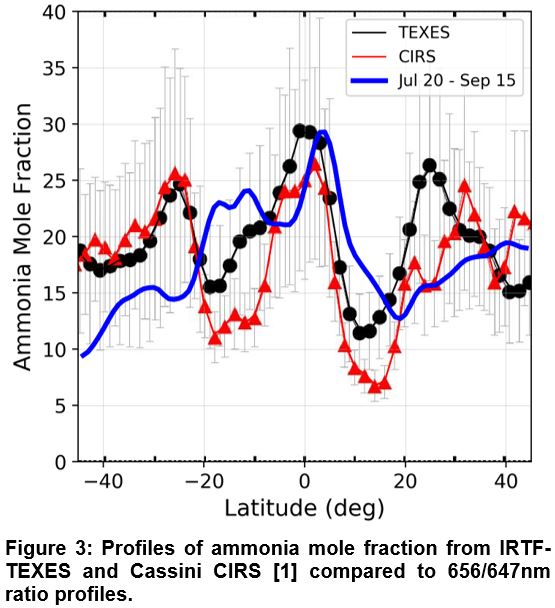
The computed profile represents the uncalibrated line of sight absorption and is scaled to roughly fit the range of the comparison data (mole fraction at a 500 mb) [1]. The computed profile lies mostly within the formal error bars from the 2014 IRTF-TEXES and 2000 Cassini CIRS retrievals. Differences between the filter ratio profile here and the TEXES and CIRS profiles are of similar magnitude as the differences between the TEXES and CIRS data.
5. Discrete Features
An example of CMOS lucky imaging observations is shown in Fig. 4. The panels show relevant context images along with the NH3 distribution map as follows:
- RGB: Color context.
- Reflectivity: Relative brightness in the optical.
- Continuum slope: Red/Green broadband channel ratios. Redder areas are brighter.
- NH3: Ratio of 656/647 images as an index of NH3 Brighter represents more NH3.
- 889nm: Methane channel maps correlate to cloud or aerosol height. Bright areas represent higher clouds.
- 380nm: NUV aerosol absorption images. Brighter areas represent less absorption.
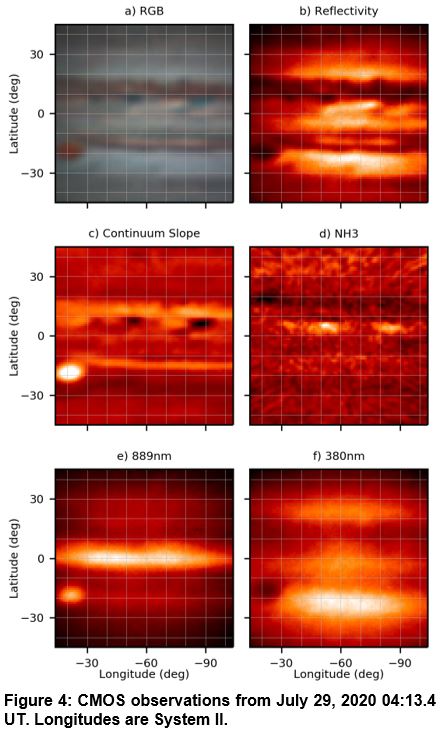
Fig. 4(d) shows patchy enhancement of NH3 in the northern EZ along the southern border of dark features and near bright plumes seen in the context images. The central latitudes of the NH3 enhancements are 4-5 deg north and the dark/blue features seen in panels a-c have centroids that are 6-8 deg north. The imperfect correlation between optical features and ammonia distribution is consistent with recent observations [2]. Longitudinally extended depletion at the northern edge of the NEB and enhancement at the SEB in two faint bands are also seen. The localized NH3 signal measured by the filter ratio technique appears to represent the actual distribution of ammonia, as it is uninfluenced by the notably strong Great Red Spot (GRS) signals seen in brightness, color slope, methane, and NUV maps.
6. Summary and Conclusion
This paper confirms that ammonia distributions on Jupiter can be observed with a simple filter ratio approach. It demonstrates that:
- Disk-integrated NH3 abundance measurements are consistent with predictions using reference spectra [3].
- Meridional NH3 profiles show the major features seen in prior work [1].
- High-resolution imaging shows patchy NH3 enhancement in the EZ consistent with observations in prior work [1, 2].
The technique uses affordable and readily available equipment. It opens the way to regular amateur observations of the ammonia distribution, which would further the understanding of Jupiter’s ammonia cycle.
7. Acknowledgments
I would like to thank Dr. John Rogers for his insightful correspondence.
8. References
[1] Fletcher L. N et al.: Mid-infrared mapping of Jupiter's temperatures, aerosol opacity and chemical distributions with IRTF/TEXES, Icarus, 278, 128-161, 2016
[2] Fletcher L. N. et al.: Jupiter's Equatorial Plumes and Hot Spots: Spectral Mapping from Gemini/TEXES and Juno/MWR, Journal of Geophysical Research (Planets), 125, e06399, 2020
[3] Karkoschka, E.: Spectrophotometry of the jovian planets and Titan at 300- to 1000-nm wavelength: The methane spectrum, Icarus, 111, 174-192, 1994
[4] Ordonez-Etxeberria et al.: Spatial distribution of jovian clouds, hazes and colors from Cassini ISS multi-spectral images, Icarus, 267, 34-50, 2016
[5] Clark R. N. and T. B. McCord: The Galilean satellites - New near-infrared spectral reflectance measurements /0.65-2.5 microns/ and a 0.325-5 micron summary, Icarus, 41, 323-339, 1980
How to cite: Hill, S.: Experimental Observations of Jupiter in the Optical Ammonia Band at 645 nm, European Planetary Science Congress 2021, online, 13–24 Sep 2021, EPSC2021-260, https://doi.org/10.5194/epsc2021-260, 2021.