
Stationary waves in Jupiter’s Equatorial Zone in 2020

- British Astronomical Association, London, UK (jrogers11@btinternet.com)
The visible clouds in Jupiter’s Equatorial Zone (EZ) travel in the great eastward equatorial current, with speeds ranging from ~100-120 m/s in the jets at the north and south edges, to ~70-80 m/s on the equator, relative to System III longitude (L3). No cloud features have ever been reported in the EZ with drift rates close to L3. Therefore, it was a great surprise to observe a system of waves in the EZ in 2020 that were almost fixed in L3.
From 2018 to 2021, the EZ has had a broad band of notable orange colour straddling the equator, this being the most intense and prolonged coloration episode since 1989-91. Amateur images in the 889 nm methane absorption band in 2020 showed that this ochre band was notably bright (“methane-bright”), indicating that its aerosols were relatively dense at high altitude. The stationary waves were observed on its southern boundary at ~3ºS.
These waves were meridional undulations with a wavelength of about 20º. They were first noticed in May in a restricted sector, L3 ~ 160-240 (Figure 1). They were most evident in the high-quality methane images by co-author C. Go, but also detectable in images by other observers.
When plotted in System I, the wave-train as a whole, and the individual waves, were obviously moving very rapidly, whereas plotting in System III showed that they were essentially stationary: mean drift rate = +1 (±2) deg/month. A similar wave-train was still present in the same L3 range in late July. These waves were likewise near-stationary in System III, not System I (Figure 2), despite some variation in their appearance.
Similar waves could be seen in some methane images as far back as 2020 Feb. This same boundary was present in methane images in summer 2019 but without such prominent wave structure.
In some places the N edge of the methane-bright strip also had waves parallel to those on the S edge (although less distinct), so the whole strip was undulating. The waves were not visible in RGB images (Figure 1). They lay along the interface between the ochre EB and the white EZ(S), which involved small-scale mixtures of streaks; blue-grey streaks sometimes coincided with the waves but sometimes not.
Discussion
Strong eastward jets separate these near-equatorial waves from all known stationary visible features, and there are no such features in neighbouring latitudes that seem likely to have been forcing these waves. The SEB was all quiet along here; the GRS was on the opposite side of the planet; and the ovals in northern NEB were in the same longitude sector, but not aligned with the EZ waves. The northern NEB is sometimes overlaid with methane-dark thermal waves [Refs.1 & 2], and such waves did appear in this sector in 2020, but only from mid-May to mid-June, and not adjacent to the EZ waves, so they appear to be unconnected.
System III is the reference frame of Jupiter’s magnetic field, and Juno discovered an anomalous ‘magnetic pole’ that maps to the southern EZ [Ref.3], but it is near L3=90, far away from our waves.
It is conceivable that aerosols from the methane-bright EB extend to a very high altitude where the equatorial jets decay to almost zero wind speed. Concurrent professional infrared observations could test this hypothesis, while modelling, or further refinement of Juno magnetic maps, might give some clue as to the nature of these remarkable waves. At the time of writing in 2021 May, we see a similar near-stationary wave pattern linked to a slow-moving methane-bright feature that extends right across the EZ.
Acknowledgements
We are grateful to all the amateur observers who contributed methane-band images during 2020; the relevant observations are in the BAA Jupiter Section reports no.4 & 5 at: https://britastro.org/node/20872.
References
- Rogers JH, Akutsu T, & Orton GS (2004) J.Brit.Astron.Assoc. 114, 313-330.
- Fletcher LN et al.(2017) Geophys. Res. Lett. 44, 7140-7148.
- Connerney JEP et al. (2018) Geophys.Res.Lett. 45, 2590-2596.
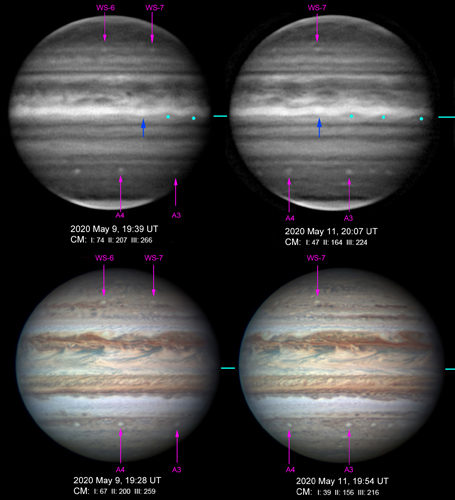
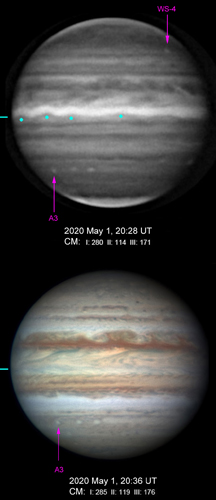
Figure 1. Top: A set of methane-band images showing the waves (marked by cyan dots). Dark blue arrow indicates a bright patch on the equator that moves with System I. Some long-lived ovals in temperate regions serve as reference points. Bottom: Corresponding RGB images. All images by C. Go.


Figure 2. Charts of longitude (L3) vs time for the wave crests: (left) in 2020 May-June, (right) in July. In May, four waves are numbered and lie close to lines of constant L3. In July, two waves are indicated by lines connecting points. Vertical lines represent longer wave crests. Purple crosses are methane-bright patches on the equator moving with System I, which provide an internal control for the measurements. Uncertainties are ~±3°.
How to cite: Rogers, J. and Go, C.: Stationary waves in Jupiter’s Equatorial Zone in 2020 , European Planetary Science Congress 2021, online, 13–24 Sep 2021, EPSC2021-95, https://doi.org/10.5194/epsc2021-95, 2021.