
 1,4,
1,4,- 1Lunar & Planetary Insititute, Houston, TX, United States of America (schenk@lpi.usra.edu)
- 2Jet Propulsion Last, Pasadena, CA
- 3Planetary Science Institute, Tucson, AZ
- 4Washington University in Saint Louis, Saint Louis, MO
- 5Lunar and Planetary Lab, Tucson, AZ
- 6University of California and Santa Cruz, Santa Cruz, CA
- 7SETI Institute, Palo Alto, CA
- 1. Introduction
Tethys is unusual among icy moons for its low bulk mean density of 0.985 g/cm3, suggesting a low rock mass fraction and/or high porosity. Like other mid-sized icy satellites Tethys has an intense fracture history [1], including Ithaca Chasma as well as several hundred arcuate andlinear troughs, grooves, and cracks. Unique to Tethys, however, are dark reddish linear features visible to Cassini under high solar illumination conditions (a lower albedo and flatter spectral signature in the green–IR range; Figs. 1, 2). Our CDAP-funded research is focused on mapping these features and testing hypotheses for their formation and implications for Tethys’ evolution

Figure 1: Color view of Tethys showing IR lineations (reddish arcs). Cassini IR3, green, UV3 image composite.

Figure 2: Preliminary spectral plot showing IR lineaments (red) and adjacent cratered plains (green) from ISS images.
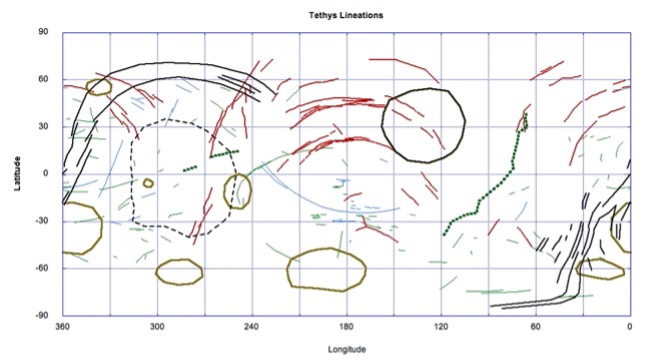
Figure 3: Global map of fractures, ridges, and lineations on Tethys. IR lineations are shown in red. Odysseus is large circle at upper center.
1.1 IR-Lineations
There are at least three prominent sets in the northern anti-Saturn hemisphere, centered on the anti-Saturn meridian (Fig. 3). Each setconsists of ~5–10 parallel lineations a few kilometers across and 50–250 km long. The lineations are remarkably curvilinear (i.e., non-sinuous), do not follow great circles, and are not deflected by major impact structures: they cross the floor of the 400-km-diameter, 9-km-deep Odysseus impact basin as if it were not there.
Although more poorly observed, sub-Saturn hemispheric color imaging at low-phase angle clearly shows a similar set of arcuate, reddishlineations on that hemisphere, despite deposition of E-ring dust particles from Enceladus [2] indicating that these features are being renewed on some time-scale.
The red lineaments centered near ~25° N, 175°E were imaged at high resolution. Mapping at ~90–125 m/pixel (Fig. 4) (together with stereo andlower resolution color imaging) shows no discrete scarp, ridge, or other tectonic manifestation along the ~100 km portion of the feature soimaged. Only a faint discoloration of the surface has been identified (Fig. 5). Further, >20 dark spots 200–800 m in diameter lie along this setof lineaments. These spots are characterized by very low albedos, sharp boundaries, and no evidence of raised rims consistent with an impactorigin. Of these, >60% are situated at the bottom of impact craters.

Figure 4: High-resolution, 90 m/pixel mosaic of IR lineaments, merged with IR3–Gr–UV3 color mosaic.

Figure 5: Enlargement of high-resolution view in Figure 4 showing reddish lineament (red arrows) and small dark spots (blue arrows).
Red streaks centered at 45° N, 333°E were targeted for high resolution ISS and VIMS observations in late 2015 (although the VIMS cubes were partially corrupted). As at the above site no discrete faults, scarps or grooves was resolved here despite pixel scales as good as ~60 m.
- 2. Origin of IR-Lineaments
The spatial pattern of IR lineaments on Tethys shows a strong symmetry (Fig. 3), centered on the current tidal axis with Saturn. A lack ofcorrelation with local geology might suggest an exogenic origin. Conversely, there are no rayed craters at the radial centers of these features.Further, the locations of the patterns on both the sub- and anti-Saturn hemispheres, and the lineaments’ parallel orientations, argue against adisrupted comet origin (à la SL9). The lineaments have no systematic orientation relative to Odysseus, indicating that stresses arising fromthe relaxation of that basin [3] are not responsible for these features.
Global stresses might have produced the pattern we observe. The IR lineaments may match patterns of strain predicted to result from a non-synchronous rotation stress state, although this is unlikely for a cold, triaxial body like Tethys. The best-fit patterns correspond to a combination of global expansion with true polar wander or tidal axis reorientation (Fig. 6a, b). The misfit for global expansion combined recession is significantly larger (Fig. 6c). The dramatic lack of such features in the southern hemisphere (Fig. 3), where only a few short isolated red streaks are evident, is not explained by any currently considered stress regime.
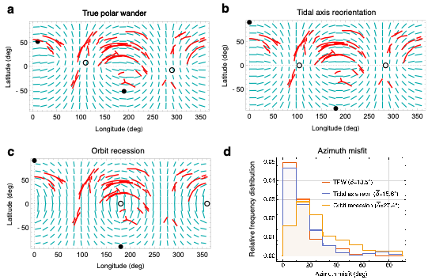
Figure 6: (a-c) Observed (red) and predicted (green) tectonic patterns due to combination of global expansion with (a) true polar wander, (b) tidal axis reorientation, (c) orbit recession. Solid and open circles indicate location of initial rotation and tidal axes. (d) Relative frequency distribution of misfit between observed and predicted fault segment azimuths for processes in panels a-c. Labels show mean misfit for each model.
The lack of obvious tectonic deformation despite the strong color signature is unusual (although features may exist below the currentresolution limit). The lineaments could be reactivated ancient fractures, producing a temporal discoloration. At present there is no topographic or morphologic signature to support this. If tectonic, the lineaments might be still forming, with deformation only on a scale below that which we can resolve.
The dark and reddish coloration could be due to a particulate contaminant in the ice grains that is more spectrally visible if the grain sizes are larger along the streaks. Alternatively, a dark reddish contaminant has been deposited on the surface along the streaks. Such a contaminant could be due to precipitation of a distinct material along unresolved surface or near-surface fractures, with subsequent mixing of contaminant into the local regolith. VIMS spectral cubes are being reprocessed to verify whether organic rich materials may be involved. Low-volume but persistentoutgassing and emplacement of volatiles from the interior (possibly due to clathrate decomposition associated with fracture formation) thecolors of which are distinct from the evolved surface and/or result from alteration due to exposure to the space environment, may be responsible.
The coloration of Tethys unique red streaks, and collocated dark spots, are consistent with active alteration of the surface, given that E-ringaccumulation is expected to remove intrinsic color signatures in a geologically short time period. Differences in particle sizes of the outgassed material may add to this spectral distinctiveness.
How to cite: Schenk, P., Buratti, B., Clark, R., Byrne, P., McKinnon, W., Matsuyama, I., Nimmo, F., and Scipioni, F.: Red Streaks on Tethys: Evidence for Recent Activity, Europlanet Science Congress 2022, Granada, Spain, 18–23 Sep 2022, EPSC2022-732, https://doi.org/10.5194/epsc2022-732, 2022.