
Reflectance and Raman spectroscopy of anhydrous carbonates for their identification at the surface of planetary bodies.
 1,
1,- 1CNRS / Univ. Grenoble Alpes, Institut de Planétologie et Astrophysique de Grenoble, Grenoble Cedex 9, France (bernard.schmitt@univ-grenoble-alpes.fr)
- 2Univ. Paris Saclay, CNRS, IAS, Orsay, France
- 3Univ. Grenoble Alpes, CNRS, ISTerre, 38000 Grenoble, France
Introduction
Carbonate minerals are ubiquitous on Earth, on all terrestrial planets and on many satellites and small bodies, in particular asteroids. These minerals are identified through remote sensing using either visible and near infrared reflectance spectroscopy but also since recently Raman spectroscopy. These techniques, as well as mid-infrared spectroscopy, are also very frequently used in the laboratory to identify the various anhydrous, hydroxylated and hydrated carbonates phases.
In this talk we first report on an extensive ongoing experimental study of all types of carbonates by Visible, near and mir infrared and Raman spectroscopy of series of natural and synthetic samples, coupled with DRX and EPMA analysis to determine their mineralogical purity and their effective composition. We will focus here on the anhydrous calcite and dolomite groups including most of the rhombohedral carbonates.
In the second part we report on the detailed analysis of their spectra in order to finely determine the band positions, width and intensity of the bands as a function of composition (Ca, Mg. Fe, …). We also provide a vibration mode attribution to all the bands. Coupled with an exhaustive compilation and a critical review of the literature on the spectroscopic properties of these carbonates, this allows us to build accurate band list data to be ingested in the new band list database of the SSHADE database infrastructure (www.sshade.eu). These absorption and Raman spectral information for individual minerals as well as for solid solutions (e.g. the magnesite-siderite solid solution) are invaluable for the community, and are a type of information still critically missing to easily interpret laboratory, field or astronomical spectra.
Carbonate samples
A large set of samples (over 100) covering the anhydrous calcite and dolomite groups and including most of the rhombohedral carbonates (calcite, dolomite, ankerite, magnesite, siderite, rhodochrosite, smithsonite, sphaerocobaltite, kutnohorite, otavite and gaspeite) has been collected for this study. Most of the samples are of natural origin with a variety of composition, but a few pure minerals have been synthesized at ISTerre laboratory to complete the set, especially some hard-to-find natural end-members. They come from various sources, from the OSUG collection, from dealers and local collectors as well as from personal field collection in the mountain ranges around Grenoble. For the reflectance spectra part of the mineral have been grinded and sieved to either <25 µm, <50 µm or 50-100 µm size fractions. Selected grains (~1 mm) of each minerals have been also embedded in *** pellets and polished for EPMA and Raman measurements.
Spectroscopic experiments
Four series of spectroscopic experiments have been performed on various spectrometers.
- Raman emission microspectroscopy at a spatial scale of 1 micron were recorded on raw minerals, but also on selected grains embedded in pellets. We used 2 different instruments located at ENS-Lyon or ISTerre-Grenoble laboratories. Most spectra have been recorded with 1 cm-1 resolution over the 50-1800 cm-1
- Visible and near-infrared reflectance spectroscopy of raw mineral surfaces and mineral powders (mostly <25 µm and 25-100 µm fractions) in the range 400-4650 using our SHINE spectro-gonio radiometer. Measurements have been performed in standard geometry (nadir incidence, 30° observation) with a spectral sampling of 4 to 8 nm above.
- Mid-infrared reflectance spectroscopy of mineral powders (mostly the <25 µm fraction) in the range 500-7000 cm-1 using our FTIR Brucker 70 spectrometer equipped with a bidirectional attachment. Measurements have been performed in standard geometry at 1 cm-1 spectral resolution. The spot size is about 4 mm.
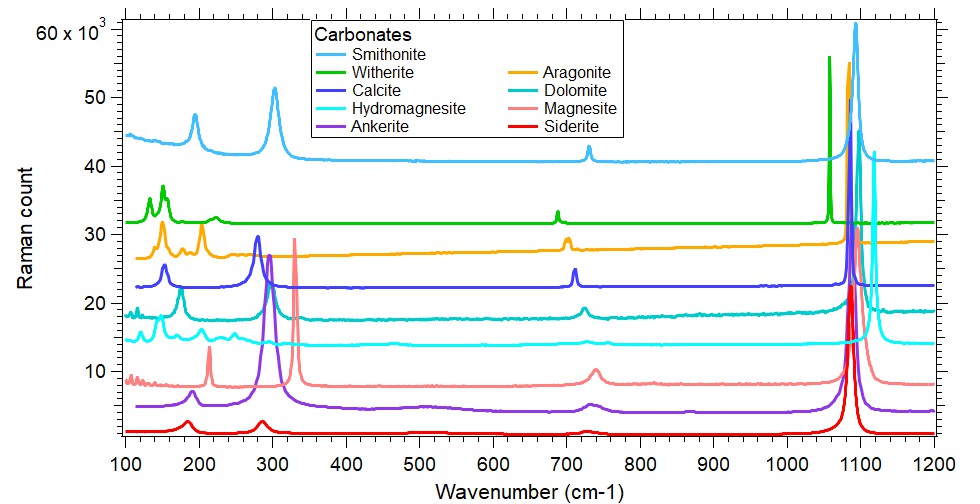
Figure 1: Raman spectra of a selection of anhydrous carbonates
Spectroscopic analysis
The analysis of the data mostly consisted in the measurement of the position (using peak fitting), width and intensity of all the observed emission or absorption bands. These parameters are then plotted one again each other to find the pairs which discriminate most efficiently between the different minerals. These band parameters are also plotted with the concentration of the different elements (Mg, Fe, Ca…) in order to determine which one may be a good proxy to determine accurately the composition of intermediate constituents in solid solutions.
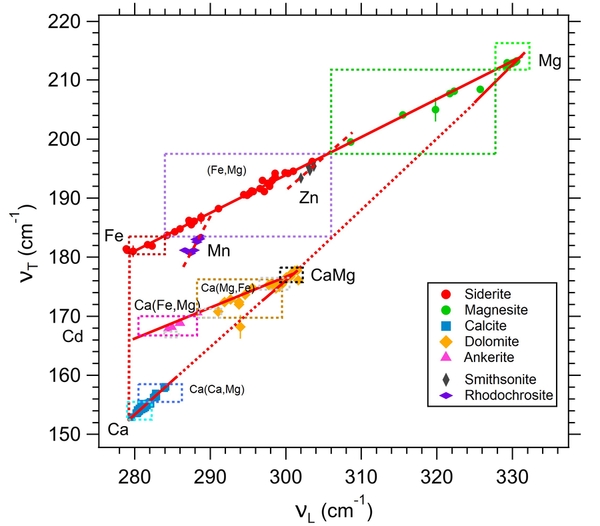
Figure 2: Example of correlation between the positions of two Raman bands (υTand υL) of different Ca-Mg-Fe-Mn-Zn carbonates.
Bandlist
An exhaustive compilation and a critical review of all the literature describing the infrared absorption and Raman emission spectroscopic properties of these carbonates has been performed. It has been complemented by our measurements to determine the range of values spanned by the position, width and intensity of all bands of all these carbonates. These IR absorption and Raman emission datasets have then been complemented with metadata on the mineral composition and are now partly ingested in the band list database of the SSHADE infrastructure. The corresponding spectra are also available in the spectral databases of SSHADE. A carbonate band list or one of its IR or Raman band can be searched using the tools and the various filters provided by the SSHADE search interface.
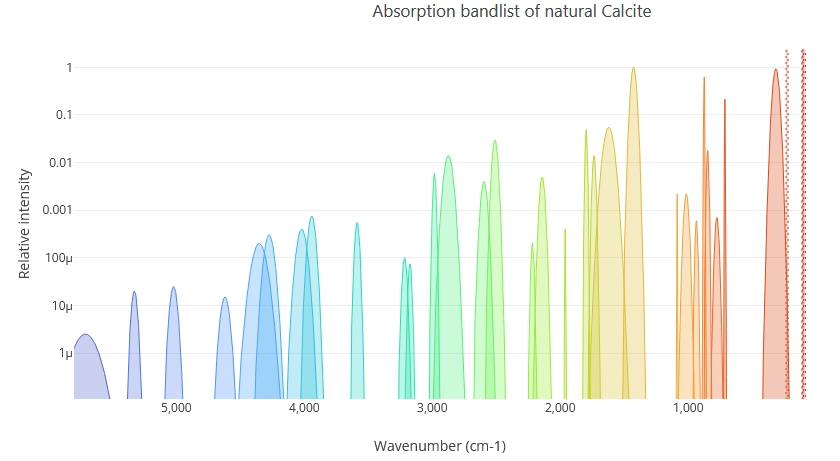
Figure 3: The absorption band list of Calcite
Conclusion
This band list database fed with critical literature review complemented by laboratory measurements should become a key tool for astronomers and planetary scientists to identify unknown absorption bands observed in the spectra of the surface or atmosphere of many astrophysical and solar system objects. Once the best candidate solid found by the user, the tool will link to the most relevant spectral datasets present in the SSHADE databases. These data can then be used for direct comparison with observations, or to model them through radiative transfer codes.
Acknowledgements
We would like to thanks several local collectors who donated samples for this study, and the curator of the OSUG collection. The Europlanet 2024 Research Infrastructure project received funding from the European Union's Horizon 2020 research and innovation programme under grant agreement No 871149. We also acknowledge OSUG, and INSU for additional financial supports.
How to cite: Schmitt, B., Beck, P., Mandon, L., Leclef, A., Teixeira, F., Lanson, M., and Montes-Hernandez, G.: Reflectance and Raman spectroscopy of anhydrous carbonates for their identification at the surface of planetary bodies., Europlanet Science Congress 2024, Berlin, Germany, 8–13 Sep 2024, EPSC2024-1124, https://doi.org/10.5194/epsc2024-1124, 2024.