
 1,1,2,3,
- 1Charles University, Faculty of Mathematics and Physics, Prague, Czechia (soucek@karel.troja.mff.cuni.cz)
- 2Charles University, Faculty of Science, Prague, Czechia
- 3CNRS - Nantes Université, Laboratoire de planétologie et géosciences, Nantes, France
Introduction
After the detection of a remarkable jet activity above Enceladus' south-polar region [1], Cassini utilized flybys for a unique sampling opportunity, confirming the presence of a subsurface water ocean and pointing at the enormous astrobiological potential of the moon [2]. Understanding the plume activity and its relationship to internal processes has since become a task of primary scientific interest. The observed brightness variations in the plume [3] indicate their tidal origin, but the existence and timing of two activity peaks during the tidal period appear to contradict stress analysis predictions. Numerical models of deformation at the faults or localized hydraulic and thermodynamic processes within the fault system have so far failed to provide a comprehensive explanation of the temporal pattern in the observed plume activity.
Data & Model
As input, we employ the plume brightness dataset representing the ice particle content published by Ingersoll and coworkers [3], who identified several tens of groups based on the days of data acquisition. We process the data by removing the long-period variability using a template constructed from a selected subset of measurements with maximal coverage over the tidal period (Fig. 2, a).
In this study, we provide a synthesis and extension of some of these previous approaches and combine a 3D global model of tidal deformation of the fractured ice shell [4] with a 1D local model of transport processes within south-polar faults that involves dynamic motion of the water column induced by tides and shell deformation (inspired by [5]), and vapour transport within the fissures (inspired by [6]), combining two independent vapour transport mechanisms: slip-controlled jet flow and normal-stress-controlled ambient flow (Fig. 1).
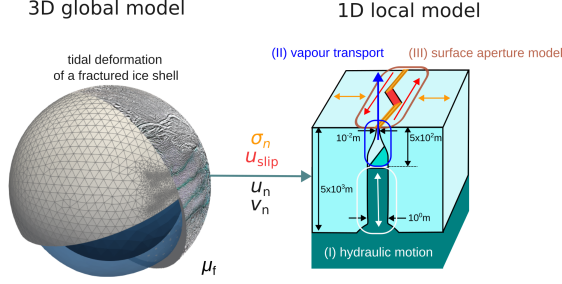
Figure 1: Our model for diurnal fluctuations in activity comprises both global and local components. The 3D global model (depicted on the left) delivers the tidal deformation of an ice shell with fractures, incorporating realistic variations in thickness [7] and fault surface geometry based on [8]. Kinematic and dynamic quantities are averaged along faults and across the shell's depth, serving as input for the local model. The local 1D model (shown in panel b) integrates models for liquid water hydraulic motion (I, depicted in white), vapour and solid grain transport above the water table (II, illustrated in blue), and a near-surface aperture model (III, depicted in brown) comprising two mechanisms: slip-controlled mechanism corresponding to macroscopic jet flow (panel c) and a normal-stress-controlled mechanism corresponding to ambient (more diffuse) vapour flow (panel d). The main controlling parameters in the model are also indicated: the effective friction at faults (µf), initial slip at faults (u0slip), the effective Young’s modulus of the fault zones (Eeff), and the activity scaling factors for the two mechanisms (A0u and A0σ).
Results
Our physical model involves 5 parameters that are identified in a Bayesian Monte-Carlo Markov chain fitting procedure to the activity data: effective friction coefficient and initial slip at the faults, effective Young modulus of the fault zone material, and two amplitudes of the vapour transport mechanisms (slip controlled and normal-stress controlled one). The model successfully predicts the main features of the observed plume’s temporal variability: the two-peak activity curve with a main maximum located at MA≈200˚ and a less pronounced local maximum at MA≈50˚. The model allows us to explain the relative amplitudes of the two peaks and captures the activity ramp between the two maxima (Fig. 3).
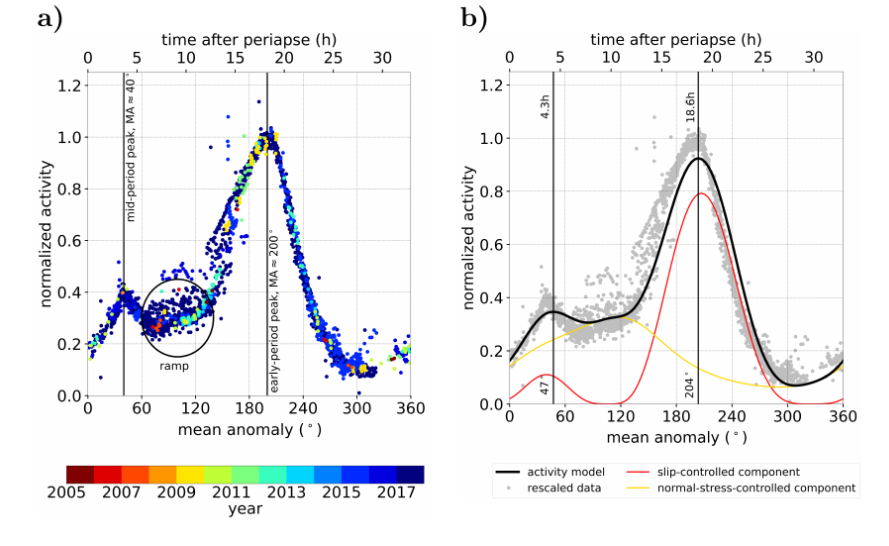
Figure 2: panel a: The diurnal variations of Enceladus’ plume activity, with filtering applied to remove longer-term trends. The symbols denote data sets corresponding to measurements acquired within a single observational day, with colour-coded representation indicating the respective years of data collection. The main activity curve characteristics are the dual peaks (at approximately MA≈40˚ and MA≈200˚) alongside a discernible ramp (occurring around MA≈80−140˚). In the top panel, we present, for comparative analysis, the temporal evolution of normal stress (depicted in gold) and horizontal slip (illustrated in red), computed by a 3d model of tidal deformation of Enceladus’ fault with frictional faults [4]. The temporal alignment of peaks and troughs in horizontal slip with the occurrence of early and mid-period plume peaks is apparent, whereas maximal tensile stress coincides with the observed ramp in plume activity positioned between the activity peaks.
panel b: The activity model's prediction (illustrated by the black solid line) compared to the rescaled data depicted in Figure 1 (shown here as grey symbols) provides insight into the intricate "plumbing system" of Enceladus. The activity signal comprises both primary slip-controlled (depicted by the red dashed line) and secondary normal-stress-controlled components (illustrated by the gold dash-dotted line). The former accounts for the two peaks occurring around 40-50 MA and 200 MA, while the latter explains the ramp observed around 80-140◦ and the subsequent increase in activity beyond 300 MA.
In addition, the model provides a possible explanation for the differences between the vapour and solid emission rates during the diurnal cycle and the observed fractionation of the various icy particle families. Our model prediction could be tested by future JWST observations targeted when Enceladus is at different positions on its orbit and could be used to determine the optimal strategy for plume material sampling by future space missions.
Acknowledgements
This research was supported by the Czech Science Foundation (project no. 22-20388S).
References
[1] Porco et al. (2006). Science 311, 1393-1401. doi:10.1126/science.1123013
[2] Waite et al. (2009), Nature 460, 487-490, doi:10.1038/nature08153
[3] Ingersoll et al. (2020), Icarus 344, 113345, doi:10.1016/j.icarus.2019.06.006
[4] Pleiner Sládková et al. (2021), GRL 48, e2021GL094849. doi:10.1029/2021GL094849
[5] Kite & Rubin (2016), PNAS 113, 3972-3975, doi: 10.1073/pnas.1520507113
[6] Nakajima & Ingersoll (2016), Icarus 272, 309-318, doi: 10.1016/j.icarus.2016.02.027
[7] Čadek et al. (2019), Icarus 319, 476-484, doi: 10.1016/j.icarus.2018.10.003
[8] Porco et al. (2014), AJ 148, 45, doi: 10.1088/0004-6256/631148/3/45
How to cite: Souček, O., Běhounková, M., Lanzendörfer, M., Tobie, G., and Choblet, G.: Variations in Enceladus’ plume activity explained through the dynamics of water-filled faults on Enceladus, Europlanet Science Congress 2024, Berlin, Germany, 8–13 Sep 2024, EPSC2024-167, https://doi.org/10.5194/epsc2024-167, 2024.