Instrument Transfer Function of RIME aboard JUICE
- 1TU Dresden, Chair of Radio Frequency and Photonics Engineering, Dresden, Germany (ronny.hahnel@tu-dresden.de)
- 2University of Trento, Trento, Italy
1. Introduction
The subsurface-radar RIME operates at a center frequency of 9 MHz with a bandwidth of 3 MHz. Due to the relatively low frequency range, RIME is capable to penetrate the surface up to a depth of about 9 km with a maximum vertical resolution of 30 m. The 16.6 m long RIME dipole antenna consists of two 8.3 m long
rods, each fed by a 50 Ω coaxial cable. Both coaxial cables are connected to a matching network in order to achieve the required bandwidth. The definition of the solar panel angle is shown in Fig. 1. As already mentioned, an antenna simulator was built to simulate the properties of the radar system on earth. This should provide the same behavior as the real antenna system in the Jovian system.
The goal is to estimate the distortion of the ideal chirp signal by the instrument itself, because the level of distortion influences the performance of the radar system. Therefore, the calculation of the instrument transfer function from available measurements of TX- and RX-path was performed, which were done in time domain. Difference between antenna simulator and real
antenna system can be calculated and a calibration of the antenna simulator is possible. This is necessary because the AS only approximates the behavior.
The AS consists of the matching network (CMN),the terminal matching networks (TMN), the dummy loads (DL) and the combiner (CMB). Due to the low
center frequency of 9 MHz, the behavior of the antenna can only be integrated using simulation results, because there are no measurements. This is based on the assumption that the simulation results reproduce the real behavior of the antenna with negligible deviations.
However, measurement results are available for all other components. The CMN, TMN and the DL were measured in the entire frequency range and and
in the temperature range of −67 °C to 80 °C. The transmission characteristics were determined separately for the TX- and RX-path with the original flight electronics of the radar system and the AS. The setup for the TX-path is shown in Fig. 2, the RX-path is shown in Fig. 3.
2. Measurements
To determine the load-dependent behavior, it is necessary to de-embed the AS in the corresponding path. This allows the frequency-dependent behavior of the antenna system to be taken into account in the simulations. It is assumed that an ideal chirp signal is fed in. With this assumption, the transfer functions can be calculated for the power amplifier (PA) and the Receiver and Digital Subsystem (RDS), as shown in Eqs. 1 and 2, because HAS(f) is known. Eq. 3 shows the transfer function for the antenna system Hant(f). It contains the properties of the antenna itself as well as the coaxial cables and electronic components. Gsys(f) is thesystem gain of the antenna in nadir direction including all effects of the antenna, the matching network and cables. Theoretically, there are two reference functions, one for Eϑ- and one for Eφ-component of the dipole antenna. However, the Eφ-component of the dipole is
negligible, because it is at least 40 dB lower than Eϑ. The reference function Href (f) is shown in Eq. 4. It takes into account the characteristics of the PA in the
TX-path and the Receiver and RDS in the RX-path as well as the antenna characteristics.
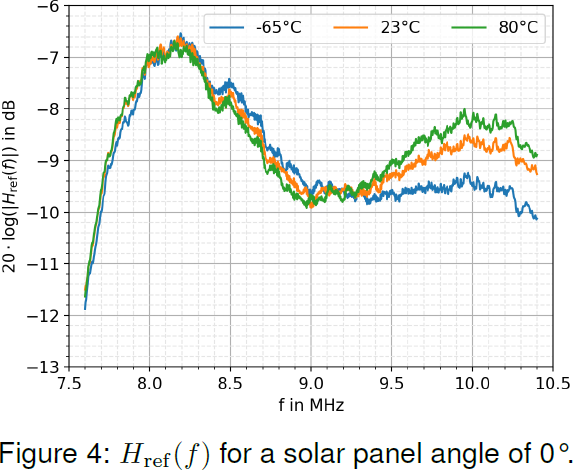
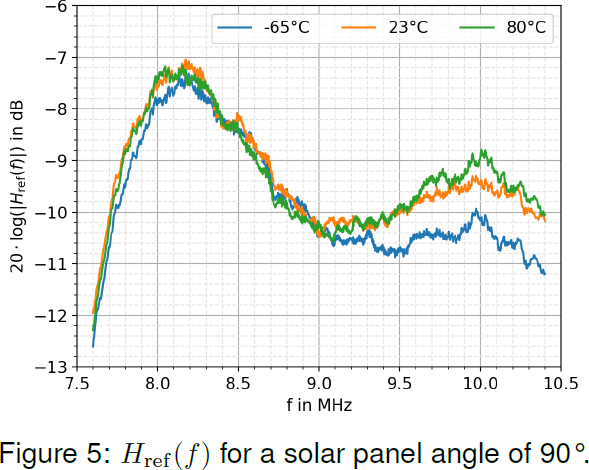
Fig. 4 and 5 show the instrument transfer functions based on measurements for the entire frequency range and various temperatures. Fig. 4 shows the result for a solar panel angle of 0°, i.e. the coupling between S/C
and SP is the lowest. The case of the strongest coupling for an angle of 90° is shown in Fig. 5. It can be seen that the highest losses occur in the lower and upper frequency range. A strong frequency dependence can also be seen. Due to the lower coupling, the losses for a solar panel angle of 0° are lower than for 90°.


3. Summary and Conclusions
The highest attenuation occurs at the lower and upper frequency limits. The lowest attenuation is achieved for a solar panel angle of 0° at 8.2 MHz, due to lowest coupling between antenna and SP. It can be seen that the temperature dependence is negligible at frequencies below 9 MHz. In the frequency range above 9 MHz the attenuation increases with lower temperature. During JUICE’s Earth flyby in August 2024, a comparison
will be made between the real and the simulated signal. This makes it possible to verify how well the real behavior is reproduced.
Acknowledgement
The research on the RIME experiment is supported by funding of the Deutsches Zentrum für Luft- und Raumfahrt (DLR). This research was funded by Bundesministerium für Wirtschaft und Energie under Contract 50 QJ 2302.
How to cite: Hahnel, R., Plettemeier, D., and Bruzzone, L.: Instrument Transfer Function of RIME aboard JUICE, Europlanet Science Congress 2024, Berlin, Germany, 8–13 Sep 2024, EPSC2024-360, https://doi.org/10.5194/epsc2024-360, 2024.