The Asteroid Detection Polar and ESA’s Synodic Orbit Visualisation Tool
- 1ESA/ESOC, Planetary Defence Office, Darmstadt, Germany (juan-luis.cano@esa.int)
- 2ESA/ESRIN, Planetary Defence Office, NEO Coordination Centre, Frascati, Italy
- 3RHEA Systems, Frascati, Italy
- 4ESA/ESAC, Planetary Defence Office, Villanueva de la Cañada, Spain
- 5GMV, Tres Cantos, Spain
- 6Department of Medical Physics and Acoustics, Carl von Ossietzky University, Oldenburg, Germany
Asteroid observability from the ground depends on the object distance to the Sun and to the observer, on the object’s Sun-Earth phase angle, on the object shape and on its surface reflectivity properties. Additionally, several magnitude systems have been proposed in the last decades to model the visual magnitude of the object based on the mentioned parameters, as for example the H, G system, the H, G1, G2 system or the H, G12system. Independently of the magnitude system used, there is a three-dimensional representation of the geometrical locus of equal visual magnitude when this value is constrained, which we have called the detection polar. We analyse the shape of this geometrical locus for the H, G magnitude system and its applicability to the representation of the detectability of an asteroid in its trajectory. We also present ESA's Synodic Orbit Visualisation Tool and provide examples of its use to analyse the graphical representation of a NEO trajectory and the observability region for a given limiting visual magnitude defined by the detection polar.
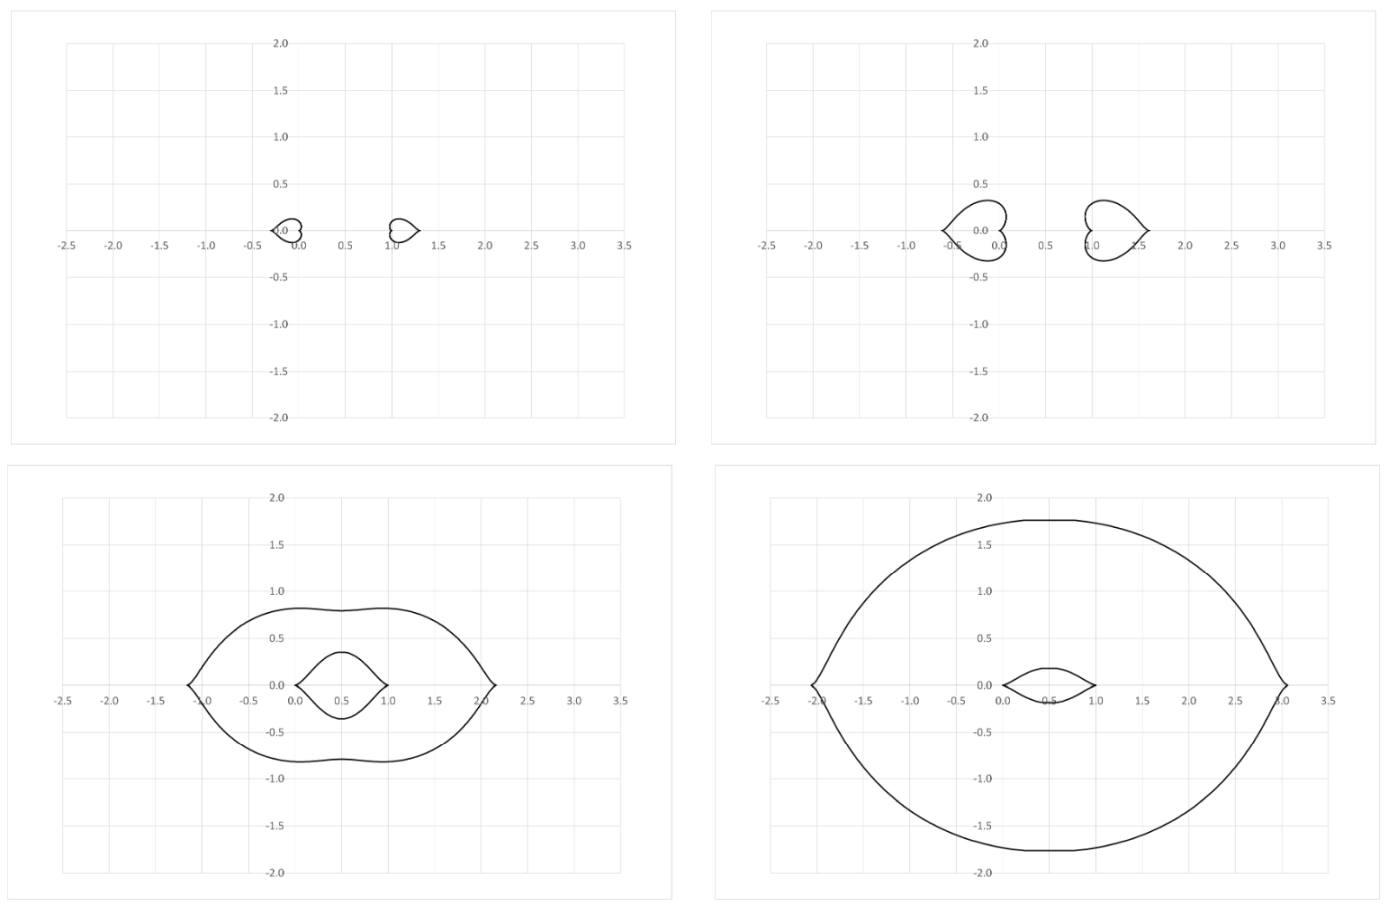
Given the H, G magnitude system and a limiting visual magnitude Vlim the detection polar computation results from the intersection of two families of curves. The first set of curves is given by the phase angles, having the Sun and the observer as focal points and resulting in arcs of circumference passing by both focuses. The second family of curves is derived from constant values of the distance product from the asteroid to the two focuses as derived from the H, G system equation. These are represented by the so-called Cassini ovals. Defining the relative magnitude B as Vlim-H, the results of the intersections of both families are a new set of curves for varying values of the parameter B (see Figure 1, which assumes G = 0.15). Starting with B = -2 mag we observe two heart-like solutions located at each of the focal points with the shape tip pointing in the direction of the opposition effect. As the value of the relative magnitude grows the shapes size increases accordingly. When B reaches a value of 1.6685 mag (not represented in the figure) the two shapes make contact and they transform into two other shapes; an external one that keeps growing and an internal one that joins the two focal points and that decreases in size as the relative magnitude grows. The detectability region is described by the area between both shapes. At this point, no visibility constraints other than the mentioned magnitude system have been considered in the plots. However, it is expected that the derived solution close to the Sun will be affected by a low solar elongation as seen from the Earth, thus limiting the possibilities of observing that part of the detection polar.
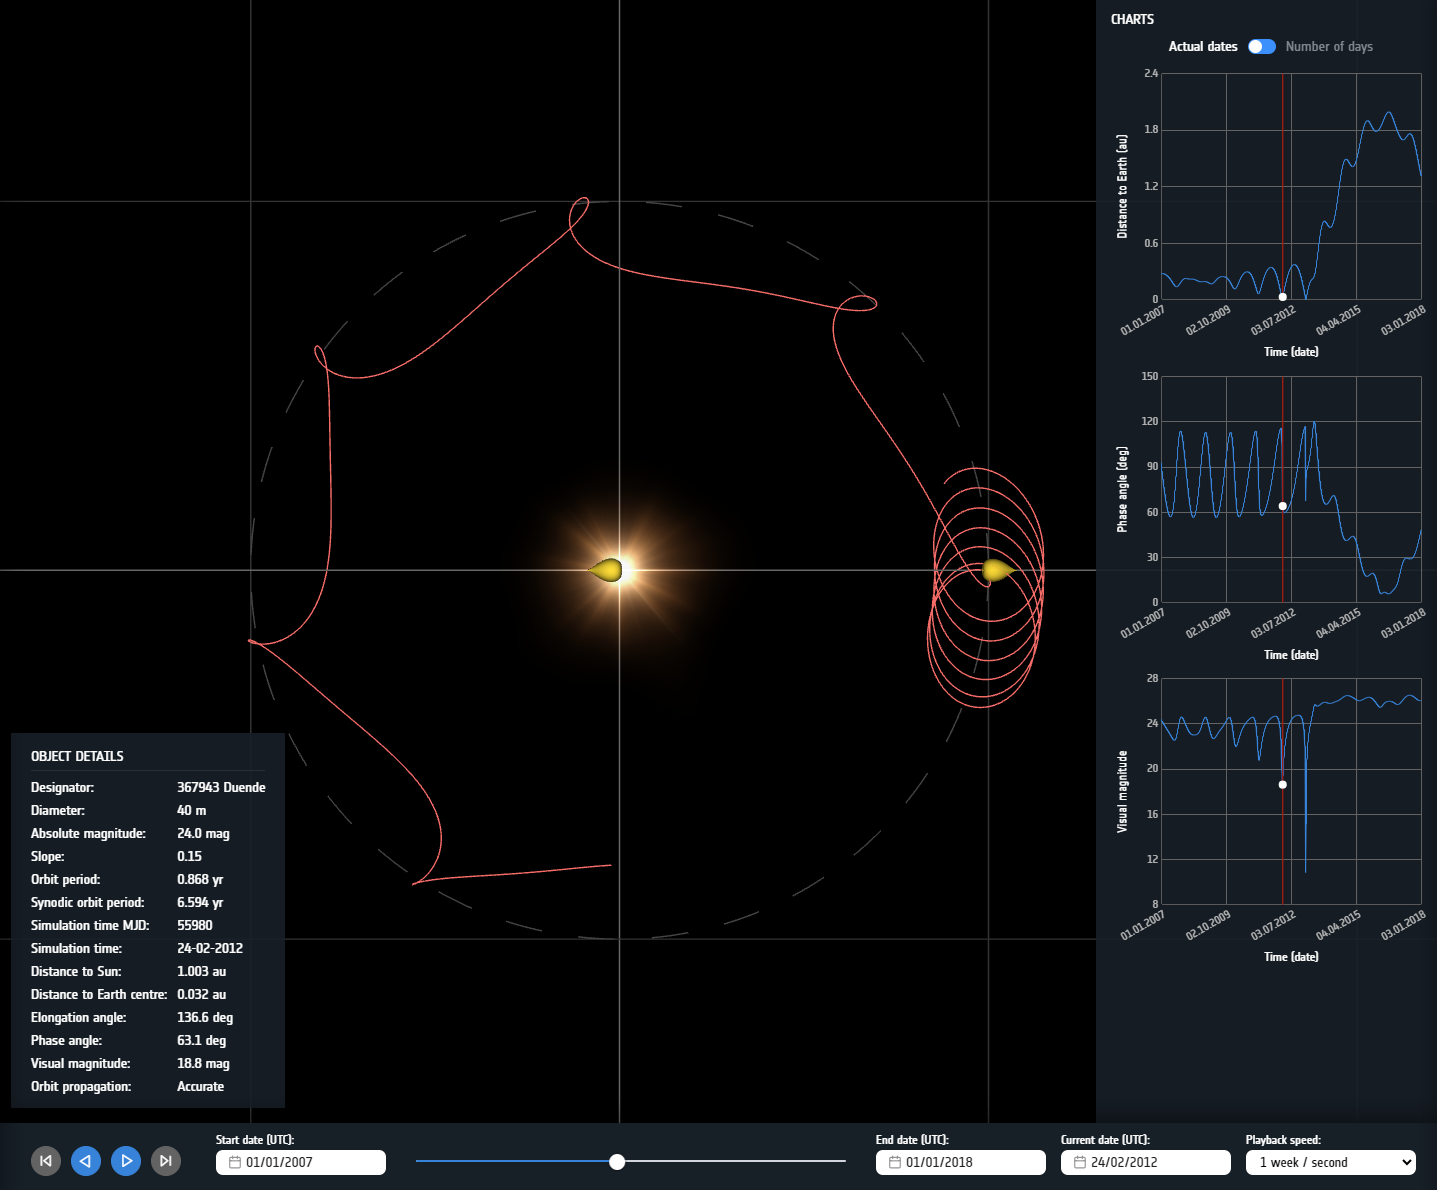
All those constraints and shapes can be easily simulated in ESA’s Synodic Orbit Visualisation Tool (SOVT), a software tool which allows the graphical representation of the mentioned detection polars extended to 3D shapes, in conjunction with the representation of the co-rotational motion of the object in space. An example of such representation is provided in Figure 2 for asteroid (367943) Duende between 01/01/2007 and 01/01/2018. The object was discovered in its close approach with Earth in February 2012 at an approximate visual magnitude of 19 and had an even closer approach on 15 February 2013. It can be observed how the trajectory transformed on that date from a long-synodic period Apollo orbit into a relatively short synodic period Aten orbit. The estimated absolute magnitude of this asteroid is 24.05 mag. The detection polar represented in the figure is the one corresponding to a limiting magnitude of 19, similar to the one at its discovery. This translates into a relative magnitude parameter of B = -5.05 mag, thus implying a very small detection polar, noticeable in the figure.
The SOVT thus allows analysing in a very direct and intuitive way when and how a NEO would become observable from Earth by a given telescope.

Figure 1: Evolution of the detection polar for relative magnitude values of B = -2 mag (upper left), B = 0 mag (upper-right), B = +2 mag (lower-left) and B = +4 mag (lower-right) in a Sun-Earth co-rotating reference frame, with the Sun in the origin and the Earth at location (1,0). The values of the plots are measured in astronomical units.

Figure 2: Screenshot of the SOVT for asteroid (367943) Duende between 01/01/2007 and 01/01/2018. It can be observed how the trajectory (in red) crosses the detection polar around Earth (in yellow) twice and transforms from a long-synodic period Apollo orbit into a relatively short synodic period Aten orbit. Additional plots are available at the right side of the plotting panel providing the evolution of the distance to the Earth, the phase angle and the visual magnitude.
How to cite: Cano, J. L., Micheli, M., Ramírez Moreta, P., Hoffmann, T., and Moissl, R.: The Asteroid Detection Polar and ESA’s Synodic Orbit Visualisation Tool, Europlanet Science Congress 2024, Berlin, Germany, 8–13 Sep 2024, EPSC2024-389, https://doi.org/10.5194/epsc2024-389, 2024.