Microphysical properties of Europa's dark lineaments
- 1European Space Agency (ESA), European Space Astronomy Centre (ESAC),Villanueva de la Cañada, Madrid, Spain (guillaume.cruzmermy@esa.int)
- 2Université Paris-Saclay, CNRS, GEOPS, 91405, Orsay, France
- 3Institut Universitaire de France, IUF, Paris, France
- 4Jet Propulsion Laboratory, California Institute of Technology
Europa’s surface is one of the youngest in the solar system. The Jovian moon is believed to hide a global liquid water ocean under its icy crust [1] and is exposed to intense space weathering due to the continuous bombardment by electrons and ions from Jupiter’s magnetosphere [2]. To understand the processes governing the evolution of the surface it is necessary to finely characterize the microphysics of the ice (composition via endmember volume abundance, grain size and surface roughness). Many recent studies have identified the presence of a large number of chemical compounds on the surface and mapped their distribution [3,4,5]. However, other microphysical properties are generally not integrated or not precisely constrained, and the low spatial resolution of the data used implies that these properties cannot be linked to surface morphologies (ridges, lineaments, chaos, craters).
Here we report an integrated work in which we aim to estimate the microphysical properties of Europa’s surface at the scale of a particular morphology: the dark lineaments of the trailing hemisphere. To do so, we used the Near-Infrared Mapping Spectrometer (NIMS) data [9] as they provide hyperspectral images of the surface at a resolution of a few kilometers per pixel, thus allowing to resolve these morphologies. Using a radiative transfer model [6] in a Bayesian MCMC inference framework [7,8] we produce maps of the microphysical properties at the NIMS spatial resolution. The work we present here is the results of three successives studies we have carried out.
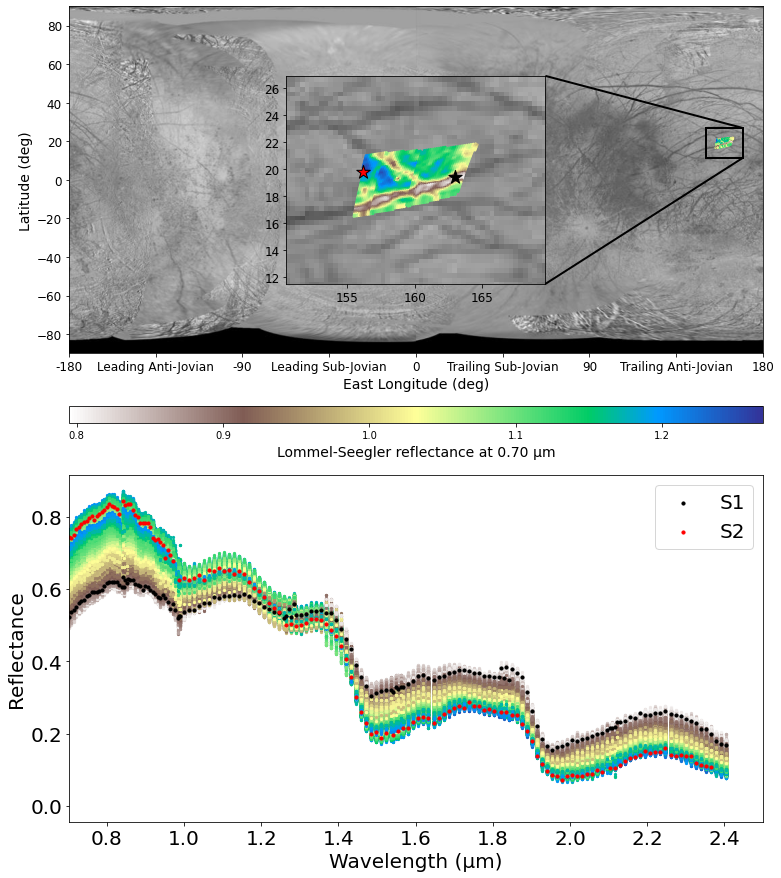
We first analyzed a calibrated spectrum of a dark lineament from the trailing Anti-jovian hemisphere (fig. 1). The estimated signal-to-noise ratio (SNR) is between 5 and 50, we mainly focus on the 1.0-2.5 µm region for which the SNR is higher with an uncertainty on the absolute calibration up to 10% [8]. With this spectrum, we tested all combinations of 3, 4 and 5 endmembers from a list of 15 relevant compounds [10]. With more than 5000 tested combinations we showed that some compounds appear necessary to reproduce the observation, such as water ice and sulfuric acid octahydrate, in agreement with previous studies [3,4,11]. However, adding either hydrated sulfates or chlorine salts produces results substantially similar [10].
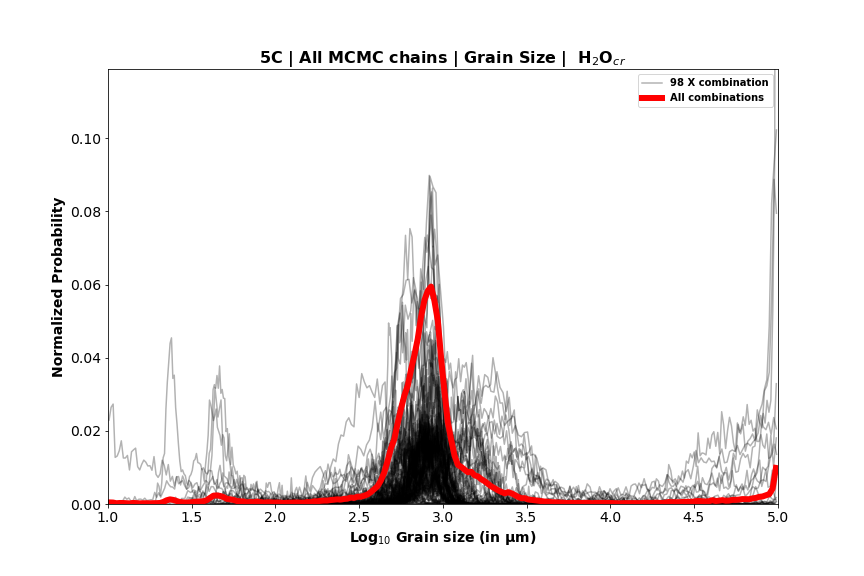
In a follow-up study [12], we focused on the few acceptable combinations identified by our Bayesian inversions and we analyzed the results in terms of grain size and surface roughness. We showed that the grain size of the essential end-members is well constrained and similar from one combination to another (fig. 2). The macroscopic roughness is however poorly constrained [12], as expected from a single geometry observation. Such results imply that it is possible to describe the surface in terms of volume abundance and grain size for the essential compounds (water ice and hydrated sulfates).
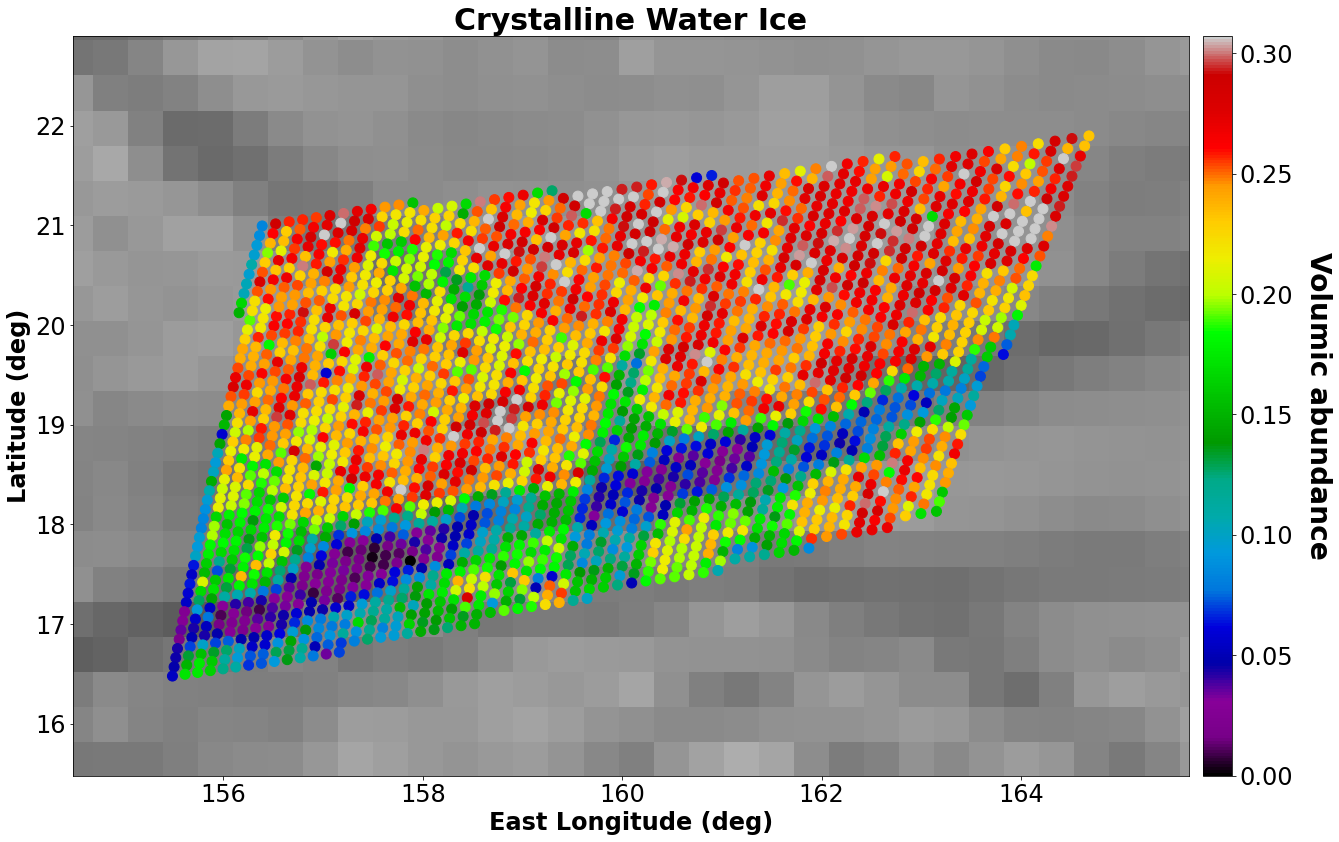
Using the previous results and thanks to numerical optimizations we are able to independently invert every spectrum of a NIMS hyperspectral cube with this Bayesian MCMC algorithm. We selected a mixture of 5 relevant end-members from our previous studies and mapped, for the first time, the volume abundance and grain sizes of water ice, sulfuric acid hydrate and hydrated sulfates at the scale of a NIMS footprint (fig 3). We propose a geological interpretation in which lineaments are a preferential location for material exchange between Europa’s surface and interior [13].

Figure 1 - (Top): Map of Europa with a zoom on Harmonia Linea observation. The colors represent the reflectance at 0.7 µm normalized using the Lommel-Seeliger law. (Bottom): All spectra from the corresponding cube and the selected spectrum (in black) used in this study.

Figure 2 - Posterior Probability Density Functions (PDF) of the grain size for all combinations in which crystalline water ice is used (in black) and averaged PDF (in red).

Figure 3 - Maps of the crystalline water ice volume abundance estimated from our Bayesian inversions of an entire NIMS hyperspectral image.
References: [1] Pappalardo, R. et al. (1999) JGR. [2] Carlson, R. W. et al. (2005) Icar. [3] Ligier, N. Et al. (2016) The Astr. Jour. [4] King, O. Et al. (2022) PSS. [5] Villanueva, G. et al. (2023), Science. [6] Hapke, B. (2012). Cambridge Univ. Press. [7] Cubillos, P. et al. (2016), The Astr. Jour. [8] Braak, C. J. F. (2008), Stat & Comp. [9] Carlson, R. et al. (1992) ed. C. T. Russell. [10] Cruz-Mermy, G. (2022) Icarus. [11] Mishra, I. et al. (2021) Planet. Sci. [12] Cruz-Mermy, G. (2024a) In prep. [13] Cruz-Mermy, G. (2024b) In prep.
How to cite: Cruz Mermy, G., Schmidt, F., Andrieu, F., Cornet, T., and Belgacem, I.: Microphysical properties of Europa's dark lineaments, Europlanet Science Congress 2024, Berlin, Germany, 8–13 Sep 2024, EPSC2024-752, https://doi.org/10.5194/epsc2024-752, 2024.