
 1,
1,- 1Swedish Institute for Space Physics (IRF), Kiruna, Sweden
- 2Royal Institute of Technology, Stockholm, Sweden
INTRODUCTION
Venus lacks an intrinsic magnetic field, exposing its upper atmosphere directly to the solar wind. The solar Extreme UltraViolet (EUV) radiation ionizes the upper layer of the atmosphere, known as the ionosphere, which in turn deflects the solar wind around the planet, resulting in the formation of an induced magnetosphere (Futaana et al., 2017). The induced magnetosphere contains different plasma boundaries, for example, the bow shock (BS), where the solar wind is slowed, heated and deflected as it transitions from the supersonic and super-Alfvénic regime to the subsonic and sub-Alfvénic regime. Another boundary, the ion composition boundary (ICB) marks the separation between solar wind and planetary ions (e.g., Martinecz et al., 2008)
The Pioneer Venus Orbiter (PVO) and Venus Express (VEX) missions have provided insights into Venus' plasma environment (e.g., Phillips et al., 1991; Svedhem et al., 2007). Data from these missions reveal that the boundaries of Venus' plasma environment vary in response to various upstream conditions. The BS and the ICB are influenced by the solar cycle phase, the magnetosonic Mach number, the solar wind dynamic pressure, and the Interplanetary Magnetic Field (IMF) direction and magnitude (e.g., Alexander et al., 1985; Russell et al., 1988; Zhang et al., 1991; Russell et al., 2006). In this study, we seek to develop refined boundary models which take into account upstream conditions.
DATASET AND METHOD
To characterize the Venus-solar wind interaction, the key information is how the boundaries' positions depend on various solar wind parameters. Formulating these variations in analytical form allows us to predict their positions. We used boundary crossings and upstream conditions recorded by the ion mass analyzer (IMA), the electron spectrometer (ELS), and the magnetometer (MAG) onboard VEX (Signoles et al., 2023) (Figure 1). We modelled the BS with a conic section curve, symmetrical around the longitudinal axis, expressed by
d = L / (1 + εcosα),
where d and α are the radial and angular coordinates, respectively. The semi-latus rectum L and the eccentricity ε are the free parameters, and we investigated their dependencies on upstream conditions. We also characterized the dayside ICB with a half sphere with radius ρ as free parameter. The nightside ICB is instead best modelled with a linear relation (eg., Martinecz et al., 2008). However, the higher number of crossing points on the dayside (Figure 1) restricted which characteristics of the boundaries we could study. The eccentricity ε in the BS model mainly affects the nightside flaring angle, so we couldn't reasonably investigate its dependence on upstream conditions. Therefore, our study focused solely on variations in L. Additionally, we didn't have enough crossings to model the nightside ICB, so we only considered the dayside portion.
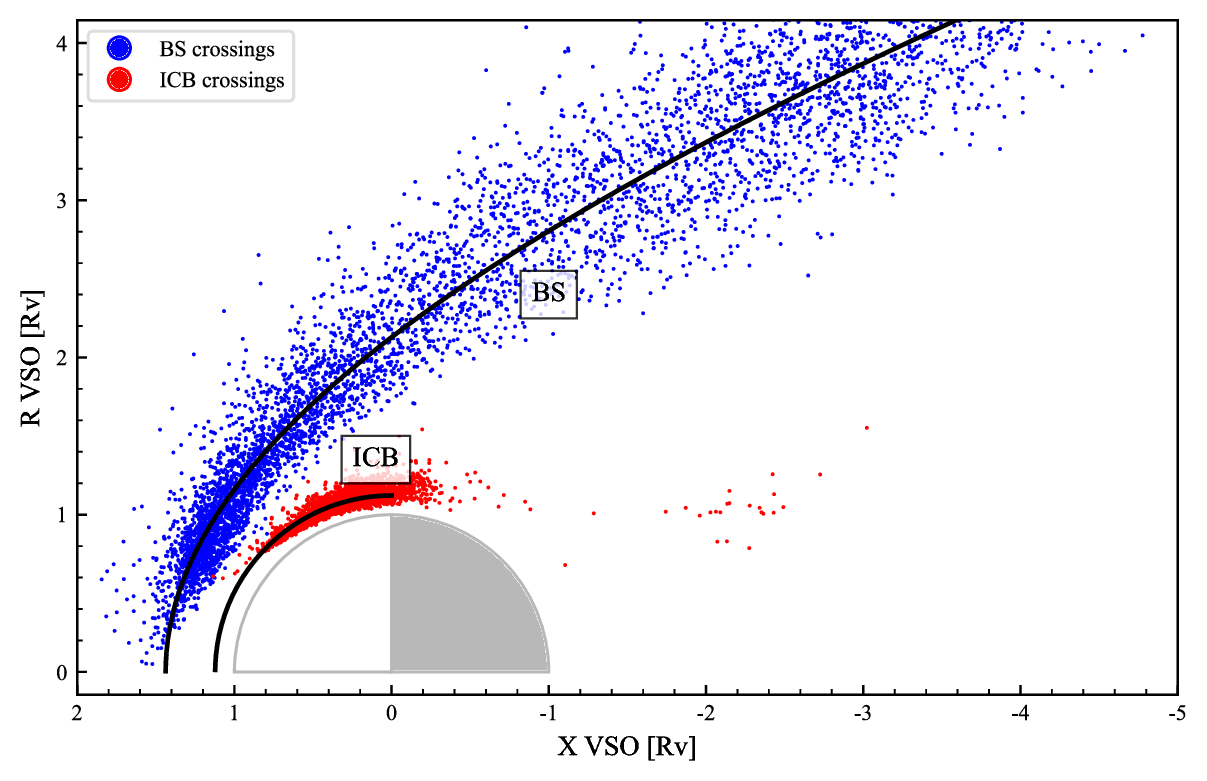
Figure 1: The BS and ICB positions and shapes. The X-axis points in the Sun direction, while R=(Y2 + Z2)1/2. The outer and inner curves represent the BS and ICB derived in this study, respectively. The boundaries' free parameters for the general models are L= 1.525 RV (Venus radius), ε = 1.036 and ρ = 1.122 RV. The BS focus is at x0 = 0.688 RV.
RESULTS AND DISCUSSION
Figure 1 shows the crossing points used in this study and the obtained BS and ICB models using the whole dataset. We further studied the free parameters' variation with different upstream conditions. Figure 2 shows an example of the L variation with IMF magnitude B and mass flux p.

Figure 2: The BS semi-latus rectum L as a function of IMF magnitude and mass flux. Each dot represents a data bin, containing several crossings. The horizontal bars represent the variability of the upstream conditions in each bin and the vertical bars represent the standard errors on L. The quantities are normalized by their average values.
We developed our final BS and ICB model by combining upstream conditions that minimized errors in predicting the boundaries' positions and shapes. In the BS model, the parameter L exhibits a linear dependence on the IMF magnitude and the shock normal angle θbn, while it inversely correlates with the mass flux. The shock normal angle is the angle between the IMF direction and the local shock normal at the crossing point. The ICB model depends linearly on the EUV flux FEUV and is inversely proportional to the energy flux FE. The models improve the accuracy of predicting boundary positions by approximately 22% for the BS and 8% for the ICB, compared to statistical models which disregard upstream conditions. Our findings indicate that the BS is more variable than the ICB as well as more sensitive to upstream conditions. Our conclusions agree with previous studies which suggest that the boundaries are influenced by the IMF, the solar wind dynamic pressure and the solar flux (e.g., Alexander et al., 1985; Russell et al., 1988; Zhang et al., 1991; Russell et al., 2006). Moreover, the shock normal angle dependence creates a quasi-perpendicular/quasi-parallel BS asymmetry. The quasi-parallel side of the BS (θbn< 45°) tends to be closer to the planet compared to the quasi-perpendicular side (θbn > 45°). This behaviour was confirmed in other studies as well (Zhang et al., 1991; Chai et al., 2014; Signoles et al., 2023).
REFERENCES
Alexander, C. J. et al. 1985, Geophys. Res. Lett., 12, 369
Chai, L. et al. 2014, JGRA, 119, 9464
Futaana, Y. et al. G. J. 2017, SSRv, 212, 1453
Martinecz, C. et al. 2008, PSS, 56, 780
Phillips, J. L. et al. 1991, SSRv, 55, 1
Russell, C. T. et al. 1988, JGRA, 93, 5461
Russell, C. T. et al. 2006, PSS, 54, 1482
Signoles, C. et al. 2023, ApJ, 954, 95
Svedhem, H. et al. 2007, PSS, 55, 1636
Zhang, T.-L. et al. 1991, Geophys. Res. Lett., 18, 127
How to cite: Rollero, U., Futaana, Y., and Rojas Mata, S.: Comprehensive Venus boundaries model, Europlanet Science Congress 2024, Berlin, Germany, 8–13 Sep 2024, EPSC2024-80, https://doi.org/10.5194/epsc2024-80, 2024.