
Laboratory hyperspectral analysis of icy mixtures with Martian Simulants
 1,2,3,1,4,3,
- 1Department of Geosciences, University of Padova, Padova, Italy (nicole.costa@studenti.unipd.it)
- 2Istituto di Astrofisica e Planetologia Spaziali (IAPS-INAF) Roma, Italy
- 3Department of Environmental Sciences, Informatics and Statistics, University Ca’ Foscari, Mestre, Venezia, Italy
- 4Centro di Ateneo di Studi e Attività Spaziali "Giuseppe Colombo" (CISAS), Padova, Italy
Introduction:
The layers of the Martian North Polar Layered Deposits (NPLD) are composed mainly of water ice and variable content of lithic inclusions probably because of astronomical parameters and thus climate variations. These variations are the causes of compositional and physical differences among polar layers [1], that could be detected by instruments onboard spacecraft. An example could be the Compact Reconnaissance Imaging Spectrometer for Mars (CRISM) onboard the NASA Mars Reconnaissance Orbiter (MRO). CRISM instrument is a spectrometer to study the composition of the whole Mars surface [2]. It works in a spectral range from 400 to 4000 nm, with a spectral sampling of 6.55 nm/channel and a spatial resolution of 18.4 m/px. Spectra acquired on the polar deposits can be compared with laboratory icy analogs. Therefore, in this work, we tried to retrieve the composition and the amount of dust included in the layers of the upper part of the North Polar Layered Deposits (NPLD).
Martian Simulants:
We analyzed Martian simulants that were commercially available in order to characterize deeply their compositions before any analysis:
- Mars Global High-Fidelity Martian Dirt Simulant (MGS-1): average composition of Mars [3];
- Mojave Mars Simulant (MMS-1): composition regolith of Phoenix landing site [4];
- Enhanced Mars Simulant (MMS-2): evolution of MMS-1 [4].
The chemical characterization was done using the Inductively Coupled Plasma Mass Spectroscopy, the mineralogical analysis was performed by X-ray diffraction (and SEM-EBS only for MGS-1 coarse grains) and the grainsize was studied through the Laser Diffraction Particle Size Analyzer. We used the finest grains (0-32 µm) of the simulant MGS-1 because it has spectral behavior similar to the atmospheric dust that could be entrapped in the polar layers [5].
Icy slabs:
We mixed a specific quantity of MGS-1 with deionized water to recreate the composition of the polar layers (e.g., see [6]). We froze the mixture at -80°C like the summer temperature at the Martian North Pole [7] or instantaneously in liquid nitrogen. The resulting icy slab was extremely narrow to avoid the precipitation and thus the separation between simulant and water ice. They have been acquired in the VNIR-SWIR range by hyperspectral imaging cameras. We tested the spectral variation with:
- variation in dust/ice ratio;
- increase of temperature;
- different freezing times and methods.
Laboratory set-up:
The accommodation stage of the Headwall Photonics Nano Hyperspec VNIR camera and the Micro Hyperspec SWIR camera was adapted to allow the hyperspectral acquisition of icy mixtures (Figure 1). The icy samples were placed over a cold holder, whose temperature was controlled by a thermocouple. We worked in nitrogen atmosphere to avoid the formation of condensation over the sample.
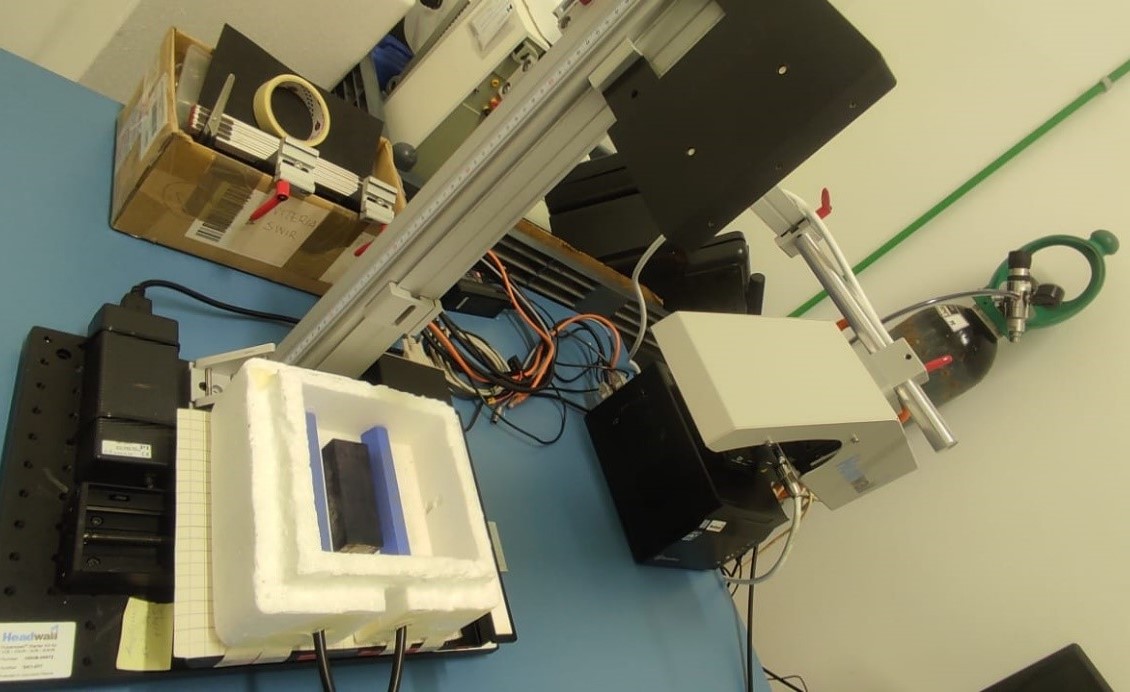
Figure 1. Hyperspectral camera and its modified stage to acquire spectra of icy slabs.
Preliminary results:
The 400-1000 nm spectra of the icy slabs are characterized by absorption bands of the iron contained in the simulant. These absorption bands increase their depth increasing the amount of dust in the mixture. The 1000-2500 nm spectra are characterized by absorption bands of the water ice, that become deeper with the decrease of dust content [7] (Figure 2). The temperature causes a general shift of the spectrum upwards [8].
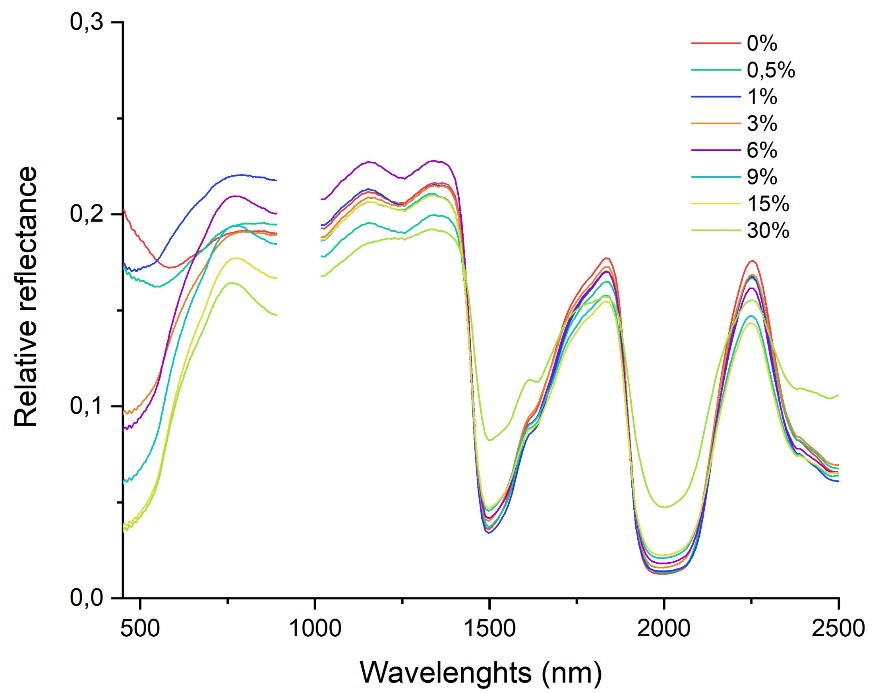
Figure 2. Spectra in the range from 400 to 2500 nm of mixtures with different concentrations of MGS-1.
Conclusions:
The laboratory set-up presented in this work is easy to build and the procedure is easy to replicate. All preliminary results are comparable with what is found in literature. Instead of ice grains, we have produced and analyzed icy slabs that could contain more than 30% dust. Moreover, icy slabs could be similar to polar layers instead of a simple mixture of powder and snow.
We plan to perform more detailed spectral analysis of icy mixtures eventually using other instruments (e.g., see [9]).
References:
[1] Byrne S. (2009) Annu. Rev. Earth. Planet. Sci., 37(1), 535-560, https://www.annualreviews.org/doi/pdf/10.1146/annurev.earth.031208.100101.
[2] Viviano-Beck C. E. et al. (2014) J. Geophys. Res., 119(6), 1403-1431, https://doi.org/10.1002/2014JE004627.
[3] Cannon K. M. et al. (2019) Icarus., 317, 470–478, https://doi.org/10.1016/j.icarus.2018.08.019.
[4] Peters et al. (2008) Icarus, 197, 470–479, https://doi.org/10.1016/j.icarus.2008.05.004.
[5] Costa et al. (2024) Data in Brief, submitted.
[6] Smith I. B. (2019) Geophys. Res. Lett., 48(15), https://doi.org/10.1029/2021GL093618.
[7] Horne D. et Smith M. D. (2009) Icarus 200(1), 118-128, https://doi.org/10.1016/j.icarus.2008.11.007.
[8] Yoldi Z. Et al. (2021) Icarus, 358, https://doi.org/10.1016/j.icarus.2020.114169.
[9] Brissaud O. et al. (2004) Appl. Opt. 43(9), 1926-1937, https://doi.org/10.1364/AO.43.001926.
How to cite: Costa, N., Bonetto, A., Ferretti, P., Casarotto, B., Massironi, M., Bohleber, P., and Altieri, F.: Laboratory hyperspectral analysis of icy mixtures with Martian Simulants, Europlanet Science Congress 2024, Berlin, Germany, 8–13 Sep 2024, EPSC2024-867, https://doi.org/10.5194/epsc2024-867, 2024.