- 1INAF-Astrophysical Observatory of Arcetri, Firenze, Italy (giovanni.poggiali@inaf.it)
- 2LESIA-Observatoire de Paris, Université PSL, CNRS, Sorbonne Université, Université de Paris Cité,
- 3Department of Earth Science, University of Pisa, Pisa, Italy
- 4CISAS, Università di Padova
- 5INAF-Astronomical Observatory of Padova, Padova, Italy,
- 6CISUP, Centro per l'Integrazione della Strumentazione Università di Pisa, Pisa, Italy
- 7National Institute of Advanced Industrial Science and Technology, Tsukuba, Japan
- 8Univ. Grenoble Alpes, CNRS, IPAG, 38000 Grenoble, France
- 9Department of Earth Science, Tohoku University, Japan
- 10Institut Universitaire de France (IUF), 1 rue Descartes, F-75231 Paris Cedex 05, France
- 11LATMOS, CNRS, Sorbonne Université, Université Versailles St-Quentin, Guyancourt, France
Introduction: Dark surfaces, such as those found on planets asteroids and other primitive bodies, are the focus of past, present, and future space missions within the Solar System. Understanding the spectroscopic characteristics of these low albedo surfaces remains a significant challenge, with our current knowledge being incomplete. The presence of opaque materials [1] or surface processes like space weathering [2] or thermal alteration [3] often is linked with these dark surfaces. Interpreting remote sensing data necessitates intensive laboratory work, which serves as a pivotal tool in revealing the physical state and composition of these surfaces.
Analyzing complex mixtures of analogous materials remains one of the pivotal laboratory investigations to support remote sensing interpretation, but it also represents one of the most challenging experiments, in particular when multiple components are used in the mixtures. We present in this contribution several results from different works that share the common goal of studying how the mixing of different grain size and dark materials can affect the behavior of infrared spectra in the near- to mid-infrared range (1.25-25 μm).
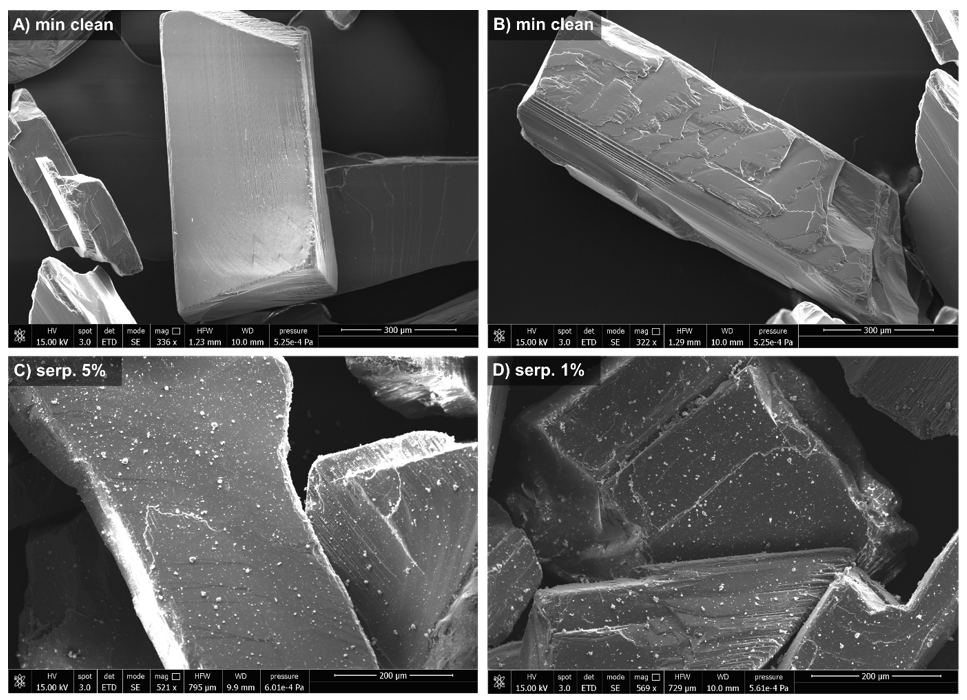
Methods: In this presentation, two primary studies will be outlined: the initial investigation delves into the combination of hydrated and anhydrous mineral components with varying grain sizes [4], while the subsequent study examines the blending of basalts with dark components at different grain sizes [5]. Samples prepared for both studies utilize an innovative protocol for mixing two components with distinct grain sizes. This method involves a sequence of steps, including sieving and mineral washing to isolate each grain size, followed by the mixing of the selected components. This procedure allows us to produce unique samples with a bigger grain size covered by a selected amount of small grains (Figure 1).
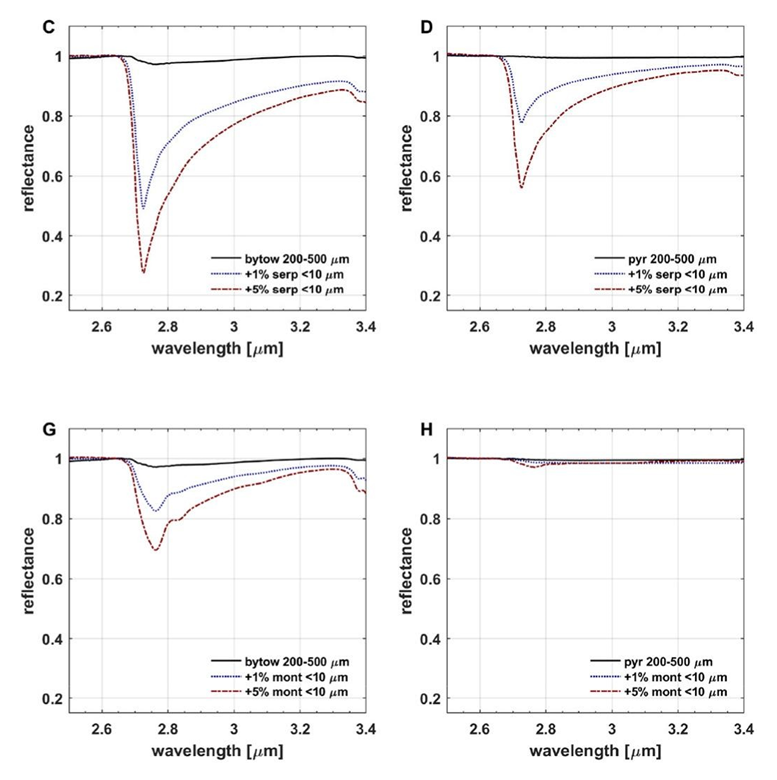
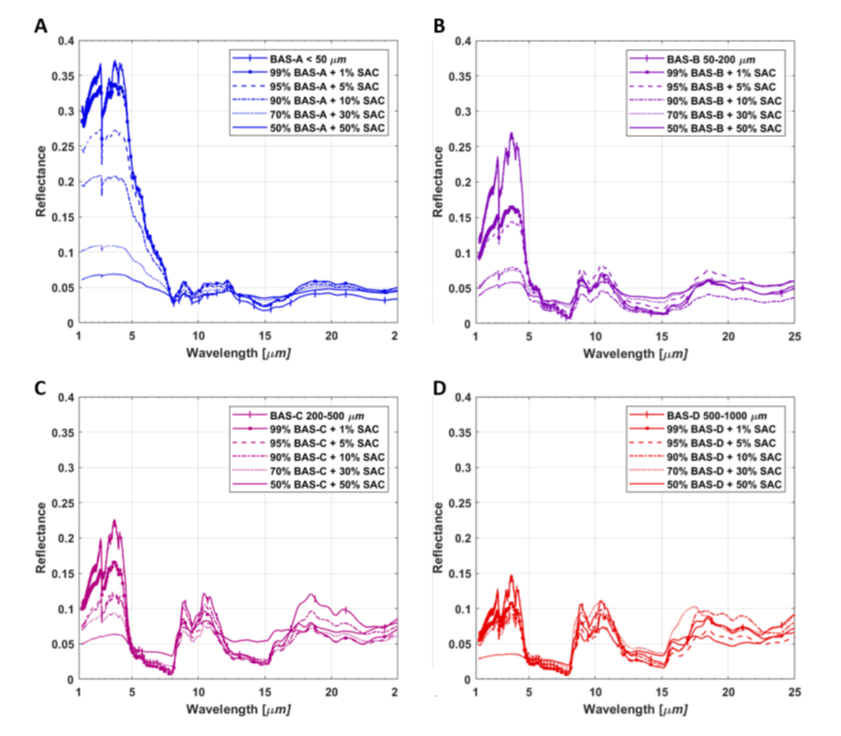
In the first work, we prepared several mixtures using 1 wt% and 5 wt% of hyperfine grain size (< 10 μm) of hydrated minerals and 95 wt% and 99 wt% of larger grain size (200–500 μm) of anhydrous minerals. We measured the IR reflectance spectrum of these mixtures in the range 8000–400 cm−1 (1.25–25 μm). Analysis of the spectroscopic features was carried out independently in two separated ranges covered by our measurements, in the NIR range we focused on the presence of the hydrated band at 2.7 μm while in the MIR range we carried out an analysis of the most important spectroscopic features present. The second sample set includes four series of basaltic mix (feldspar and pyroxene), at different grain sizes from < 50 μm to 500-1000 μm, mixed with amorphous carbon at increasing weight percentages from 1% to 50%. We analyzed several features on the spectrum of each mineral mixture: (i) near infrared slope; (ii) 2.7 μm OH-stretching band; (iii) Christiansen features; (iv) Reststrahlen band and Transparency feature.

Figure 1. Secondary electrons SEM image of enstatite sample before (panel A and B) and after mixing with 5% and 1% of serpentine (panel C and D).
Results: The results of the first work [4] show how the addition of a hydrated component, which is minor in percentage and has a much smaller grain size, can lead to very remarkable changes in the NIR region especially in increasing the hydrated band depth at 2.7 μm (Figure 2), while slightly affecting the MIR region. The surface of many rocky bodies is covered with regolith, and these new laboratory data show how even a small amount of hydrated mineral in the composition can influence the final spectrum. Measurements presented in the second work [5] point towards a critical effect of dark material but with a different outcome for each grain size of the brighter component of the mixture (Figure 3). For the first time we investigate the spectral range from NIR to MIR. Some of the most interesting results involved the slope trend of modification with dark material, in particular we observed an inversion between reddening and bluing depending on the percentage of the mixture and the grain size. Moreover, we investigated also the different behavior of several features such as: hydrated band at 2.7 μm, the Reststrahlen band and Transparency feature.
Conclusion: Enhancing our comprehension of spectroscopic alterations resulting from minor fluctuations in mineral phases is crucial for accurately interpreting remote sensing data gathered from planetary surfaces by space missions. The dataset compiled from our experiments will serve as vital groundwork for interpreting forthcoming data from the JAXA Martian Moon eXploration mission. Additionally, it will aid in comprehending past data from dark surfaces within the Solar System, such as asteroids (162173) Ryugu and (101955) Bennu. Significant laboratory efforts are still required to effectively complement the analysis of remote sensing data, with numerous additional mixtures and combinations slated for investigation as a follow-up to this research. Further laboratory measurements will serve a dual purpose: expanding the database for interpreting planetary surfaces and furnishing reference spectra to enhance and validate current and future models.

Figure 2. Detail of hydrated band around 2.7 μm for hydrated minerals serpentine (top panels) and montmorillonite (bottom panels) with grain size <10 μm mixed at 1 wt% (dotted blue line) and 5 wt% concentration (dash-dot red line) with: plagioclase bytownite (panels C, G) and iron sulfide pyrite (panels D, H). (Figure adapted from [4])

Figure 3. Infrared spectra of basaltic mixtures [BAS] at different grain sizes, <50, 50-200, 200-500 and 500-1000 μm, with addition in different proportions, from 1 to 50%, with synthetic amorphous carbon [SAC] (Figure from [5]).
Acknowledgments: Authors thank Nathalie Ruscassier for the help with the SEM images acquisition and analysis. G.P., M.A.B., A.D. and A.W. acknowledge support by Centre National d’Etudes Spatiales (CNES). L.F. and J.R.B. acknowledge support from Italian Space Agency ASI-INAF agreement 2022-1-HH.0.
References: [1] Cloutis E. et al. (1990) Icarus, 84 (2), 315-333 [2] Hasegawa et al. (2022), ApJ. Let-ters, 939, L9 [3] Lugassi, R, et al. (2015), Geoder-ma, 213, 268-279 [4] Poggiali G. et al. 2023a, Icarus, 394, 115449 [5] Poggiali G. et al. 2024, A&A 685, A14
How to cite: Poggiali, G., Wargnier, A., Fossi, L., Iannini Lelarge, S., Beccarelli, J., Brucato, J. R., Barucci, M. A., Pajola, M., Masotta, M., Matsuoka, M., Beck, P., Nakamura, T., Merlin, F., Fornasier, S., Gautier, T., and David, G.: Linking laboratory and remote sensing investigations: grain size and mineral mixing studies as pivotal tools to interpret solar system exploration., Europlanet Science Congress 2024, Berlin, Germany, 8–13 Sep 2024, EPSC2024-913, https://doi.org/10.5194/epsc2024-913, 2024.