Unveiling the Topography of Europa's Thera Macula, Thrace Macula, and Libya Linea Using Stereogrammetry and Shape-from-Shading
- 1Dipartimento di Ingegneria e Geologia, Università degli studi G. d'Annunzio Chieti - Pescara, Italy (gianluca.chiarolanza@unich.it)
- 2International Research School of Planetary Sciences, Università degli studi G. d'Annunzio Chieti - Pescara, Italy
Introduction
Jupiter’s icy moons are the focus of two upcoming planetary missions: JUICE (JUpiter ICy moons Explorer), developed by the European Space Agency (ESA), which is primarily dedicated to Ganymede but will also conduct flybys over Callisto and Europa; Europa Clipper, developed by NASA, which is primarily dedicated to studying Europa. Understanding the surface topography of these moons is crucial for comprehending their evolutionary history. Adequate preparation for the observations these probes will conduct requires preliminary knowledge of the characteristics of these planetary bodies. Integrating information from past missions with data to be acquired by these probes will enhance our understanding of these moons and the processes that have shaped their forms. This approach will allow us to achieve a more comprehensive knowledge and a better understanding of the icy satellites.
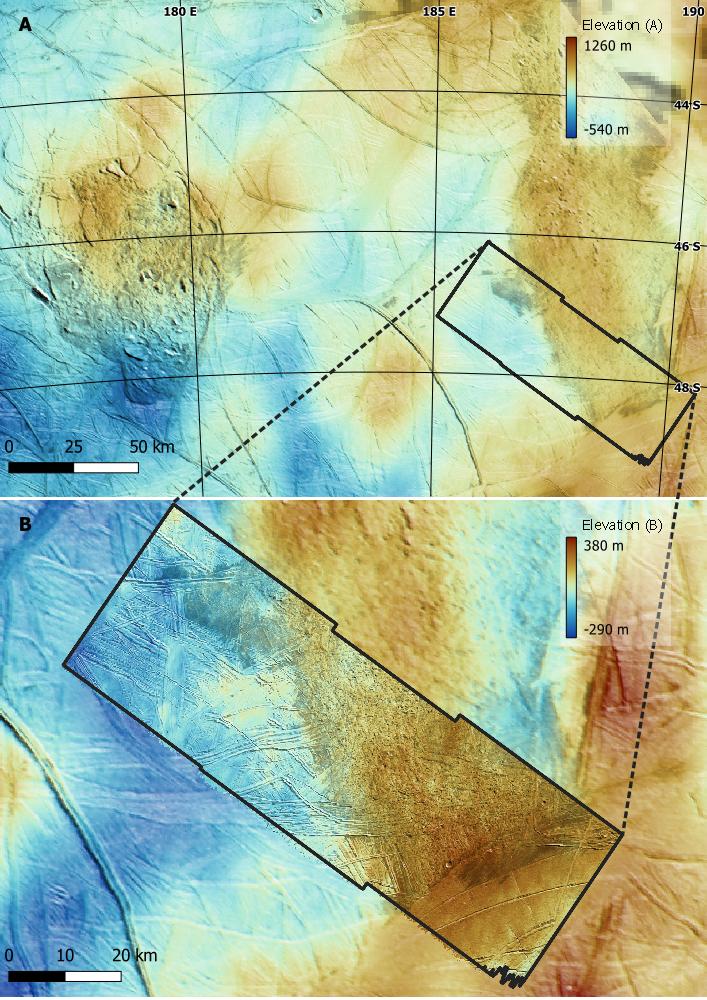
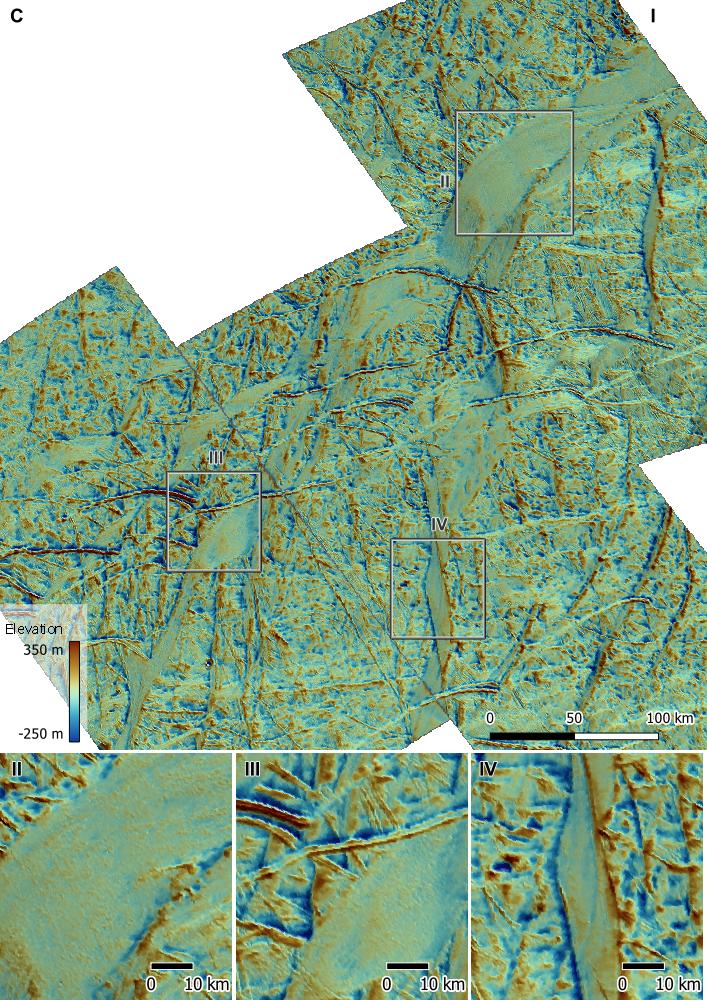
In preparation of these missions, we tested the approach of using images acquired by different spacecrafts under unfavourable conditions to generate topographic models through two photogrammetric techniques: stereogrammetry and shape-from-shading (SfS). The focus of this study is on three areas of Europa: the region of Thera Macula and Thrace Macula (Area A; Figure 1, top), the southern extension of Thrace Macula (Area B; Figure 1, bottom), and the band Libya Linea (Area C; Figure 2). The first two areas, in particular, were long-standing targets of the JUICE mission, but subsequent orbital reconfigurations have excluded their observation.
Dataset
The data used in the topographic modelling of the three regions include image data from the Voyager II ISS (Image Science Subsystem) [1] and the Galileo SSI (Solid-State Imaging) [2], acquired between 1979 and 2002. The Voyager II ISS dataset consists of 8 images with global resolutions (GR) of 1.6 – 1.9 km/pxl, acquired in colour, UV, and clear filters. The Galileo SSI dataset comprises 5 GR images at 1.4 – 1.7 km/pxl, acquired in colour, IR, and clear filters; 7 images with regional resolutions (RR) of 187-428 m/pxl, in the clear filter; and 3 high-resolution (HR) images at 44 m/pxl in the clear filter.
Images were processed using the Integrated Software for Imagers and Spectrometers (ISIS) [3]. We used updated SPICE kernels from [4], which provide the most accurate coordinate reference frame currently available for Europa. Processing included radiometric calibration, edge trimming, noise filtering, removal of Reseau points (for Voyager data), manual filtering of punctual artifacts, brightness equalization, and map-projection.
Topographic Modelling
We assessed the suitability of single images and 83 potential stereo pairs for stereo analysis by extracting geometric and spatial information from the common surface shared by each image pair. The suitability for stereo analysis and estimation of vertical precision were conducted using well-established criteria from the literature [5, 6, 7] .
We used the stereo algorithm implemented in the Ames Stereo Pipeline (ASP) [6] to generate stereo DEMs of areas A and B, testing various pre-processing operations and algorithm configurations. Galileo and Voyager GR images were employed in the stereo analysis of Area A, resulting in 55 DEMs. These include combinations of images acquired by the same spacecraft, either Galileo (G-G) or Voyager (V-V), and combinations formed by a Galileo and a Voyager frame (G-V). For Area B, 5 stereo DEMs were generated from combinations of Galileo LR and HR images.
SfS refinement of stereo DEMs was performed employing Galileo LR images in Area A, and Galileo HR images in Area B. In a sub-area of A, we were also able to exploit a multi-view approach, though under extreme illumination conditions. Topography in Area C was obtained from SfS only, without a stereo initial DEM, using all 5 Galileo LR frames. Various settings of SfS constraints were explored to optimize DEM quality.
Results
The quality of the resulting stereo DEMs was assessed using criteria from the literature [5-8] and additional factors such as elevation range, noise, inter-DEM consistency, amount of height variation, and ruggedness. Based on these criteria, a blended mosaic of three G-V DEMs provided the most plausible terrain model of Area A, possibly representing the first stereo topography of this Europan region documented in the literature. The vertical precision’s RMS in the blended DEM is 0.47 km. Further analyses are underway to assess significant topographic differences. The G-G stereo DEM in Area B offers a more reliable vertical extent of the chaotic terrain, measured at 494 ± 84 m. In general, topographic features appear poorly related to mappable geologic structures and more akin to topographic swells observed on other Europan regions [9].
Local topography was assessed by comparing SfS DEMs obtained under various configurations of constraints and using shadow measurements as a reference for accuracy. The obtained solutions favoured either height accuracy or successful filtering of typical SfS artifacts, such as sun-aligned streaks or artificial, albedo-driven reliefs, but not both. The highest local reliefs, up to ~850 m, are observed in the steep blocks of Thera Macula
Acknowledgments
G.C. and G.M. acknowledge support from the Italian Space Agency (2023-6-HH.0).
References
[1] B. A. Smith et al., Space Sci Rev, 1977
[2] M. J. S. Belton et al., Space Sci Rev, 1992
[3] J. Laura et al., 2023
[4] M. T. Bland et al., Earth and Space Science, 2021
[5] K. J. Becker et al., 2015
[6] R. A. Beyer et al., Earth and Space Science, 2018
[7] R. L. Kirk et al., Remote Sensing, 2021
[8] M. T. Bland et al., Remote Sensing, 2021
[9] P. M. Schenk et al., 2001

Figure 1 Top: Stereo-SfS DEM of Thera Macula and Thrace Macula (Area A). Bottom: Stereo-SfS DEM of Thrace Macula’s southern extension (Area B)

Figure 2 Panel I: SfS-DEM of Libya Linea (Area C). Panels II-IV: Zoomed-in views of selected features.
How to cite: Chiarolanza, G. and Mitri, G.: Unveiling the Topography of Europa's Thera Macula, Thrace Macula, and Libya Linea Using Stereogrammetry and Shape-from-Shading, Europlanet Science Congress 2024, Berlin, Germany, 8–13 Sep 2024, EPSC2024-99, https://doi.org/10.5194/epsc2024-99, 2024.