TP1 | Atmospheres and Exospheres of Terrestrial Bodies

TP1

Atmospheres and Exospheres of Terrestrial Bodies
Convener: Anni Määttänen | Co-conveners: Francisco González-Galindo, Gabriella Gilli, Tanguy Bertrand, Orkun Temel
Orals
| Mon, 09 Sep, 08:30–12:00 (CEST)|Room Uranus (Hörsaal C)
Posters
| Attendance Mon, 09 Sep, 14:30–16:00 (CEST) | Display Mon, 09 Sep, 08:30–19:00|Poster area Level 2 – Galerie
Orals |
Mon, 08:30
Mon, 14:30
Space missions have provided a wealth of data on the atmospheres and aeronomy of rocky planets and moons, from the lower layers up to the external envelopes in direct contact with the solar wind. A recent emerging finding is evidence that the atmosphere behaves as a single coherent system with complex coupling between layers. This session solicits contributions that investigate processes at work (chemistry, energetics, dynamics, electricity, escape etc...) on the terrestrial bodies of the Solar System and includes studies of the coupling between the lower/middle and upper atmospheres. Contributions based on analysis of recent spacecraft and ground- based observations, comparative planetology studies, numerical modelling and relevant laboratory investigations are particularly welcome. In view of the three future Venus missions selected by ESA and NASA, papers discussing contemporary Venus atmospheric science in preparation for these missions are also encouraged. The session will consist of invited and contributed oral talks as well as posters.

Session assets

Discussion on Discord

Orals: Mon, 9 Sep | Room Uranus (Hörsaal C)

Chairpersons: Anni Määttänen, Orkun Temel, Claire Newman
Mars
08:30–08:45
|
EPSC2024-391
|
solicited
|
On-site presentation
James Holmes, Eryn Cangi, Michael Chaffin, Juan Alday, Kevin Olsen, Shohei Aoki, Giuliano Liuzzi, Geronimo Villanueva, Matteo Crismani, Anna Fedorova, Justin Deighan, Nicholas Schneider, David Kass, Stephen Lewis, Manish Patel, Ann Carine Vandaele, and Oleg Korablev

The evolution of water on Mars is a major scientific topic that can in part be advanced through the provision of bounded constraints on the rates of water loss. The Mars Atmosphere and Volatile EvolutioN Imaging Ultraviolet Spectrograph instrument continues to monitor the Lyman alpha brightness from Mars that is intricately linked to the hydrogen escape flux, but converting the emission data to hydrogen escape fluxes is difficult. We provide a complementary approach by combining retrievals of water vapour, temperature and dust from multiple spacecraft in orbit around Mars through a process called data assimilation. Recent instrument data from the Nadir and Occultation for MArs Discovery (NOMAD) and Atmospheric Chemistry Suite (ACS) instruments on the ExoMars Trace Gas Orbiter (TGO) provide a relative wealth of water vapor vertical profiles that are critical in constraining the vertical distribution and transport of water, the main chemical species that influences hydrogen escape rates. This lower atmosphere assimilation, that forms part of the OpenMARS (Open access to Mars Assimilated Remote Soundings) dataset, is coupled to a state of the art upper atmosphere model. Number densities of key chemical species in the assimilation are passed as a lower boundary to the upper atmosphere model to drive calculations of hydrogen escape at 200 km altitude.

We investigate the escape of hydrogen during the time period that covers the primary science phase of the ExoMars TGO mission until the end of Mars Year (MY) 35 (around 1.5 Mars years). Hydrogen escape during the perihelion season is found to be a factor of 10 increased compared to aphelion, as a result of the seasonal pump of water vapor from the southern polar cap twinned with increased levels of atmospheric dust. The general trend over the perihelion season is in line with the first-order fit of Hubble Space Telescope hydrogen escape fluxes, although larger temporal variations are evident in the model simulations as these can compute the hydrogen escape flux at much finer temporal resolution. Variations in the peak intensity of hydrogen escape flux in both MY are evident, with the global dust storm in MY34 creating an early dust season peak which seems to diminish the peak at perihelion found a year later. The southern summer regional-scale dust storms that occur each year create a late season peak in hydrogen escape flux, with year-to-year variability in the exact timing of this particular dust storm as leading to a shift in the timing of peak hydrogen escape.

How to cite: Holmes, J., Cangi, E., Chaffin, M., Alday, J., Olsen, K., Aoki, S., Liuzzi, G., Villanueva, G., Crismani, M., Fedorova, A., Deighan, J., Schneider, N., Kass, D., Lewis, S., Patel, M., Vandaele, A. C., and Korablev, O.: Constrained estimates of water loss from the martian atmosphere in a coupled TGO/MRO assimilation, Europlanet Science Congress 2024, Berlin, Germany, 8–13 Sep 2024, EPSC2024-391, https://doi.org/10.5194/epsc2024-391, 2024.

08:45–08:55
|
EPSC2024-317
|
On-site presentation
Jean-Yves Chaufray, Francisco Gonzalez-Galindo, François Forget, Gabriella Gilli, Ehouarn Millour, François Leblanc, Ronan Modolo, and Miguel Lopez-Valverde

Abstract

In this study, we simulate the density of four important species in the Martian upper atmosphere (CO2, N2, Ar and He) with Mars-PCM. We use a new numerical approach to compute the molecular diffusion, including an eddy diffusion term to better describe the transition between the homosphere and the heterosphere. We compare the simulated densities of these species with the numerous observations done by the mass spectrometer NGIMS on MAVEN during several martian years.

Introduction

The thermosphere is the upper region of the atmosphere, below the exobase, above which collisions between species are not important. This region absorbs the EUV solar radiation leading to an important and complex set of chemical reactions crucial to understand fundamental processes such as atmospheric escape. The MAVEN mission has provided an unprecedented set of observations of the Martian thermosphere during more than 10 years of observations. These observations include measurements of the composition of the Martian thermosphere done by the mass spectrometer NGIMS [1] which measures the density of ions and neutrals. These observations are crucial to validate models of the Martian thermosphere such as PCM-Mars [2]. To start a systematic comparison between the simulated thermosphere and MAVEN observations, we focus on the main species CO2, and the major chemically inert or almost inert species (N2, Ar, He).

Model

PCM-Mars is a 3D model of the Martian atmosphere from the surface to the exobase [2, 3]. This model includes all important physical processes controlling the Martian thermosphere, including: heating and cooling processes, dynamics, chemistry and molecular diffusion [3, 4, 5] and can be used to simulate generic scenarios for theoretical studies or specific scenarios corresponding to specific Martian years. We recently update the numerical scheme used to solve the vertical diffusion equation including eddy mixing. Instead of a matrix inversion [5], the new method used the faster “modified pass flow” algorithm [6, 7] based on the calculation of a recurrence sets, expanded to solve the time dependent equation of diffusion. We also added an eddy diffusion to better describe the thermosphere. The eddy mixing ratio used for this comparison is taken from [8] and expressed by

K(z) = K0[Texo/n(z)]1/2

where K0 is a free parameter, chosen to 1.2x1011 cm2.s-1 [8] for the comparison below.

Results and discussion

A first set of comparison between a generic scenario and the observations by MAVEN/NGIMS during the Martian year 33 is shown below.

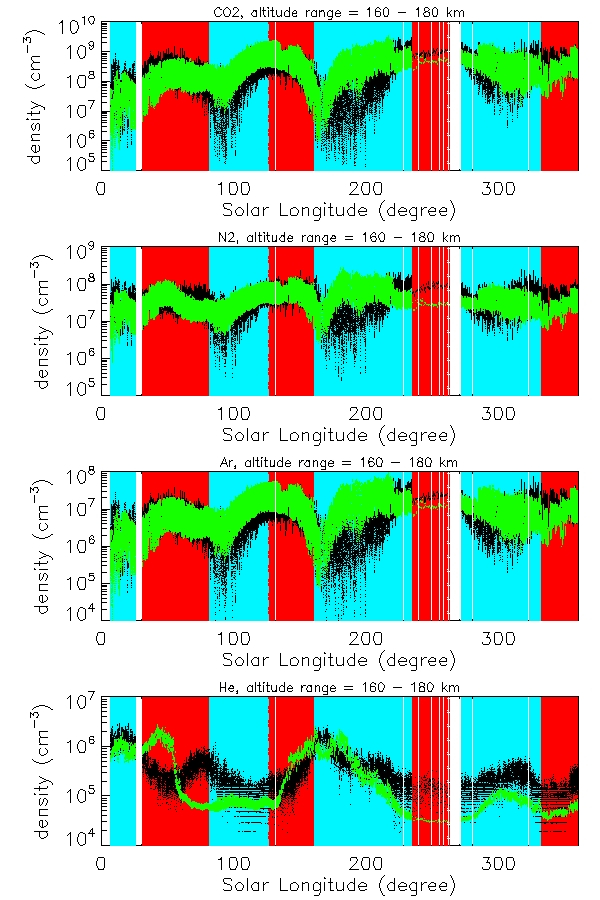
Fig. 1 Comparison between the observed density (black dots) and the simulated density (green dots) of CO2 (first panel), N2 (second panel), Ar (third panel) and He (last panel) during the Martian year 33. The blue background corresponds to nightside observations and the red background to dayside observations, while white backgrounds are periods without observations.

The observed density and the simulated densities for the four species are in general agreement but some differences can be noted. The large variations observed by NGIMS for CO2, N2 and Ar are mostly due to local time variations (with lower densities at the nightside than dayside). This trend is present but slightly underestimated by the model near Ls = 80° and between Ls = 160- 200° (corresponding to a local time varying from 6 am to midnight). During this last period, the density of the three species is overestimated except near 6 am, possibly due to an overestimate of the temperature. For He (last panel), the night (morning) bulge detected by NGIMS near Ls = 180° is reproduced by the model but the bulge observed near Ls = 80° (morning) is not simulated (possibly due to a lower latitudinal extent of the simulated bulge), while the nigthside bulge observed near Ls = 300° is underestimate by a factor ~ 2.

Conclusion

This first comparison between the simulated density of CO2, N2, Ar, and He with MAVEN/NGIMS measurements shows that the order of magnitude of the simulated densities between 160 and 180 km agree with the observations at the dayside, while at the nightside important differences can be noted. The observed spatio-temporal variations of He differs from CO2, Ar and N2. PCM-Mars also predicts different variations due to the low mass of He, but the predicted variations for He differ substantially from the observed variations, while for CO2, Ar, N2 the main trends are better reproduced. Simulations (dust scenario, solar radiation) specific to the different Martian years will be performed to better understand if some of the differences can be explained. One important difference could be due to an overestimate of the nightside temperature in PCM-Mars.


Aknowledgements

JYC is supported by the Programme National de Planétologie (PNP, France) of CNRS-INSU co-funded by CNES and Programme National Soleil Terre (PNST, France) of CNRS-INSU co-funded by CNES and CEA

References

[1] Bougher, S. et al., Science, 350, (2015)

[2] Forget et al., J. Geophys. Res., 104, 24155-24175, (1999)

[3] Gonzalez-Galindo, F. et al., J. Geophys. Res., 114, E04001, (2009)

[4] Gonzalze-Galindo, F. et al., J. Geophys. Res., 120, 2020-2035, (2015)

[5] Chaufray, J-Y et al., Icarus, 245, 282-294, (2015)

[6] Parshev, V.A., Preprint N 387, Space Sci. Inst., USSR Academy of Science, (1978)

[7] Krasnopolsky, V., Icarus, 101, 313-332, (1993)

[8] Krasnopolsky, V., J. Geophys. Res., 107, E12, 5128, (2002)

How to cite: Chaufray, J.-Y., Gonzalez-Galindo, F., Forget, F., Gilli, G., Millour, E., Leblanc, F., Modolo, R., and Lopez-Valverde, M.: 3D model of the Martian thermosphere with PCM-Mars : Comparison between the simulated CO2, N2, Ar and the MAVEN/NGIMS measurements, Europlanet Science Congress 2024, Berlin, Germany, 8–13 Sep 2024, EPSC2024-317, https://doi.org/10.5194/epsc2024-317, 2024.

08:55–09:05
|
EPSC2024-656
|
ECP
|
On-site presentation
Francisco Brasil, Pedro Machado, Gabriella Gilli, Alejandro Cardesin-Moinelo, José E. Silva, Daniela Espadinha, Daniela Tirsch, Klaus-Dieter Matz, Thomas Roatsch, Lucie Riu, John Carter, and Colin Wilson

Atmospheric gravity waves (GWs) are mesoscale atmospheric oscillations that propagate vertically in stable, stratified planetary atmospheres [1], significantly shaping weather and climate by influencing temperature, wind patterns, and cloud formations. In this study, we present preliminary results of GWs in the Martian atmosphere using the High-Resolution Stereo Camera (HRSC) [2] onboard the European Mars Express (MEx) spacecraft [3]. By taking advantage of high-altitude observations (200-800 m/px) with a field of view from limb to limb, we can investigate the morphological and dynamical properties of GWs. Previous studies using the OMEGA instrument [4] were limited by a narrow field of view, preventing them from capturing the full extent of wave packets.

We have morphologically characterised the wave packets in the high-altitude observations, considering the number of crests, horizontal wavelength, packet width and length, and orientation. Additionally, we retrieved cloud heights using a new method adapted from [5] that utilises the RGB channels of HRSC to measure the altitudes of waves present in the images. In addition to pairs of high-altitude observations taken 30 minutes apart, we estimated wind speeds by tracking the displacement of features between the two images.

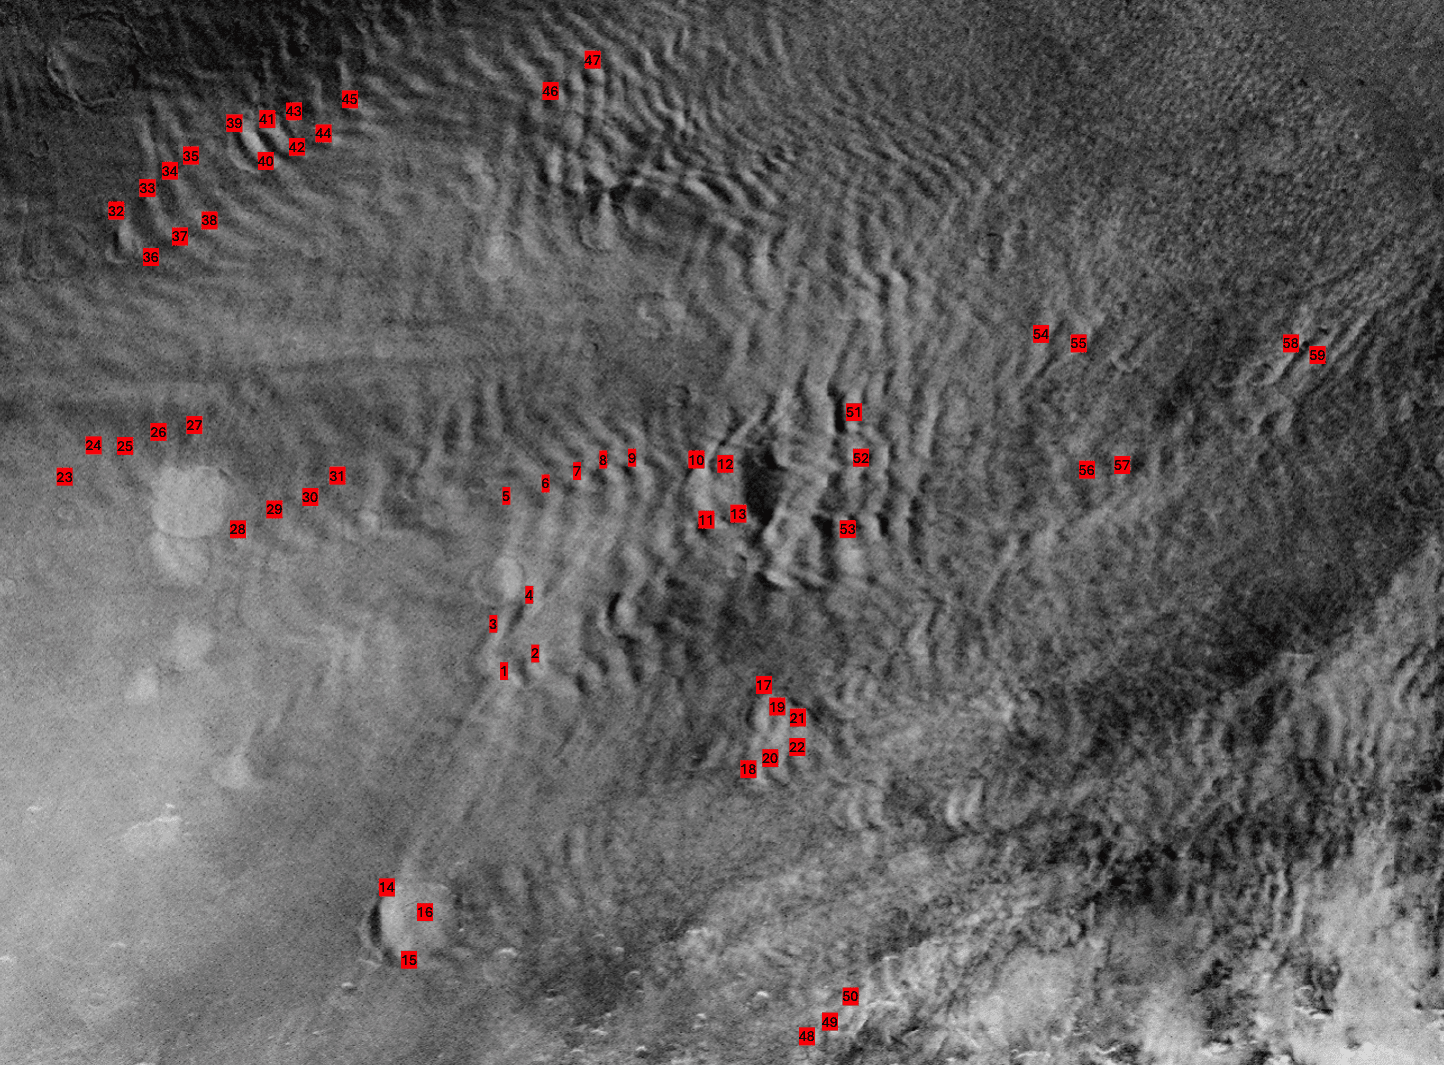
Our findings indicate a varied range of altitudes for different cloud types, including water ice clouds ranging from 15-45 km (±5 km error), CO₂ ice clouds from 60-85 km (±5 km error), and dust clouds from 5-10 km (±3 km error). Wind speeds of 5-15 m/s (±10% error) were estimated, and we created regional wind maps across cloud-rich regions (Figure 1). These wind maps reveal the dynamics of mesoscale cloud structures, illustrating how GWs influence wind patterns across the Martian atmosphere. Future research will incorporate OMEGA's spectral data to classify cloud types accurately.


Figure 1 - Gravity waves detected in high-altitude HRSC observations of the region at 40°S, 70°W during Mars Year 36. Red markers pinpoint specific features in wave packets (50 tracers), measured in paired images taken 34 minutes apart. These coordinates are used to calculate wind speeds, aiding in the creation of wind maps with velocities ranging from 5 to 15 m/s, with an error margin of 10%.


Acknowledgements: This work was supported by the Portuguese Fundação Para a Ciência e a Tecnologia of reference PTDC/FIS-AST/29942/2017, through national funds and by FEDER through COMPETE 2020 of reference POCI-01-0145-FEDER-007672, and through a grant of reference 2021.05455.BD. GG acknowledges financial support from Junta de Andalucia through the program EMERGIA 2021 (EMC21_00249) and from the Severo Ochoa grant CEX2021-001131-S funded by MCIN/AEI/ 10.13039/501100011033. IAA is also supported by grant ID2022-137579NB-I00 funded byMCIN/AEI/10.13039/501100011033 and by “ERDF A way of making Europe”. Funded by the ESA Faculty Research Contract and Science Exchange Programme, which is in the frame of the MWWM - Mars Wind and Wave Mapping project of reference ESA RFP/3-17570/22/ES/CM. We thank the Mars Express Team for their support and encouragement in starting this work.


References:

[1] Fritts, D. C., & Alexander, M. J. (2003). Gravity wave dynamics and effects in the middle atmosphere. Reviews of geophysics, 41(1).

[2] Jaumann, R., et al., 2007. The high-resolution stereo camera (HRSC) experiment on Mars Express: Instrument aspects and experiment conduct from interplanetary cruise through the nominal mission. Planetary and Space Science 55, 928-952.

[3] Cardesin-Moinelo, A., et al., 2024. Mars Express: 20 Years of Mission, Science Operations and Data Archiving. Space Science Reviews, 220(2), 25.

[4] Brasil, F., et al., 2024. Atmospheric Gravity Waves in Mars’s Lower Atmosphere: Nadir Observations from OMEGA/Mars Express data. Astronomy and Astrophysics (under revision).

[5] Scholten, F., et al., 2010. Concatenation of HRSC colour and OMEGA data for the determination and 3D-parameterization of high-altitude CO2 clouds in the Martian atmosphere. Planetary and Space Science58(10), 1207-1214.

How to cite: Brasil, F., Machado, P., Gilli, G., Cardesin-Moinelo, A., Silva, J. E., Espadinha, D., Tirsch, D., Matz, K.-D., Roatsch, T., Riu, L., Carter, J., and Wilson, C.: Morphological and dynamical characterisation of Gravity Waves on Mars atmosphere using the High-Resolution Stereo Camera on Mars Express, Europlanet Science Congress 2024, Berlin, Germany, 8–13 Sep 2024, EPSC2024-656, https://doi.org/10.5194/epsc2024-656, 2024.

09:05–09:10
09:10–09:20
|
EPSC2024-685
|
On-site presentation
Ed Thiemann, Stephen Bougher, Collin Payne, Nicholas Jones, Erdal Yiğit, Federico Gasperini, and Francis Eparvier

Introduction:  The Extreme Ultraviolet Monitor (EUVM) onboard the Mars Atmosphere and Volatile EvolutioN (MAVEN) orbiter measures thermospheric density from about 110 to 200 km via solar occultations using its 17-22 nm channel in addition to EUVM’s primary solar irradiance measurement [1]. The EUVM solar occultation (SO) data record [2] ranges from late 2014 through the present (2024), spanning nearly an entire solar cycle and 5 Mars years. Features inherent to solar occultations, namely their insensitivity to absolute calibration and inherently fixed local time, allow for the characterization of long-term variability of the upper atmosphere. 

Solar EUV Variability:  Solar EUV irradiance is the primary energy input to the Mars upper atmosphere. The EUVM SO data are analyzed for the dependence of exospheric temperature on solar EUV forcing. In general, these results are consistent with prior measurements of exospheric temperature sensitivity to EUV irradiance. However, the extensive nature of the EUVM SO data, spanning 5 Mars Years and much of a solar cycle, show that EUV temperature sensitivity varies between dawn and dusk and across seasons: The EUV temperature sensitivity tends to be higher at dawn and weaker at aphelion.

Latitudinal and Local Time Structure:  The EUV-induced variability is detrended from the EUVM SO data in order to characterize latitudinal and local time dependences. Thermospheric Polar Warming is evident in the winter pole at perihelion, as expected from measurements prior to MAVEN’s arrival at Mars. The EUVM SO data also show the first conclusive Thermospheric Polar Warming at the winter pole at aphelion [3]. This warming is observed to increase with the increase of dust in the summer hemisphere.

Seasonal Variability: The EUV-detrended data are also characterized for seasonal variability. Globally, there is no discernable seasonal variability beyond the modulation of solar EUV irradiance due to the Mars orbit eccentricity.

Sensitivity to Gravity Waves: The Mars Global Ionosphere Thermosphere Model (MGITM) [4] with a whole atmosphere nonlinear gravity wave parametrization [5] is compared to the EUVM SO observations to determine when small-scale gravity waves significantly influence exospheric temperature by adding and removing gravity waves to the model. In many cases, but not all, the inclusion of gravity waves in MGTIM yields better model-measurement agreement.

References:

[1] Eparvier, F. G., et al. Space Science Reviews 195 (2015): 293-301. [2] Thiemann, E. M. B., et al. Journal of Geophysical Research: Planets 123.9 (2018): 2248-2269. [3] Thiemann, Edward MB, et al. Geophysical Research Letters 51.5 (2024): e2023GL107140. [4] Bougher, S. W., et al. Journal of Geophysical Research: Planets 120.2 (2015): 311-342. [5] Yiğit, Erdal, et al. Journal of Geophysical Research: Atmospheres 114.D7 (2009).

How to cite: Thiemann, E., Bougher, S., Payne, C., Jones, N., Yiğit, E., Gasperini, F., and Eparvier, F.: The Mars Thermosphere Terminator Structure and Variability Over a Solar Cycle., Europlanet Science Congress 2024, Berlin, Germany, 8–13 Sep 2024, EPSC2024-685, https://doi.org/10.5194/epsc2024-685, 2024.

09:20–09:30
|
EPSC2024-795
|
On-site presentation
Lauriane Soret, Jean-Claude Gérard, Francisco Gonzalez-Galindo, Ian Thomas, Bojan Ristic, Yannick Willame, Ann Carine Vandaele, and Benoît Hubert

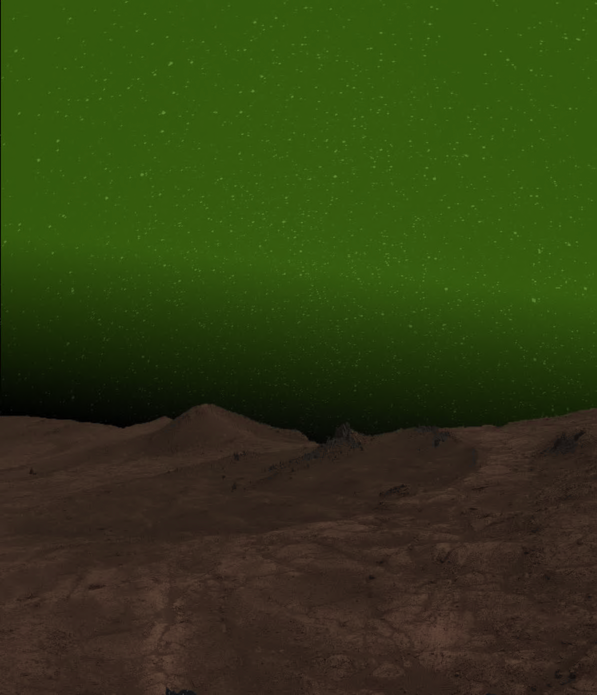
The discovery of the first visible nightglow is a promising tool to deepen our knowledge of the dynamics of the Martian upper atmosphere (Figure 1). Gérard et al. (2023) discovered the O2 Herzberg II system between 400 and 650 nm in the nightglow, using TGO/NOMAD/UVIS limb observations. Signatures of the O2 visible nightglow have been detected in the polar winter regions (Figure 2), similarly to the extensively observed NO ultraviolet nightglow (Schneider et al., 2020). These seasonal brightenings at high latitudes confirm the global transport of O and N atoms ascending from the sunlit summer polar regions and carried downward by vertical winds and diffusion to the 40-60 km region of the dark winter atmosphere.


Figure 1: Artist view of the O2 nightglow over the red planet (ESA press release).

Figure 2: Distribution of detections of the O2 Herzberg II nightglow (Gérard et al., 2023).

A NOMAD/UVIS campaign dedicated to the observation of the southern pole during the winter season occurred between May and October 2023. Spectra acquired both in the inertial and limb tracking modes have been analyzed to estimate the intensity of the O2 emission and its latitudinal variability. Limb profiles have also been generated (Soret et al., in prep). Moreover, NOMAD/UVIS is the first instrument able to simultaneously monitor the UV and visible domains in the Martian atmosphere, so that the NO and O2 emissions can be directly compared. Soret et al. (in prep) showed that the NO emission layer generally occurs ~10 km higher than the O2 layer. Comparison with Mars PCM (v6) simulations shows that the O2 nightglow is generally well reproduced, but the simulated NO nightglow occurs higher than observed.

Previous studies however pointed out that an asymmetry is observed between the southern and the northern winter polar regions, regarding the brightness of the NO nightglow (Schneider et al., 2020) and the O2 infrared nightside emission at 1.27 μm (Bertaux et al., 2012). Therefore, a NOMAD/UVIS dedicated campaign has been planned to monitor the northern winter pole region. The campaign is currently ongoing. The present study aims to confirm the NO asymmetry observed by MAVEN and to verify whether the same conclusions apply to the Herzberg II visible nightglow. We quantify the possible differences in terms of intensity and altitude of the emitting layer.

This comparative study provides valuable constraints for improving 3-D models that simulate global circulation and dynamic processes. In particular, it will help solving the current discrepancy between the predicted and modeled altitude distribution of the NO nightglow that is currently overestimated.

References:

Bertaux et al. (2012). First detection of O2 1.27 µm nightglow emission at Mars with OMEGA/MEX and comparison with general circulation model predictions, JGR, 117, E00J04, doi:10.1029/2011JE003890.

Gérard et al. (2023). Observation of the Mars O2 visible nightglow by the NOMAD spectrometer onboard the Trace Gas Orbiter. Nature Astronomy, https://doi.org/10.1038/s41550-023-02104-8

Schneider et al. (2020). Imaging of Martian circulation patterns and atmospheric tides through MAVEN/IUVS nightglow observations. JGR Space Physics 125(8), e2019JA027318.

Soret et al. (in prep). Ultraviolet NO and visible O2 nightglow in the Mars southern winter polar region: statistical study and model comparison.

How to cite: Soret, L., Gérard, J.-C., Gonzalez-Galindo, F., Thomas, I., Ristic, B., Willame, Y., Vandaele, A. C., and Hubert, B.:  North/south asymmetries of the Mars NO ultraviolet and O2 visible nightglow using TGO/NOMAD/UVIS observations, Europlanet Science Congress 2024, Berlin, Germany, 8–13 Sep 2024, EPSC2024-795, https://doi.org/10.5194/epsc2024-795, 2024.

09:30–09:40
|
EPSC2024-738
|
On-site presentation
Ehouarn Millour, Antoine Bierjon, Francois Forget, Aymeric Spiga, Chao Wang, and The Mars PCM Team

The Mars Planetary Climate Model (PCM)

The Mars Planetary Climate Model (Mars PCM, or MPCM) [1] is a Global Climate Model (GCM) initially developed at the Laboratoire de Météorologie Dynamique [2] that has matured to become a community model developed in collaboration with many teams around the world (LATMOS, the Instituto de Astrofisica de Andalucia, UAE University, University of Oxford, The Open University), and with the support of ESA (European Space Agency) and CNES (French Space Agency). The Mars PCM simulates the Martian atmosphere from the subsurface to the subsurface to the exobase and includes detailed parametrizations to adequately represent the main cycles of dust, water and CO2 that control the current Martian climate. It also includes some additional modules accounting for chemistry, thermospheric and ionospheric processes.


The Mars PCM is freely distributed, via a dedicated subversion repository [4] to keep track of code updates and a MediaWiki [5] for user documentation.


As the Mars PCM, once some improvements have been added, is used to regularly generate new versions MCD, Mars PCM version numbering follows those used for MCD: The latest version of the MCD, MCDv6.1 [3], was thus produced with Mars PCM version 6, whereas previous major MCD version, MCD v5.3 [6] was produced using Mars PCM version 5. Without going in the details of all the changes and improvements going from Mars PCM v5 to Mars PCM v6, let us merely mention here that one of the main ones concerns the dust cycle related parametrizations.


Mars PCM version 5 dust cycle parametrizations

The scheme, and modeling strategy are essentially those described in [7] which can be summarized as follows:

  • The (very nonlinear and poorly known) physical processes leading to dust lifting are not represented, instead lifting of dust is assumed to occur everywhere and all the time, but the overall dust column is re-normalized to follow imposed “dust scenarios” (such as those produced from observations [8])

  • Dust is handled as a distribution of particles (via its two first moments) to correctly account for varying particle sizes. As a tracer it is affected by all dynamical and physical processes such as large scale advection, turbulence, sedimentation, etc. In that sense the scheme is said to be “semi-interactive” as only the column amount is prescribed but not the vertical distribution of dust.


Mars PCM version 6 dust cycle parametrizations

One of the main flaws of the Mars PCM version 5 dust cycle representation is that the resulting vertical distribution of dust displays an accumulation of dust near the surface fails to produce any of the detached layer that are observed[9]. In addition, re-scaling the column amount of dust also has the drawback (as input “dust scenarios” contain one value per day) of imposing an unrealistic diurnal cycle of the airborne dust.

The dust cycle parametrizations have thus been revised as to:

  • inject dust in the system via a “rocket dust storm parametrization” [9], which leads to the generation of dust detached layers. Alongside this way to inject the dust in the system (note that the physics of the lifting of the dust from the surface is not accounted for in this framework) comes the question of when, in terms of time of day, to inject the dust in the system. Our investigations show that in practice injecting at all times of day, although possibly not too realistic, yields reasonable results.

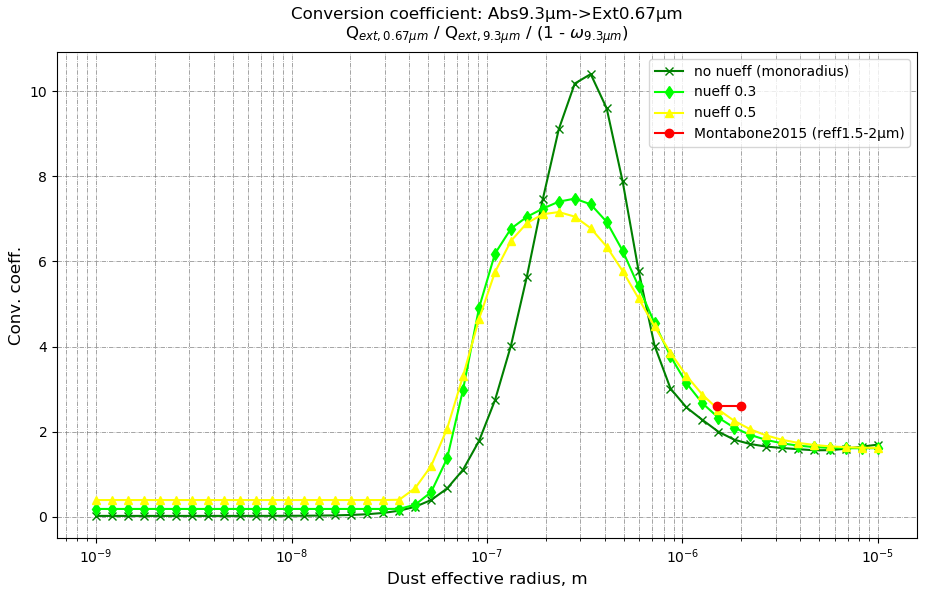
  • determine the amount of dust to inject depending on what is already present in the column versus what is given in the target dust scenario, which enables to have a physically driven diurnal cycle of airborne dust. In addition, when converting from the opacities from the dust maps from [8], which are expressed in the infrared as absorption at 9.3 microns, to visible extinction at 0.67 microns (used by the radiative transfert in the PCM), the actual effective radius of dust (inferred by the PCM) is used, rather than a fixed 2.6 ratio as was done in PCMv5 (see figure1).

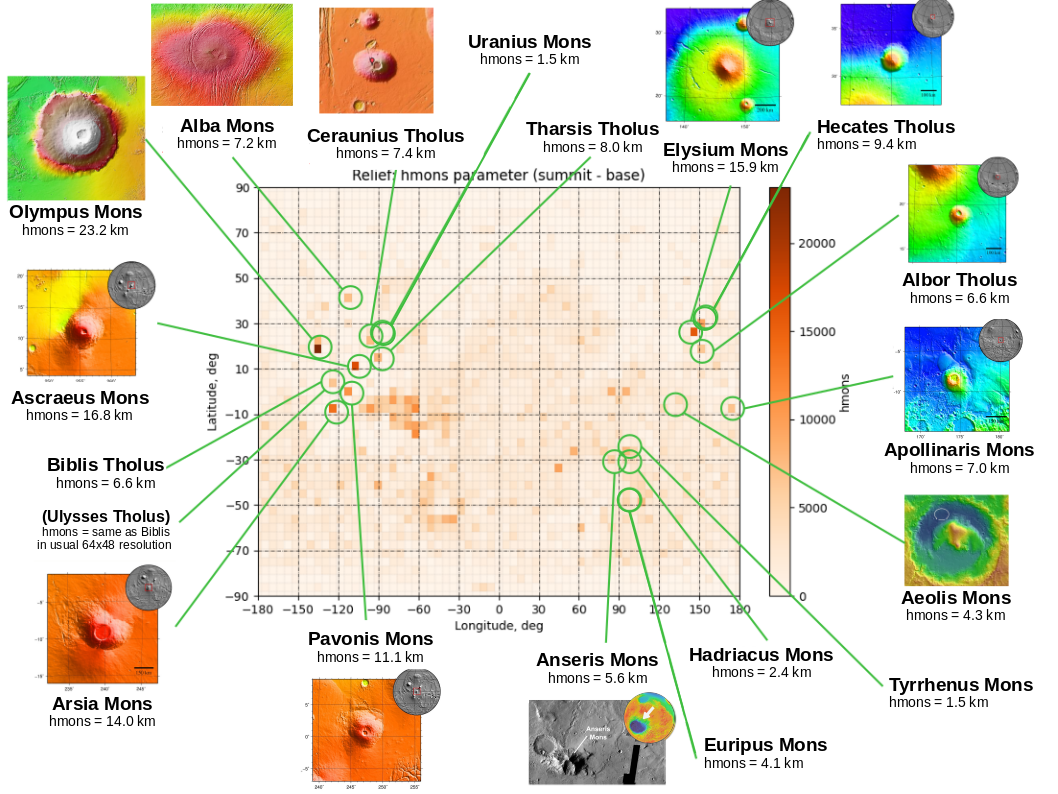
  • Account, via a sub-grid scale parametrization, for the high altitude recycling of near-surface dust by anabatic winds along the flanks of large volcanoes (a funneling of dust which is obtained in mesoscale simulations which have a sufficiently high horizontal resolution to resolve these extreme topographies [10]). In practice, this parametrization is only triggered on PMC grid points containing the 19 largest volcanoes (see Figure 2) and improves the representation of overall airborne dust during the clear season.


Figure 1: Conversion coefficient between infrared (absorption at 9.3 microns) opacities and visible (extinction at 0.67 microns) opacities, based on tabulated properties from a T-matrix code for various ranges of dust effective radii and dust distribution variances (green and yellow lines). Is also shown (in red) the 2.6 value from [8], based on the assumption of dust effective radii of 1.5 to 2 microns

Figure 2: Illustration, on a global topography map of Mars at the Mars PCM resolution (center) of the location of the 19 Mons where the parametrization of the recycling of dust due to anabatic winds along the flanks of volcanoes is applied.

References

[1] Forget F. et al. (2022) 7th International Workshop on the Mars Atmosphere: Modeling and Observations.

[2] Forget F. et al. (1999) J. Geophys. Res., 104, 24,155-24,176.

[3] Millour E. et al. (2024) 10th International Conference on Mars.

[4] http://svn.lmd.jussieu.fr/Planeto/trunk

[5] https://lmdz-forge.lmd.jussieu.fr/mediawiki/Planets

[6] Millour E. et al. (2018) “From Mars Express to ExoMars” Scientific Workshop abstract.

[7] Madeleine J.-B. et al. (2012) J. Geophys. Res., 116, E11.

[8] Montabone L. et al. (2024) EuroPlanet Science Congress abstract.

[9] Wang C. et al. (2018) J. Geophys. Res., 123, pp. 982.

[10] Rafkin S. et al. (2002) Nature, 419, 6908, pp. 697-699.


How to cite: Millour, E., Bierjon, A., Forget, F., Spiga, A., Wang, C., and Mars PCM Team, T.: Improving the vertical distribution of airborne dust in the Mars PCM, Europlanet Science Congress 2024, Berlin, Germany, 8–13 Sep 2024, EPSC2024-738, https://doi.org/10.5194/epsc2024-738, 2024.

09:40–09:50
|
EPSC2024-989
|
ECP
|
On-site presentation
Alexander Stott, Naomi Murdoch, Martin Gillier, David Mimoun, Manuel de la Torre Juarez, Jose Antonio Rodriguez-Manfredi, Sylvestre Maurice, Baptiste Chide, and Ralph Lorenz

Introduction:

The winds are an important dynamic for Mars, changing the surface of the planet to this day. These wind flows are often turbulent, either convective during the day or more shear flows from topographically induced instabilities. This turbulent variation represents one of the fastest changing dynamics taking place on Mars. As a result, its full characterisation is of interest. Here, we will show the use of the microphone data collected by the Perseverance mission to inform on the highest frequencies of turbulence [1,2]. First, we will present the characteristics of wind speed time series inferred from the SuperCam microphone through a machine learning model developed in [3]. This highlights a range of gust timescales from 1-10s as well as both isolated gusts (perhaps due to intermittent turbulence) and also consistently gusty periods. Next, we demonstrate that the microphone spectra can be used to analyse the dissipative regime of turbulence on Mars. This is at the highest frequencies where the energy is removed through viscous forces. This provides an estimate of the Kolmogorov lengthscale and dissipation rate on Mars, as well as friction velocity, useful for model comparisons.

The microphone signal:

A dedicated campaign was performed on Mars to record background, ambient, winds with the microphone across different times of sol without the influence of acoustic sources from the rover. These recordings are each 167 s long and recorded at 25k samples per second [1]. This high sampling rate means that the microphone spectra cover the highest frequencies of turbulent fluctuations, at the dissipation regime where the energy is dissipated by viscous forces [2]. On Mars, dissipation is expected to occur at lower frequencies than on Earth. We use the microphone data to quantify the behaviour at the transition between the inertial and dissipative regime.

In an outdoor environment, the dominant mechanism for generating wind noise on microphone data is through the stagnation pressure [4,5]. This is the pressure fluctuations induced by the microphone blocking a wind flow. This is in agreement with the observations by the SuperCam microphone on Mars [3]. The resulting sensitivity of the microphone data to the wind was used to extract estimates of wind speed at high frequencies [3]. Moreover, as demonstrated in microphone wind noise models [4,5], the pressure fluctuations recorded by the microphone are a transduction of turbulent wind variations, modified by a transfer function. As a result, the spectra of the microphone data from Mars can be interpreted in terms of the turbulence spectra of the wind in the surface layer of Mars.

Winds and intermittent turbulence:

In [3] we proposed a machine learning (Gaussian process regression) model to extract a wind speed estimate from the microphone data. These wind speeds were shown to be suitable to examine turbulent intensity, and shown gusting characteristics ranging from 1-10s. This highlights that the wind gust characteristics change. The behaviour of the gusting can be due to the intermittency of the turbulence, whether the wind flow has entered a regime of consistent turbulence or whether it is more sporadic [6]. Subsequently, the Perseverance rover has moved over a wider range of topography driving up to the rim of Jezero crater. The statistical assessment of the microphone data over this time can be used to aid the meteorological data studies from the dedicated MEDA (Mars environmental dynamics analyser) pressure and temperature sensors onboard Perseverance.

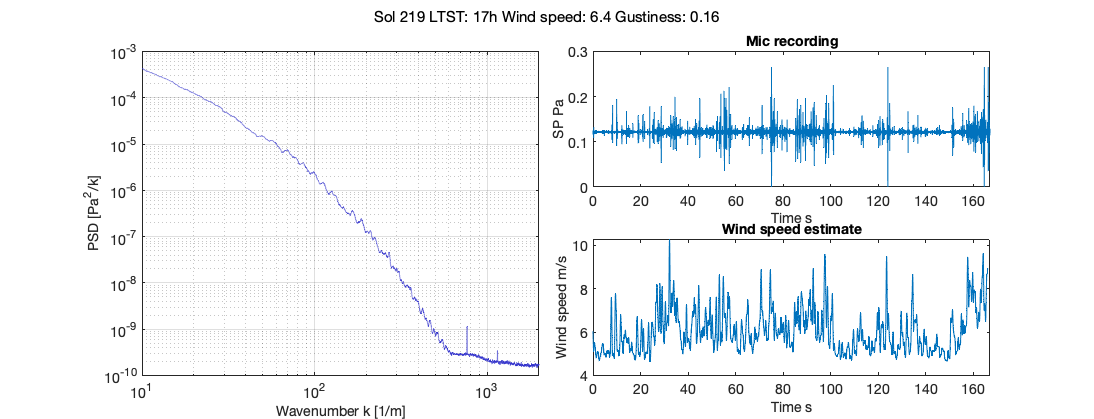
Figure 1: (Left) Transfer function corrrected spectrum for a microphone recording on Mars. (Right top) Sound pressure level from microphone recording. (Right bottom) wind speed estimate from microphone recording using method in [3].

Turbulent spectra:

Spectra of wind flows are commonly used to describe turbulent behaviour. Energy is injected at large scales in the source region before cascading to smaller scale eddies in the inertial regime. Classically this inertial regime is characterized by the Kolmogorov power law of -5/3. However, this requires the measurement in an isotropic flow and and so is difficult to identify in measurements, which are a superposition of several effects [7]. Figure 1 shows an example of a spectrum for a microphone recording during a period of consistent gusting, along with the wind speed estimate from [3]. The spectrum in Figure 1 shows a curve between two regions, which we interpret to be the transition between the inertial and dissipative regime on Mars. Calculating the corner frequency of this curve yields an estimate of the Kolmogorov lengthscale, η, which is 0.014 m for this recording. This lengthscale is calculated for recordings over the mission with good SNR, leading to values η= 0.005-0.05 m, which are close to those expected [8].  This estimate can be used to calculate values of the dissipation rate and friction velocity, without applying assumptions based on extrapolations from Earth. As such, this can be a useful tool for model parameterization.

Conclusion

We present an analysis of Martian wind flows from microphone recordings by the SuperCam instrument on the Perseverance rover. As the microphone records at a high frequency (for atmospheric instruments so far operating on Mars) we use it to characterise the turbulent properties of the wind flow. This leads to information on the distribution of gusts and their intermittency, as well as the observation of turbulent energy dissipation on Mars. The microphone can also examine turbulence through the propagation of sound, as in [9,10]. Combining these results along with those from the dedicated weather station of MEDA at larger scales can help provide a detailed picture of turbulent behaviour on Mars and its relationship with dust and topography over seasons.


References 

[1] Mimoun et al. (2023), SSR

[2] Maurice et al. (2022), Nature

[3] Stott et al. (2023), JGR:Planets

[4] Raspet et al. (2006), JASA

[5] Van den Berg et al. (2006), JASA

[6] Allouche et al. (2021), Journal of the atmospheric sciences

[7] Murdoch et al. (2023), PSJ

[8] Petrosyan et al. (2011), Review of Geophysics

[9] Chide et al, (2024) JASA

[10] Gillier et al. (2024) JGR: Planets

How to cite: Stott, A., Murdoch, N., Gillier, M., Mimoun, D., de la Torre Juarez, M., Rodriguez-Manfredi, J. A., Maurice, S., Chide, B., and Lorenz, R.: The Distribution of Short-term Wind Gusts and the Dissipation Regime of Turbulence on Mars with the SuperCam Microphone, Europlanet Science Congress 2024, Berlin, Germany, 8–13 Sep 2024, EPSC2024-989, https://doi.org/10.5194/epsc2024-989, 2024.

09:50–10:00
Coffee break
Chairpersons: Francisco González-Galindo, Gabriella Gilli, James Holmes
10:30–10:40
|
EPSC2024-1117
|
On-site presentation
Claire Newman, Stephen Lewis, Aymeric Spiga, Francois Forget, Jorge Pla Garcia, Maria Ruiz, Orkun Temel, Ozgur Karatekin, Cem Berk Senel, Donald Banfield, Jose Antonio Rodriguez Manfredi, Sara Navarro, Alain Lepinette, Lucas Lange, Nils Mueller, Matthias Grott, Tilman Spohn, Constantinos Charalambous, and Ralph Lorenz

While its primary objectives were to study the interior of Mars and its present day seismic activity, the InSight lander also carried several meteorological sensors (primarily needed to differentiate true seismic signals from those produced by wind or passing vortices, or as part of a heat flow experiment) as well as cameras which could be used to monitor atmospheric and surface changes [1-6]. Although power became increasingly limited due to dust build-up on the lander’s solar panels [7], InSight’s Pressure Sensor measured nearly continuously at up to 20Hz for ~1.25 Mars years, giving the highest frequency pressure dataset yet obtained on Mars [8,9]. The Temperature and Winds for InSight (TWINS) instrument consisted of two booms pointing in opposite directions (such that at least one sensor would measure winds from a given direction with minimal influence from lander hardware). Each boom measured air temperature and winds at 1Hz nearly continuously for over one Mars year [8,10]. The Heat Flow and Physical Properties Package (HP3) regularly measured the diurnal variation of surface temperature [11,12], while aeolian observations revealed that vortices rather than linear wind stress were associated with the majority of particle motion events [10,13]. We will provide an overview of InSight’s meteorological and aeolian datasets, and show how we are using them to validate the predictions of four global and four mesoscale atmospheric models of InSight’s landing site in Elysium Planitia. The models used include Aeolis Research’s multiscale MarsWRF model (run at global and mesoscales) [14,15], the Open University’s global Mars model (in the form of the OpenMars reanalysis dataset, produced via data assimilation) [16], the global Mars version of LMD’s Planetary Climate Model [17], LMD’s mesoscale Mars model [18], and the Belgian version of the MarsWRF global model [19]. This work goes beyond previous pre-landing multi-model intercomparison and prediction efforts [e.g., 14] by assessing the performance of models against data and attempting to understand the reasons for differences, with the dual goals of better understanding the causes of weather phenomena at InSight and of improving Mars atmospheric model predictions of the near-surface environment. This is vital not only for improving future landing site predictions (which are key to planning Entry-Descent-Landing and surface mission operations), including the expected dust clearing from solar panels [7,20], but also for Mars science in general, such as improving the prediction of near-surface wind and dust lifting globally in order to better simulate the martian dust cycle and dust storms [21]. 

[1] Banfield, D., Rodriguez-Manfredi, J.A., Russell, C.T. et al. InSight Auxiliary Payload Sensor Suite (APSS). Space Sci Rev 215, 4 (2019). https://doi.org/10.1007/s11214-018-0570-x

[2]Spiga, A., Banfield, D., Teanby, N.A. et al. Atmospheric Science with InSight. Space Sci Rev 214, 109 (2018). https://doi.org/10.1007/s11214-018-0543-0

[3] Murdoch, N., Kenda, B., Kawamura, T. et al. Estimations of the Seismic Pressure Noise on Mars Determined from Large Eddy Simulations and Demonstration of Pressure Decorrelation Techniques for the Insight Mission. Space Sci Rev 211, 457–483 (2017). https://doi.org/10.1007/s11214-017-0343-y

[4] Spohn, T., Grott, M., Smrekar, S.E. et al. The Heat Flow and Physical Properties Package (HP3) for the InSight Mission. Space Sci Rev 214, 96 (2018). https://doi.org/10.1007/s11214-018-0531-4

[5] Maki, J.N., Golombek, M., Deen, R. et al. The Color Cameras on the InSight Lander. Space Sci Rev 214, 105 (2018). https://doi.org/10.1007/s11214-018-0536-z

[6] Golombek, M., Grott, M., Kargl, G. et al. Geology and Physical Properties Investigations by the InSight Lander. Space Sci Rev 214, 84 (2018). https://doi.org/10.1007/s11214-018-0512-7

[7] Golombek, M., Hudson, T., Bailey, P. et al. Results from InSight Robotic Arm Activities. Space Sci Rev 219, 20 (2023). https://doi.org/10.1007/s11214-023-00964-0

[8] Banfield, D., Spiga, A., Newman, C. et al. The atmosphere of Mars as observed by InSight. Nat. Geosci. 13, 190–198 (2020). https://doi.org/10.1038/s41561-020-0534-0

[9] Chatain, A., Spiga, A., Banfield, D., Forget, F., & Murdoch, N. (2021). Seasonal variability of the daytime and nighttime atmospheric turbulence experienced by InSight on Mars. Geophysical Research Letters, 48, e2021GL095453. https://doi.org/10.1029/2021GL095453

[10] Baker, M., Newman, C., Charalambous, et al. (2021). Vortex-dominated aeolian activity at InSight's landing site, Part 2: Local meteorology, transport dynamics, and model analysis. Journal of Geophysical Research: Planets, 126, e2020JE006514. https://doi.org/10.1029/2020JE006514

[11] Mueller, N. T., Knollenberg, J., Grott, et al. (2020). Calibration of the HP3 radiometer on InSight. Earth and Space Science, 7, e2020EA001086. https://doi.org/10.1029/2020EA001086

[12] Spohn, T., Krause, C., Golombeck, M. et al. (2024). Mars Soil Temperature and Thermal Properties from InSight HP^3 Data. ESS Open Archive .

https://doi.org/10.22541/essoar.170688827.75469589/v1

[13] Charalambous, C., McClean, J. B., Baker, M., et al. (2021). Vortex-dominated aeolian activity at InSight's landing site, Part 1: Multi-instrument observations, analysis, and implications. Journal of Geophysical Research: Planets, 126, e2020JE006757. https://doi.org/10.1029/2020JE006757

[14] Newman, C.E., M. de la Torre Juárez, J. Pla-García,  et al. (2021). Multi-model Meteorological and Aeolian Predictions for Mars 2020 and the Jezero Crater Region, Space Sci. Rev., 217 (20), https://doi.org/10.1007/s11214-020-00788-2

[15] Newman, C.E., Hueso, R., Lemmon, M., et al. (2022). The dynamic atmospheric and aeolian environment of Jezero crater, Mars, Sci Adv., 8 (21), eabn3783, https://doi.org/10.1126/sciadv.abn3783

[16] Holmes, J.A., Lewis, S.R., and Patel, M.R. (2020). OpenMARS: A global record of martian weather from 1999 to 2015, Planetary and Space Science (188), 104962, https://doi.org/10.1016/j.pss.2020.104962

[17] Lange, L., Forget, F., Banfield, D., et al. (2022). Insight pressure data recalibration, and its application to the study of long-term pressure changes on Mars. Journal of Geophysical Research: Planets, 127, e2022JE007190. https://doi.org/10.1029/2022JE007190

[18] Spiga, A., Forget, F., Madeleine, J.-B., et al. (2011). The impact of martian mesoscale winds on surface temperature and on the determination of thermal inertia, Icarus, 212 (2), 504-519, https://doi.org/10.1016/j.icarus.2011.02.001

[19] Temel, O., Senel, C.B., Porchetta, S., et al. (2021). Large eddy simulations of the Martian convective boundary layer: Towards developing a new planetary boundary layer scheme, Atmospheric Research, 250, 105381, https://doi.org/10.1016/j.atmosres.2020.105381

[20] Lorenz, R. D., Lemmon, M. T., Maki, et al. (2020). Scientific observations with the InSight solar arrays: Dust, clouds, and eclipses on Mars. Earth and Space Science, 7, e2019EA000992. https://doi.org/10.1029/2019EA000992

[21] Newman, C.E., Bertrand, T., Battalio, J.M., et al. (2021). Toward More Realistic Simulation and Prediction of Dust Storms on Mars, Bulletin of the AAS, 53 (4), https://doi.org/10.3847/25c2cfeb.726b0b65
 

How to cite: Newman, C., Lewis, S., Spiga, A., Forget, F., Pla Garcia, J., Ruiz, M., Temel, O., Karatekin, O., Berk Senel, C., Banfield, D., Rodriguez Manfredi, J. A., Navarro, S., Lepinette, A., Lange, L., Mueller, N., Grott, M., Spohn, T., Charalambous, C., and Lorenz, R.: The rich meteorological dataset of the InSight Mars mission., Europlanet Science Congress 2024, Berlin, Germany, 8–13 Sep 2024, EPSC2024-1117, https://doi.org/10.5194/epsc2024-1117, 2024.

Venus
10:40–10:55
|
EPSC2024-1151
|
solicited
|
On-site presentation
Heinz-Wilhelm Hübers, Heiko Richter, Urs Graf, Rolf Güsten, Bernd Klein, Jürgen Stutzki, and Helmut Wiesemeyer

Atomic oxygen is an important for the photochemistry in the mesosphere and thermosphere of Venus and can be used as tracer for atmospheric dynamics. The altitude range where it predominantly occurs is between 90 km and 130 km. It is mainly generated through photolysis of CO2 on the dayside. From there it is transported to the nightside by the subsolar to antisolar circulation. It accumulates near the antisolar point and recombines to molecular oxygen [1, 2 ,3, 4].

We have detected atomic oxygen on the dayside as well as on the nightside of Venus by measuring its ground-state transition at 4.7 THz (63.2 µm) with the upGREAT (German Receiver for Astronomy at Terahertz Frequencies) heterodyne spectrometer on board SOFIA (Stratospheric Observatory for Infrared Astronomy) [5]. This is a direct detection in contrast to most of past and current detection methods, which are indirect and rely on photochemical models to obtain atomic oxygen concentrations [1, 2]. The observations were made on Nov. 10, Nov. 11 and Nov. 13 2021. On each day the total measurement time was about 20 min with the 2.5-m diameter telescope of SOFIA pointing at Venus which was at an elevation of about 18.7°. The telescope provides a diffraction limited beam with 6.3 arcsec diameter, which is about five times smaller than the apparent diameter of Venus (29 arcsec). The phase of Venus was 42%. The 4.7-THz frequency channel of upGREAT has seven pixels in a hexagonal pattern separated by 13.6 arcsec. The central three pixels were pointed along the terminator. The atomic oxygen in the atmosphere of Earth was measured simultaneously with the atomic oxygen in the Venus atmosphere, with the latter being offset by 203 MHz due to the Doppler shift of Venus, which is 13 km/s. The telluric line was used for calibration of the Venus spectra (see Ref. 5 for details).

The data was analyzed with a radiative transfer code with the atomic oxygen in the Venus atmosphere modeled as a single layer with a constant temperature and constant density (for details see Ref. 5). The column density measured with upGREAT ranges from 0.7 to 3.8 x 1017cm-2 between 15:00 and 21:00 local time with a maximum on the dayside where atomic oxygen is generated. It decreases towards the day-night terminator, because of the increasing solar azimuth angle. At nighttime no trend of the column density is observable. Our measurements indicate that the circulation in the Venus atmosphere determines the distribution of atomic oxygen on the nightside. The observed average Venus continuum brightness temperature on the dayside is ~242 K, which is slightly below the brightness temperature on the nightside (~249 K) . This might be attributed to a difference of the opacity of the atmosphere on the dayside and nightside, i.e. the opacity on the nightside is slightly lower and the brightness temperature is determined by a lower atmospheric layer. The brightness temperatures correspond to altitudes between about 65 and 70 km, which is just above the cloud layer. The temperature of the atomic oxygen is ~156 K on the dayside and ~115 K on the nightside. Comparing this with the temperature profile of the Venus atmosphere this yields an altitude of around 100 km where most of the atomic oxygen is located.

The observation of the 4.7-THz transition of atomic oxygen by high-resolution terahertz spectroscopy provides new insights into the atmosphere of Venus. In the future it may enable detailed investigations of the Venusian atmosphere in the peculiar region between the two atmospheric circulation patterns.


[1] A. S. Brecht et al., Atomic oxygen distributions in the Venus thermosphere: Comparisons between Venus Express observations and global model simulations. Icarus 217, 759–766 (2012).

[2] L. Soret et al., Atomic oxygen on the Venus nightside: Global distribution deduced from airglow mapping. Icarus 217, 849–855 (2012).

[3] J.-C. Gérard, Aeronomy of the Venus upper atmosphere. in: Space Sci Rev. Venus III edited by B. Bézard et al., Springer Dordrecht (2017).

[4] G. Gilli, et al. Venus upper atmosphere revealed by a GCM: II. Model validation with temperature and density measurements. Icarus 366, 114432 (2021).

[5] H.-W. Hübers et al., Direct detection of atomic oxygen on the dayside and nightside of Venus, Nature Communications, 14:6812 (2023).


How to cite: Hübers, H.-W., Richter, H., Graf, U., Güsten, R., Klein, B., Stutzki, J., and Wiesemeyer, H.: Atomic oxygen on the dayside and nightside of Venus measured by SOFIA, Europlanet Science Congress 2024, Berlin, Germany, 8–13 Sep 2024, EPSC2024-1151, https://doi.org/10.5194/epsc2024-1151, 2024.

10:55–11:05
|
EPSC2024-126
|
ECP
|
On-site presentation
Antoine Martinez, Jean-Yves Chaufray, Sébastien Lebonnois, Francisco Gonzàlez-Galindo, Franck Lefèvre, and Gabriella Gilli
  • Introduction

       For twenty years, a Planetary Climate Model (PCM) has been developed for the Venus atmosphere, from the surface up to 250 km altitude ([2], [3], [4] and [5]), at “Institut Pierre-Simon Laplace” (IPSL), in collaboration with LMD (Paris), IAA (Granada) and LATMOS (Paris). With the recent implementation of the ion chemistry and ambipolar diffusion, Venus PCM (VPCM) is currently able to model the Venusian ionosphere and is validated with observations from Venus Express and Pioneer Venus.


  • Recent implementations

       Based on the works of [6,7], the VPCM was implemented with an ionospheric model including photoionization (13 for CO2, CO, O, NO, N2, N, H and O2) and ion chemistry (64 reactions for CO2+, CO+, O+, O2+, N2+, N+, H2O+, H3O+, HCO+, NO+, H+, C+, OH+, HCO2+ and e-), and a vertical ambipolar diffusion model. The electron temperature used in VPCM is based on the model of [8]. There is no electron impact or horizontal electromagnetic transport in this current version. These improvements are presented and discussed in more detail in [1]

The validation was performed using ion and electron number densities data from the Pioneer Venus (PV) and Venus Express (VEX) missions. These simulations provided the fields included in the Venus Climate Database 2.3 (VCD, see http://www-venus.lmd.jussieu.fr). 

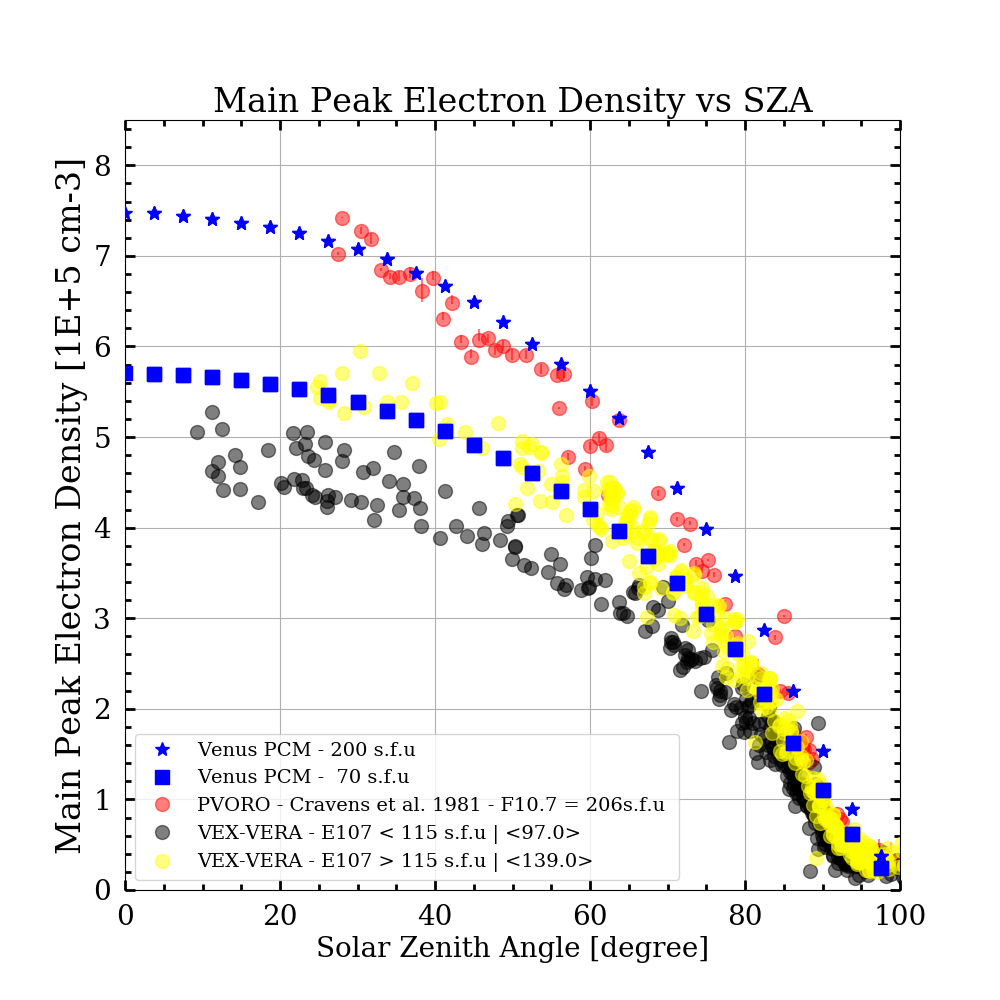
Figure 1: Electron number densities at the ionospheric peak versus solar zenith angle. Red circles correspond to PV data from [9] at high solar activity. Black and yellow circles correspond to the VEX observations for low solar activity and intermediate solar activity conditions, respectively. The number in brackets corresponds to the average E10.7 value for each selection of VEX-VERA data. This figure is taken from [1].


  • Results and Discussions

       The electron number density of the main Chapman electron peak simulated by the VPCM is consistent with the PV data of [9] from PV-ORO (Radio Occultation) observations (for high solar activity, see Figure 1). The VPCM well reproduces the evolution of the electron number density and its altitude with the solar zenith angle on the dayside. However, the VPCM overestimates by 15% the electron density peak at 140 km on the dayside at low solar activity

       The ambipolar diffusion for ions is necessary above 180 km altitude. With the addition of this process, the electron number density predicted by the VPCM is in good agreement with PV observations. Below 180 km, the photochemistry processes dominate over the ambipolar diffusion and its effects are negligible as expected. Yet, the VPCM fails to reproduce the electron variation on the nightside, probably due to an underestimation of ion transport from day to night, linked to the absence of electromagnetic horizontal transport process. Day-to-night ion transport and ion chemistry will be explored in future work in order to improve the Venus PCM.

Acknowledgements

       The PV-OIMS neutral densities are obtained from the Planetary Data System (PDS) (https://pds.nasa.gov/). The Venus Express/Vera data set was provided by the RIU team (Cologne University). This work was funded by ESA under the contract No. 4000130261/20/NL/CRS. The VPCM simulations were done thanks to the High-Performance Computing resources of “Tres Grand Centre de Calcul” under the allocation n°A0140110391 made by Grand Equipement National de Calcul Intensif. G.G. and A.M. acknowledge financial support from Junta de Andalucía through the program EMERGIA 2021 (EMC21 00249). The IAA team (A.M., F.G.-G., G.G.) also acknowledge financial support from the Severo Ochoa grant CEX2021-001131-S funded by MCIN/AEI/ 10.13039/501100011033. J.-.Y.C is supported by the Programme National de Planétologie (PNP, France) of CNRS-INSU co-funded by CNES and Programme National Soleil Terre (PNST, France) of CNRS-INSU co-funded by CNES and CEA.


References

[1] Martinez, A., Chaufray, J.-Y., Lebonnois, S., Gonzàlez-Galindo, F., Lefèvre, F. and Gilli, G. Icarus, 415:116035, June 2024.

[2] Lebonnois, S., Hourdin, F., Eymet, V., Crespin, A., Fournier, R., Forget, F., 2010. J. Geophys. Res. (Planets) 115, 6006. https://doi.org/10.1029/2009JE003458.

[3] Lebonnois, S., Sugimoto, N., Gilli, G., 2016. Icarus 278, 38–51. https://doi.org/10.1016/j.icarus.2016.06.004.

[4] Stolzenbach, A., Lefèvre, F., Lebonnois, S., & Määttänen, A. (2023). In Icarus (Vol. 395, p. 115447). Elsevier BV. https://doi.org/10.1016/j.icarus.2023.115447

[5] Martinez, A., Lebonnois, S., Millour, E., Pierron, T., Moisan, E., Gilli, G., Lefèvre, F., Icarus, 2023, 115272, 0019-1035, https://doi.org/10.1016/j.icarus.2022.115272

[6] González-Galindo, F., J.-Y. Chaufray, M. A. López-Valverde, G. Gilli, F. Forget, F. Leblanc, R. Modolo, S. Hess, and M. Yagi, (2013), J. Geophys. Res. Planets, 118, 2105–2123, doi:10.1002/jgre.20150.

[7] Chaufray, J.-Y., Gonzalez-Galindo, F., Forget, F., Lopez-Valverde, M., Leblanc, F., Modolo, R., Hess, S., Yagi, M., Blelly, P.-L., and Witasse, O. (2014), J. Geophys. Res. Planets, 119, 1614–1636, doi:10.1002/2013JE004551.

[8] Theis, R. F., L. H. Brace, R. C. Elphic, and H. G. Mayr (1984), J. Geophys. Res., 89, 1477–1488. https://doi.org/10.1029/JA089iA03p01477

[9] Cravens, T. E., Kliore, A. J., Kozyra, J. U., & Nagy, A. F. (1981). In Journal of Geophysical Research (Vol. 86, Issue A13, p. 11323). American Geophysical Union (AGU). https://doi.org/10.1029/ja086ia13p11323


How to cite: Martinez, A., Chaufray, J.-Y., Lebonnois, S., Gonzàlez-Galindo, F., Lefèvre, F., and Gilli, G.: Three-Dimensional Venusian Ionosphere with the Venus PCM, Europlanet Science Congress 2024, Berlin, Germany, 8–13 Sep 2024, EPSC2024-126, https://doi.org/10.5194/epsc2024-126, 2024.

11:05–11:15
|
EPSC2024-654
|
ECP
|
On-site presentation
Daniela Espadinha, Pedro Machado, Javier Peralta, José Silva, and Francisco Brasil

As our neighbouring world, Venus stands as a pivotal planet in the study of planetary evolution. Its dense atmosphere, mostly composed of carbon dioxide makes it a unique laboratory for understanding terrestrial type planets with extreme greenhouse effect., not only within the solar system, but also beyond its boundaries. One of the most intriguing features of Venus’ atmosphere is its circulation, dominated by retrograde zonal winds which superrotate much faster than the planet itself and whose mechanisms are yet poorly understood.
Atmospheric gravity waves, oscillatory disturbances that propagate through stable stratified atmospheres, play a crucial role in the global circulation of a planet's atmosphere. These waves facilitate the horizontal and vertical transfer of energy, momentum, and chemical species, powering the weather system of the planet. Numerous studies have confirmed the presence of gravity waves across various wavelength ranges within Venus's atmosphere [1,2,3,4], meticulously mapping their behavior across the cloud deck. However, many questions remain unsolved and further research is needed to fully understand the impact of these waves on the Venusian atmosphere. In short, the study of atmospheric gravity waves is fundamental in deciphering the mechanisms behind phenomena like Venus's superrotation.
With this work we use observations from Akatsuki's Ultraviolet Imager (UVI) to search for wave-like structures on the dayside of Venus. Through analyzing data from Akatsuki's public database, we aim to assess the population of atmospheric waves, measuring their physical and dynamical properties, including crest number, horizontal wavelength, packet length, width, and orientation. We will also investigate their local time dependence and oscillation frequency in order to better constrain the role of atmospheric convection as an excitation source for these waves This research builds upon previous studies by Peralta et al. (2008)[1] and Silva et al. (2021)[3,4], furthering our understanding of atmospheric dynamics on Venus and shedding light on the mechanisms which drive it.


Acknowledgements: This work was supported by the Portuguese Fundação Para a Ciência e a Tecnologia of reference PTDC/FIS-AST/29942/2017, through national funds and by FEDER through COMPETE 2020 of reference POCI-01-0145-FEDER-007672, and through a grant of reference 2020.06389.BD.


[1] Peralta et al., Characterization of mesoscale gravity waves in the upper and lower clouds of venus from vex-virtis images. Journal of Geophysical Research: Planets, 113(E5), 2008.
[2] Piccialli et al., High latitude gravity waves at the venus cloud tops as observed by the venus monitoring camera on board venus express. Icarus, 227:94 111, 01 2014.
[3] Silva et al., Characterising atmospheric gravity waves on the nightside lower clouds of Venus: a systematic analysis, AA 649 A34, 2021.
[4] Silva et al., Atmospheric gravity waves in Venus dayside clouds from VIRTIS-M images, Icarus, Volume 415, 2024, 116076, ISSN 0019-1035.

How to cite: Espadinha, D., Machado, P., Peralta, J., Silva, J., and Brasil, F.: Exploring the Venusian Clouds: Dayside Atmospheric Gravity Waves with Akatsuki UVI instrument, Europlanet Science Congress 2024, Berlin, Germany, 8–13 Sep 2024, EPSC2024-654, https://doi.org/10.5194/epsc2024-654, 2024.

11:15–11:20
Pluto and exoplanets
11:20–11:30
|
EPSC2024-305
|
ECP
|
On-site presentation
Tanguy Bertrand, Emmanuel Lellouch, Bryan Holler, John Stansberry, Ian Wong, Xi Zhang, Linfeng Wan, Panayotis Lavvas, Elodie Dufaux, Frederic Merlin, Geronimo Villanueva, Noemí Pinilla-Alonso, Ana Carolina de Sousa Feliciano, and Katherine Murray

1. Introduction

The New Horizons flyby of Pluto in 2015 unveiled a world with variegated surface composition [1], a remarkable topography and active geology [2,3], and a chemically-rich atmosphere with an extensive haze [4,5]. Pluto possesses a complex climatic system driven by the redistribution cycles of volatile ices N2, CH4, CO [6]. A large part of the equatorial regions is volatile-free and covered by dark materials, likely organic materials resulting from a combination of surface ice irradiation and sedimentation of the photochemical haze [7]. Charon’s surface is not, morphologically and compositionally, as variegated as Pluto’s [8]. Its spectrum is dominated by H2O ice and NH3-bearing species with additional species such as CO2 and H2O2 recently detected from JWST near-IR spectroscopy [9]. Yet, Charon exhibits darker and redder polar regions, possibly resulting from capture, cold-trapping, and subsequent chemical processing of Pluto’s escaping volatiles [10].

Measuring the thermal emission of these icy surfaces at infrared wavelengths yields constraints on surface temperatures, thermal inertias, bolometric and spectral emissivities. Such properties, largely unknown on Pluto and Charon, are diagnostic of grain size, porosity, and composition. On Pluto, they also control the sublimation and condensation of volatiles, and are therefore crucial to understand the climate system. On Charon, emissivity- and thermal inertia-dependent polar temperature is critical to explain its red poles.

Previous thermal measurements of the Pluto-Charon system yield multiple solutions because most of them did not resolve Pluto from Charon. In addition, recent modeling studies suggest that the atmospheric haze of Pluto could significantly contribute to its mid-infrared emission, thus adding further degeneracy.

In October 2022, we measured Pluto and Charon separate thermal light curves over 15-25.5 mm with the JWST/MIRI instrument, in the context of our accepted JWST GO-1 program (#1658) dedicated to the study of Pluto's climate system. Our JWST program also include (i) a deep MIRI/MRS spectrum, to obtain new insights on Pluto's atmosphere composition, and to explore the 5-15 μm reflected spectrum of Pluto (and Charon), searching for hydrocarbon ices and irradiation products, (ii) a MIRI/LRS spectrum to search for non-H2O ice signatures, and (iii) NIRCam filter imaging to map the albedo and methane ice distribution with resolution comparable to HST visible imaging. Data and first analyses will be presented at the meeting with a focus on the MIRI observations.

2. Observations

We observed Pluto and Charon separate thermal emission obtained using the JWST/MIRI Imaging instrument at 15, 18, 21 and 25.5 µm. Data were collected over a single 6.4 day Pluto-Charon mutual orbit in October 2022. Six visits to the Pluto-Charon system were scheduled, separated by 60° in longitude, providing a well-sampled multi-band lightcurve for both objects. The MIRI PSF (FWHM=0.49"-0.80") being comparable to the Pluto-Charon separation (0.68’’-0.78’’), PSF fitting was performed to extract the separate Pluto and Charon fluxes. This is the first detection of Charon’s thermal lightcurve. This lightcurve includes a small fraction of solar reflected light, which was corrected for before thermophysical modelling.

3. Thermophysical model

Observations are analyzed by means of a thermophysical model [11], including the effects of subsurface thermal conduction and a multi-terrain description of Pluto and Charon surfaces in accordance with the latest albedo maps of Pluto and Charon, as in [12]. The Pluto model takes into account the seasonal volatile cycles of N2 and CH4. The CH4 cycle is particularly important because it impacts the surface temperatures and therefore the thermal emission of the CH4-covered terrains through latent heat exchanges.

4. Results

We applied our thermophysical model to Charon considering two surface units, H2O ice and the red pole. We obtained very good fits and we retrieved the bolometric emissivity and thermal inertia of each unit. We then applied our thermophysical model to Pluto considering three units respectively covered by N2 ice, CH4 ice, and dark materials, based on the albedo map. We obtained very good fits of the lightcurve contrasts (differential flux to mean) in the four filters, and we retrieved the global thermal inertia and the CH4 ice bolometric emissivity.

For both Pluto and Charon, our thermal inertia results are in line with previously inferred values from Spitzer and Herschel observations [12,13], which encompassed the 5-30 SI range, but are now put on firmer ground thanks to the ability of MIRI to separate Pluto from Charon. A large range of bolometric emissivity for methane ice is obtained depending on the choice of scenario for ice distribution.

Most importantly, we constrain the thermal emission of Pluto’s haze. Our results have strong implications on the haze composition and on the impact of the haze on Pluto’s atmospheric temperatures and its climate at a global scale.

References

[1] Stern, S. A., et al. (2015). The Pluto system: Initial results from its exploration by New Horizons. Science, 350.

[2] Schenk, P. M., et al. (2018). Basins, fractures and volcanoes: Global cartography and topography of Pluto from New Horizons. Icarus, 314, 400-433.

[3] Moore, J. M., et al. (2016). The geology of Pluto and Charon through the eyes of New Horizons. Science, 351.

[4] Gladstone, G. R., et al. (2016). The atmosphere of Pluto as observed by New Horizons. Science, 351.

[5] Young, L. A., et al. (2018). Structure and composition of Pluto's atmosphere from the New Horizons solar ultraviolet occultation. Icarus, 300, 174-199.

[6] Bertrand, T., & Forget, F. (2016). Observed glacier and volatile distribution on Pluto from atmosphere–topography processes. Nature, 540.

[7] Grundy, W. M., et al. (2018). Pluto's haze as a surface material. Icarus, 314, 232-245.

[8] Grundy, W. M., et al. (2016). Surface compositions across Pluto and Charon. Science, 351.

[9] Protopapa, S., et al. (2023). Unveiling new species on the stratified surface of Charon through JWST. In AAS/DPS (Vol. 55).

[10] Grundy, W. M., et al. (2016). The formation of Charon’s red poles from seasonally cold-trapped volatiles. Nature, 539.

[11] Bertrand, T., et al. (2019). The CH4 cycles on Pluto over seasonal and astronomical timescales. Icarus, 329, 148-165.

[12] Wan, L., et al. (2023). Constraining Thermal Emission of Pluto’s Haze from Infrared Rotational Lightcurves. The Astrophysical Journal, 955(2), 108.

[13] Lellouch, E., et al. (2011). Thermal properties of Pluto’s and Charon’s surfaces from Spitzer observations. Icarus, 214(2), 701-716.

How to cite: Bertrand, T., Lellouch, E., Holler, B., Stansberry, J., Wong, I., Zhang, X., Wan, L., Lavvas, P., Dufaux, E., Merlin, F., Villanueva, G., Pinilla-Alonso, N., de Sousa Feliciano, A. C., and Murray, K.: The Pluto climate system observed by JWST, Europlanet Science Congress 2024, Berlin, Germany, 8–13 Sep 2024, EPSC2024-305, https://doi.org/10.5194/epsc2024-305, 2024.

11:30–11:40
|
EPSC2024-400
|
ECP
|
On-site presentation
Aurélien Falco, Tanguy Bertrand, François Forget, Ehouarn Millour, Benjamin Charnay, and Bruno de Batz de Trenquelléon

1. Introduction

Nine years after Pluto's flyby by New Horizons, there are still fundamental unanswered questions about Pluto's atmosphere. Here we focus on two specific plutonian mysteries. First, New Horizons revealed thin wave-like structures at global scales in the atmosphere, consistent with density perturbations previously seen in stellar occultations. It remains unclear whether these waves are orographic gravity waves initiated from winds flowing over Pluto's extensive topography or thermal tides resulting from the "breathing" of N2 ice in response to solar forcing. In addition, the impact of these waves on their climate has not yet been explored. Second, Pluto's atmospheric thermal structure measured by New Horizons [1,2] is presenting puzzling features such as: (1) a strong negative gradient between the stratosphere at 110K and the upper atmosphere at 70K, (2) a strong thermal gradient in latitude, still unexplained, and (3) a 3km-deep cold layer, which has been only partially explained.

Recent studies [3] suggest that the cooling of the upper atmosphere (1) may be explained by the presence of organic hazes. However the bulk material of the haze (organic vs ice) remains unclear, and the radiative impact of the haze on the atmosphere remains to be explored in detail with 3D climate models including haze and hydrocarbon ice microphysics, and tested against available thermal emission measurements of the atmosphere.


2. The new Pluto PCM

To tackle these scientific investigations, we created a completely new-generation planetary climate model (PCM) able to simulate Pluto at high spatial resolution, with haze microphysics processes, and over the long annual timescales. This Pluto PCM is derived from the LMD Generic PCM and from the Legacy Pluto GCM [4,5,6] and therefore benefits from the recent developments from the Generic PCM such as its efficient parallelization.

At the conference we will present this new tool and preliminary results regarding the impact of radiatively active hazes on Pluto's climate as well as the propagation of gravity waves in the atmosphere.


Acknowledgements

This work was supported by funding from ANR "Programme de Recherche Collaborative" 2024-2028 (ANR-23-CE49-0006).

References

[1] Hinson, D. P., et al., Radio occultation measurements of Pluto’s neutral atmosphere with New Horizons, Icarus, 290, 96–111, 2017.

[2] A. Dias-Oliveira et al., Pluto's atmosphere from stellar occultations in 2012 and 2013, ApJ 811, 53, 2015.

[3] Zhang, X., et al, Haze heats Pluto's atmosphere yet explains its cold temperature, Nature, 2017.

[4] Forget, F., et al., A post-new horizons global climate model of Pluto including the N2, CH4 and CO cycles, Icarus, 287, 54–71, 2017.

[5] Bertrand, T., et al., Pluto’s Beating Heart Regulates the Atmospheric Circulation: Results From High-Resolution and Multiyear Numerical Climate Simulations. JGR: Planets, 125(2), 1–24, 2020.

[6] Bertrand, T. and Forget, F.: 3D modeling of organic haze in Pluto’s atmosphere, Icarus, 287:72, 2017.

How to cite: Falco, A., Bertrand, T., Forget, F., Millour, E., Charnay, B., and de Batz de Trenquelléon, B.: After New Horizons, a new Pluto Climate Model for new challenges, Europlanet Science Congress 2024, Berlin, Germany, 8–13 Sep 2024, EPSC2024-400, https://doi.org/10.5194/epsc2024-400, 2024.

11:40–11:50
|
EPSC2024-396
|
ECP
|
On-site presentation
Benjamin Frandsen and Robert Skog

A new era dawns in the exploration of planetary atmospheres. The James Webb Space Telescope  (JWST) having started to record high-resolution spectra of exoplanetary atmospheres. Atmospheric Remote-sensing Infrared Exoplanet Large-survey (ARIEL) is soon to follow in 2029. Furthermore, new missions with orbiters and landing crafts are being launched within the next decade to study bodies in the solar system. Of particular interest to us is Venus with one active orbiter and four upcoming missions.

From our physical chemistry background we drive exploration of molecular level chemistry in atmospheres using computational chemistry (ab initio) methods and laboratory based spectroscopy. In this manner we can influence the scope of future missions and enable discovery of novel molecules, ultimately expanding our understanding of planetary atmospheres.

Here I show results from our work in uncovering novel chemical reactions and identifying spectral signatures, all of which can be directly implemented into atmospheric models. The Venusian atmosphere has rich and diverse chemistry, especially sulfur chemistry, and remains a great source of inspiration for our starting points. However, the impact of our results goes beyond Venus and into both the atmosphere of Jupiter's moon Io, and exoplanets such as LHS 475b, where SO2 has been observed.

The presentation includes novel unpublished reactions with an assessment of how impactful these might be on Venus. Furthermore, I present perspectives on candidate molecules for matching the enigmatic UV absorption on Venus, demonstrating how some previously suggested candidates cannot match, and narrowing down the possible candidates.

How to cite: Frandsen, B. and Skog, R.: Molecular Transformations and Spectroscopy for Understanding Extra-Terrestrial Atmospheres, Europlanet Science Congress 2024, Berlin, Germany, 8–13 Sep 2024, EPSC2024-396, https://doi.org/10.5194/epsc2024-396, 2024.

11:50–12:00

Posters: Mon, 9 Sep, 14:30–16:00 | Poster area Level 2 – Galerie

Display time: Mon, 9 Sep, 08:30–Mon, 9 Sep, 19:00
Chairperson: Tanguy Bertrand
P1
|
EPSC2024-231
|
ECP
|
On-site presentation
|
Demetrius Ramette, Ehouarn Millour, Tanguy Bertrand, Antoine Bierjon, and Kerstin Schepanski

Dust is a key component affecting the radiative budget of the Martian atmosphere. In order to achieve accurate numerical modelling of the Martian weather and climate, it is therefore crucial to understand the dynamics of Martian dust storms throughout their whole life cycle, from the injection to the deposition of dust [1]. However, our understanding of dust storm dynamics is still incomplete and simulations of the Martian dust cycle come with large uncertainties, especially concerning the transport of dust by model winds. The latter are difficult to validate, as in-situ or remote-sensing measurements of winds in the Martian atmosphere are rare or inexistent. How well do dust storm trajectories predicted by a Mars Global Climate Model match observed trajectories?

In this study, we use recently published observations [2, 3] of dust storm trajectories and dust storm simulations by the Mars PCM6 [4], in order to compare the direction and velocity of dust transport of individual dust storms. This will allow to identify strengths and weaknesses of the Mars PCM6 with respect to dust transport.

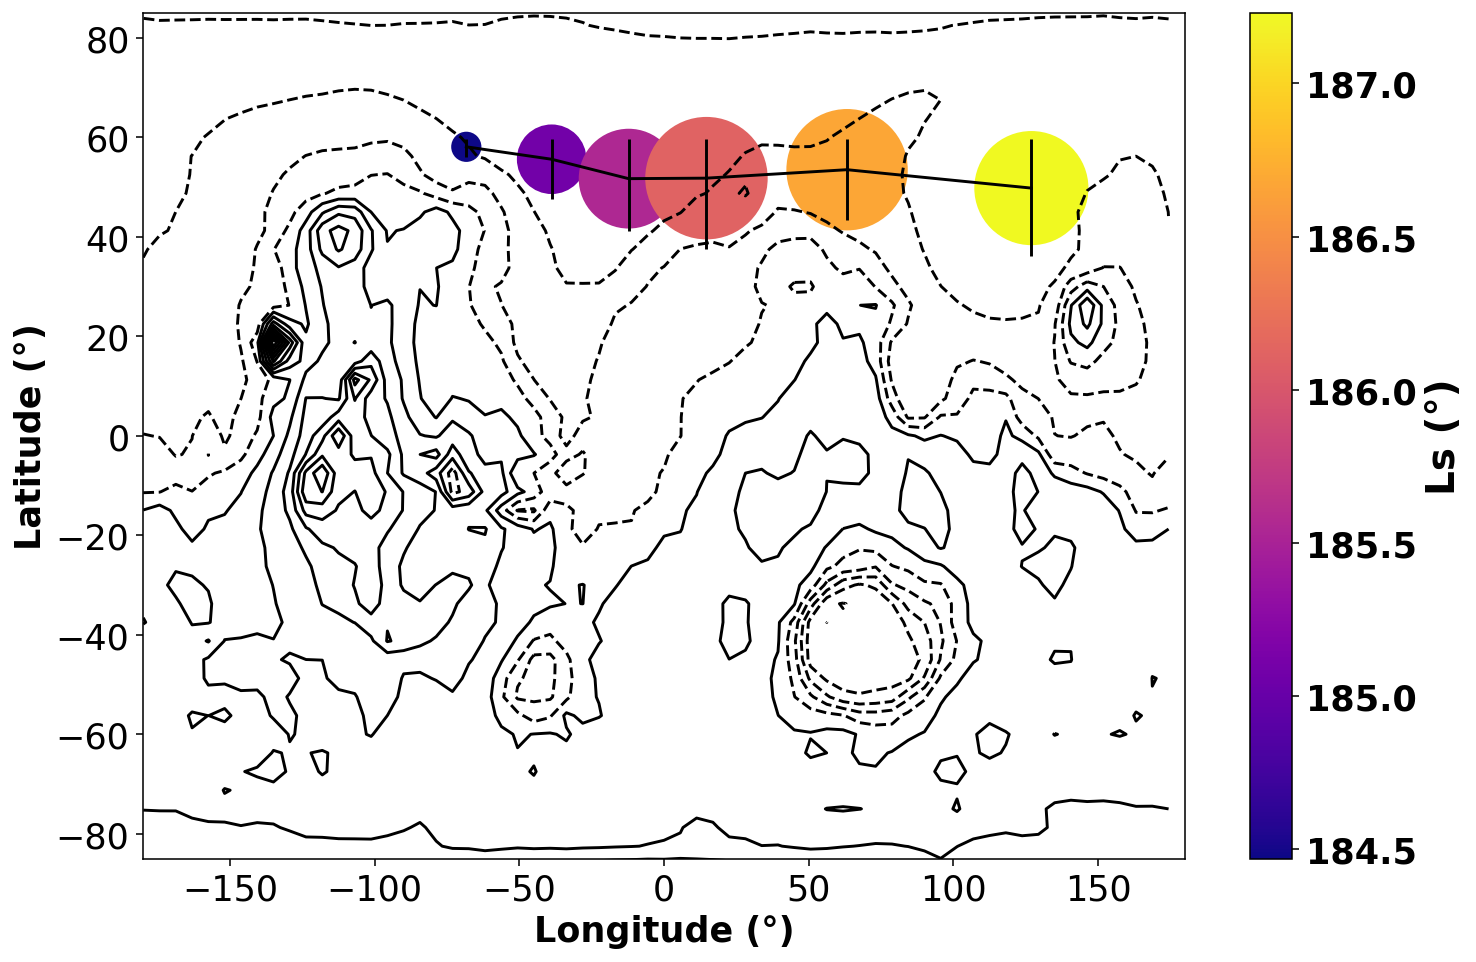
The Mars PCM in its newest version 6 [5, 6] is able to initiate a dust storm with a given dust scenario – based on maps of the observed column dust optical depth from [7] – and then let it freely evolve, following the large scale winds and other relevant physical processes. The Mars Dust Activity Database (MDAD, [2]) and the Mars Dust Storm Sequence Dataset (MDSSD, [3]) contain compilations of observed dust storms, based on high-resolution (0.1° x 0.1°) daily mosaics of wide-angle images from orbital cameras. Fig. 1 shows an exemplary trajectory of a dust storm member from the MDAD.

This new combination of model results and observations may further open opportunities to better understand the dynamics of Martian dust storms, especially concerning emission and deposition processes and, based on that, to improve dust cycle representation in the Mars PCM.

Fig. 1: Plotting of the trajectory of an exemplary dust storm member during Mars Year 24 on a map of Mars, around Ls=185° (here: dust storm member m03_126 from the MDAD [2]). The size of the colored circles scales with the surface area of the dust storm and the color indicates the time of observation (solar longitude Ls, in degrees). The vertical black lines indicate the maximum latitudinal extension of the dust storm. The black broken line connects the individual positions of the dust storm centroid and thus indicates the evolution of its position over time. The contour lines (dashed and solid lines) represent the Martian topography with a line interval of 1500m. Here, we see that the dust storm originates in the Northern Hemisphere west of Acidalia Planitia and ends in Utopia Planitia. In this study, we want to compare these kind of tracks with model simulations.


[1] Kahre, M. A., Murphy, J. R., Newman, C. E., Wilson, R. J., Cantor, B. A., Lemmon, M. T., & Wolff, M. J. (2017). The Mars dust cycle. The atmosphere and climate of Mars, 18, 295.

[2] Battalio, M., & Wang, H. (2021). The Mars Dust Activity Database (MDAD): A comprehensive statistical study of dust storm sequences. Icarus, 354, 114059.

[3] Wang, H., Saidel, M., Richardson, M. I., Toigo, A. D., & Battalio, J. M. (2023). Martian dust storm distribution and annual cycle from Mars daily global map observations. Icarus, 394, 115416.

[4] Forget, F., Hourdin, F., Fournier, R., Hourdin, C., Talagrand, O., Collins, M., Lewis, S.R., Read P.L. & Huot, J. P. (1999). Improved general circulation models of the Martian atmosphere from the surface to above 80 km. Journal of Geophysical Research: Planets, 104(E10), 24155-24175.

[5] Forget, F., Millour, E., Bierjon, A., Delavois, A., Fan, S., Lange, L., Liu, J., Mathe, C., Naar, J., Pierron, T., Vandemeulebrouck, R., Spiga, A., Montabone, L., Chaufray, J.-Y., Lefèvre, F. Määttänen, A., Montmessin, F., Rossi, L., Vals, M., Gonzalez-Galindo, F., Lopez-Valverde, Wolff, M.J., Young, R., Lewis, S.R. & Read, P. L. (2022). Challenges in Mars Climate Modelling with the LMD Mars Global Climate Model, Now Called the Mars “Planetary Climate Model”(PCM). In Seventh international workshop on the Mars atmosphere: Modelling and observations.

[6] Millour, E., Bierjon, A., Forget, F., Spiga, A., Wang, C. and the Mars PCM Team, "Improving the vertical distribution of airborne dust in the Mars PCM", EPSC 2024

[7] Montabone, L., Forget, F., Millour, E., Wilson, R. J., Lewis, S. R., Cantor, B., Kass, D., Kleinböhl, A., Lemmon, L.T., Smith, M.D. & Wolff, M. J. (2015). Eight-year climatology of dust optical depth on Mars. Icarus, 251, 65-95.

How to cite: Ramette, D., Millour, E., Bertrand, T., Bierjon, A., and Schepanski, K.: Validation of Martian dust storm trajectories in the Mars PCM using observational datasets, Europlanet Science Congress 2024, Berlin, Germany, 8–13 Sep 2024, EPSC2024-231, https://doi.org/10.5194/epsc2024-231, 2024.

P2
|
EPSC2024-281
|
On-site presentation
Mark Paton, Peter Grindrod, Joel Davis, Tanguy Bertrand, Hannu Savijärvi, and Ari-Matti Harri

Abstract

The Planetary Boundary Layer (PBL) on Mars is a dynamic region of the atmosphere that extends several kilometres above the surface. It is sensitive to solar heating during the day, generating turbulent circulations and large convective cells. The background wind is influenced by the large-scale winds and interactions with the surface. It is important to characterise this region of the atmosphere to better understand atmospheric circulations and to verify atmospheric models.

Wind profiles between the surface and to several kilometres above the PBL are generally lacking for Mars. However these can be inferred by analysing the displacement of jettisoned hardware at landing sites. This has been done for a variety of landers in the past to help verify atmospheric models and investigate the Martian atmosphere. Here we determine the wind speed and direction during the descent of Beagle 2 and also investigate the surface.

1. Introduction

Beagle 2 landed in Isidis Planitia basin in the early afternoon, during the northern hemisphere winter at Ls=322°. The region where Beagle 2 landed is relatively flat suggesting the lack of local slope winds. However around sides of the basin are steep slopes that are susceptible to slope winds, e.g. Chojnacki et al. (2019) which drive the circulation at the landing site (Rafkin et al., 2004). Atmospheric modelling data from the Mars Climate Database (MCD) indicates a strong influence on the winds from the thermal tide (Bingham et al., 2004). Results from the Mars Regional Atmospheric Modeling System (MRAMS) (Rafkin et al., 2004) indicate slope-wind driven circulations modulated by the large-scale circulations.

2. Method

The wind profiles at the landing site are inferred based on the location of hardware identified in HiRISE images of the Beagle 2 landing site (Bridges et al., 2017; Clemmet et al., 2017). We use a trajectory model (Paton et al., 2018) to calculate the impact locations of Beagle 2’s heat shield, backshell-pilot parachute, main parachute and the airbags. The winds in the trajectory model are varied until the end points in the model match the actual locations of Beagle 2 hardware.

The modelling of the airbag trajectory, as it bounces across the surface, can tell us something about the surface roughness. For a smooth surface the airbags bounce in a straight line while for a rough surface the airbags can be deflected from its path. By comparing the inferred wind profile to an atmospheric model wind profile we can constrain the surface roughness. The surface roughness parameter used in the model is the maximum metre-scale slope angle.

The elevation of the Beagle 2 landing site is established using a Digital Terrain Model (DTM) together with MOLA elevation data. The DTM is also be used to estimate the flatness over the distance bounced by the airbags (about 100 m). Noise in the HiRISE images, used to make the DTM, makes it difficult to estimate the metre-scale roughness which is relevant to the airbag’s traverse across the surface.

3. Results 

A three-layer wind profile was inferred for the Beagle 2 landing. A good match between the inferred and MCD wind speed profiles was found when the metre-scale surface roughness in the trajectory model is comparable to that at the Pathfinder landing site. There is a good match with high-resolution results from MRAMS. The inferred, MRAMS and MCD wind profiles indicate high-speed winds of about 15 m s-1 above 3 to 4 km. Below these altitudes the wind speed drops down to 5 m s-1. Below ~3 km altitude the wind speed is relatively uniform, typical of a well mixed PBL.  

The inferred wind direction above 3 km altitude matches the MCD quite well with a wind approximately from the east. There is a significant discrepancy between the inferred wind direction and the MCD near the surface. This may be due to large-scale convective structures that at the Beagle 2 landing site.

Comparisons between an inferred wind speed profile and atmospheric model data from the time of the Perseverance landing (Paton et al., 2024), requires high resolution atmospheric modelling for a good match. At the Beagle 2 landing site, which DTM data indicates is relatively flat, both the MCD and MRAMS atmospheric models appear to agree with the inferred wind speed profile.

4. Conclusions

The lower layers of the inferred wind profiles at the Beagle 2 landing site appears to be broadly consistent with predictions. These winds are primarily driven by the slope-driven winds occurring at the edges of Isidis Planitia. The upper layer of the wind speed profile is consistent with the large scale flow above the PBL when surface roughness is included in the trajectory model for the airbags.

References

Bingham, S.J., et al., 2004, Environmental predictions for the Beagle 2 lander, based on GCM climate simulations, Planetary and Space Science, 52, 259–269

Bridges, J. C. et al., 2017, Identification of the Beagle 2 lander on Mars., Royal Society Open Science, 4

Chojnacki, M., et al., 2019., Boundary condition controls on the high-sand-flux regions of Mars, Geology, 47, 427–430

Clemmet, J., et al., 2017, Beagle 2 on Mars - the Discovery Assessed, Journal of the British Interplanetary Society, 70, 262–277

Paton, M. D., Harri, et al., 2018, Measurement of Martian boundary layer winds by the displacement of jettisoned lander hardware, Icarus, 309, 345-362

Paton, M. D., et al., 2024, Inferred wind speed and direction during the descent and landing of Perseverance on Mars. Icarus, 415

Rafkin, S. C. R., et al., 2004, Meteorological predictions for the Beagle 2 mission to Mars, Geophysical Research Letters, 31

How to cite: Paton, M., Grindrod, P., Davis, J., Bertrand, T., Savijärvi, H., and Harri, A.-M.: Inferred wind profiles and surface roughness during the Beagle 2 landing on Mars, Europlanet Science Congress 2024, Berlin, Germany, 8–13 Sep 2024, EPSC2024-281, https://doi.org/10.5194/epsc2024-281, 2024.

P3
|
EPSC2024-854
|
On-site presentation
Kei Masunaga and Takuya Hara

Pickup ions around Mars are originally produced from an exospheric neutral atmosphere and their measurements thus contain information on the exospheric neutral abundance. Here we present a method to retrieve exospheric number densities by analyzing the ion velocity distribution functions of pickup ions measured by the SupraThermal And Thermal Ion Composition instrument on the Mars Atmosphere and Volatile EvolutioN spacecraft. We successfully retrieved exospheric oxygen density distributions at altitudes ranging from 1,000–10,000 km around Mars (Masunaga et al., submitted). In this study, we also apply this method to analyze temporal variations of O exospheric densities. We particularly examined the case of the dust storm event in September 2016 during which thermospheric O and ionospheric O+ densities varied with a period of ~7-8 days (Masunaga et al., 2022, Hara et al., 2024) and the comet approach event in September 2014 during which the cometary atmosphere was transferred to the upper atmosphere of Mars (Crismani et al., 2015), finding that the Martian O exosphere likely responds to these drivers.

How to cite: Masunaga, K. and Hara, T.: Exospheric number densities retrieved from pickup ion ring distributions and their temporal variations responding to the dust storm and comet approach events at Mars, Europlanet Science Congress 2024, Berlin, Germany, 8–13 Sep 2024, EPSC2024-854, https://doi.org/10.5194/epsc2024-854, 2024.

P4
|
EPSC2024-1051
|
On-site presentation
Maxime Maurice, François Forget, Yangcheng Luo, Franck Lefèvre, Yassin Jaziri, Ehouarn Millour, Martin Turbet, and Ashwin Braude

Introduction

Liquid water is largely regarded as a sine qua non condition for life as we know it. Geomorphological, mineralogical and sedimentological evidences indicate the presence of perennial liquid water on the surface of Mars in the late Noachian, approximately 3.8 billion years ago (Ga) [1,2], suggesting that it was possibly habitable. Today, the low surface temperature on Mars precludes sustained liquid water. The solar flux was fainter 3.8 Ga than today, leading to a conundrum regarding the conditions that allowed for perennial liquid water on early Mars.

Although likely, a thicker (up to 2 bar) CO2 atmosphere on early Mars falls short of heating up the surface temperature to the melting point of water (273 K) [3]. Thus, other infrared opacity contributors are necessary to further enhance the greenhouse effect. Recently, [4] suggested that such additional greenhouse effect could be due to hydrogen peroxide (H2O2), and calculated that an average of 1 ppm H2O2 in a 2 bar CO2 atmosphere could raise the surface temperature to 273 K. Here we test this hypothesis using a global circulation model (the Generic PCM) and an H-C-O photochemical.

Model

In order to assess the possibility to produce H2O2, we adopted the most favorable conditions by optimizing the water content of the atmosphere, consider an already warm and wet early Mars. This was achieved by using the setup from [5], where warming is due to the collision-induced absorption of CO2 and H2. Notice that the high H2 content assumed in the radiative transfer calculation is unrelated to the chemical model. Within these simulations, we include the H-C-O photochemical network considering 14 species and 52 reactions (including 12 photodissociation reactions). Although not self-consistent, this scenario allows us to study the chemistry on a warm and wet early Mars.

Results

We find that after 10 Martian years of evolution, the average amount of H2O2 starts to plateau. While the upper atmosphere has an H2O2 volume mixing ratio (VMR) above 1 ppm, the well-mixed lower atmosphere has an H2O2 VMR lower than 10-7 (Figure 1). This is likely too low to induce a sufficient greenhouse warming. Because we used the most favorable conditions for H2O2, this result suggests that a more realistic, initially cold and dry early Mars couldn't have been warmed up by the greenhouse effect of H2O2.

Figure 1: Molar mixing ratio of the various species after 10 Martian years.

References

[1] Haberle et al. (2017) The Early Mars Climate System, Cambridge University Press

[2] Rapin et al. (2023) Nature

[3] Forget et al. (2013) Icarus

[4] Ito et al. (2019) ApJL

[5] Turbet et al. (2021) arXiv.org

How to cite: Maurice, M., Forget, F., Luo, Y., Lefèvre, F., Jaziri, Y., Millour, E., Turbet, M., and Braude, A.: Investigating the possibility of H2O2-induced warming on early Mars with a 3D GCM, Europlanet Science Congress 2024, Berlin, Germany, 8–13 Sep 2024, EPSC2024-1051, https://doi.org/10.5194/epsc2024-1051, 2024.

P5
|
EPSC2024-1147
|
ECP
|
On-site presentation
Orkun Temel and Ozgur Karatekin

Recent observations suggest that Venus can be geologically active. Geological activity can lead to the surface-atmosphere exchange of aerosols and gases. The vertical transport of aerosols and gases from the surface of Venus to its cloud layer depends on the mixing within the boundary layer of Venus and the free troposphere above. However, the lower atmospheric dynamics of Venus below its cloud deck are poorly constrained. Here, we focused on understanding how the vertical variation of winds can affect the mixing of a trace gas emitted from the surface of Venus with implications for surface outgassing using idealized mesoscale simulations. To do that, we used atmospheric simulations for the first 10 km of the atmosphere of Venus using the Weather Research and Forecasting (WRF) Model v4.4.1 [1]. We aim to understand the response of atmospheric transport of momentum and trace gases to changes in wind shear by performing numerical simulations. We investigate shear-induced PBL and free atmospheric turbulence by conducting numerical experiments across a spectrum of wind shear regimes, ranging from 8 m/s per km to 1 m/s per km (as predicted by the Venus Climate Database [2] and presented in Fig. 1).

Figure 1: Horizontal winds and wind shear as predicted by the Venus Climate Database at local noon

We first investigated how the dynamics of the lower atmosphere of Venus varies in response to different wind shear. As depicted in the left panel of Figure 2, the case with the lowest wind shear (1 m/s per km) has a quasi-uniform horizontal variation of horizontal winds. However, with the increasing wind shear, this quasi-uniform state of the flow breaks down and fronts with different wind speeds occur at the same altitude. This is a result of the onset of overturning motion in stratified turbulence. The shear instabilities lead to the formation of turbulent eddies that can mix the atmosphere in the vertical direction. As these turbulent eddies form and propagate both horizontally and vertically, they entrain the surrounding air into the vertical motion. Entrainment processes caused by the formation of shear-induced eddies then enhances the vertical exchange within and above the PBL. Another indicator of the mixing within the PBL is the friction velocity. Right panel of Figure 2 presents the horizontal variations on the friction velocity showing the gradual increment with the wind shear. We also find that the friction velocity remain under 0.1 m/s as consistent with a previous LES study on the Venusian boundary layer by [3].

Figure 2: Horizontal winds and friction velocity for three different wind shea regimes (2 m/s / 8 km – top, 4 m/s / 8 km – middle, 2 m/s / 8 km – bottom panels)

We then investigate how these distinct flow regimes influence the atmospheric transport of trace gases emitted from the surface with implications for surface outgassing phenomena. As shown in Fig. 3, our results show that for the same time period (10 Earth days), trace gases released from the surface of Venus can have distinct vertical variations. For the case of high wind shear, the released gas is well mixed whereas it can still be confined to the lowermost part of the Venusian atmosphere for the case of low wind shear.

Figure 3: Distribution of surface outgassed tracers after 10 Earth days for two different wind shear regimes: (6 m/s / 8 km – left panel, 1 m/s / 8 km – right panel)

References

[1] Skamarock, William C., et al. "A description of the advanced research WRF version 4." NCAR tech. note ncar/tn-556+ str 145 (2019).

[2] Lebonnois, Sébastien, et al. "The Venus Climate Database." European Planetary Science Congress. EPSC 2021. 2021.

[3] Lefèvre, Maxence. "Venus boundary layer dynamics: eolian transport and convective vortex." Icarus 387 (2022): 115167.

How to cite: Temel, O. and Karatekin, O.: The effect of wind shear on the dispersion of trace gases released from the surface of Venus, Europlanet Science Congress 2024, Berlin, Germany, 8–13 Sep 2024, EPSC2024-1147, https://doi.org/10.5194/epsc2024-1147, 2024.