OPS7 | Aerosols and clouds in planetary atmospheres

OPS7

Aerosols and clouds in planetary atmospheres
Co-organized by TP/EXOA
Convener: Panayotis Lavvas | Co-conveners: Anni Määttänen, Audrey Chatain, Nathalie Carrasco
Orals
| Mon, 09 Sep, 14:30–16:00 (CEST)|Room Jupiter (Hörsaal A)
Posters
| Attendance Mon, 09 Sep, 10:30–12:00 (CEST) | Display Mon, 09 Sep, 08:30–19:00|Poster area Level 2 – Galerie
Orals |
Mon, 14:30
Mon, 10:30
Atmospheric aerosols and cloud particles are found in every atmosphere of the solar system, as well as, in exoplanets. Depending on their size, shape, chemical composition, latent heat, and distribution, their effect on the radiation budget varies drastically and is difficult to predict. When organic, aerosols also carry a strong prebiotic interest reinforced by the presence of heavy atoms such as nitrogen, oxygen or sulfur.

The aim of the session is to gather presentations on these complex objects for both terrestrial and giant planet atmospheres, including the special cases of Titan’s, Pluto's and Triton's hazy atmospheres. All research aspects from their production and evolution processes, their observation/detection, to their fate and atmospheric impact are welcomed, including laboratory investigations and modeling.

Session assets

Discussion on Discord

Orals: Mon, 9 Sep | Room Jupiter (Hörsaal A)

Chairpersons: Panayotis Lavvas, Anni Määttänen, Audrey Chatain
Terrestrial Bodies
14:30–14:40
|
EPSC2024-422
|
ECP
|
On-site presentation
Nicolas Streel, Anni Määttänen, and Franck Lefèvre

Introduction

Venus has a unique cloud structure, with a global, three-layer cloud cover extending from 50 to 70 km in altitude. The cloud droplets are composed of sulphuric acid solution (70-95% in weight) and the size distribution is bi- or trimodal based on observations. These three modes have radii of around 0.3, 1 and 3 micrometers [1].

Several 1D models of the microphysics of Venus' clouds already exist [2-5]. This work aims to couple a microphysics model and the global climate model for Venus named Venus PCM, in order to have a coherent evolution of our clouds and chemistry. The Venus PCM [6,7]  is a GCM that includes a complete chemical scheme [8], a radiative transfer scheme and currently a simple cloud parametrization [8]. This cloud scheme assumes that the cloud profile is always in equilibrium. So at each time step, all the clouds are evaporated and then recondensed at equilibrium. This scheme is therefore highly dependent on and strongly coupled to the GCM chemical model.

Method

We couple the MAD-VenLA model from the work of Guilbon and Määttänen[9] with the one-dimensional (1D) version of the Venus PCM. MAD-VenLA is a modal model that describes two particle modes that have a lognormal form with a fixed standard deviation. MAD-VenLA includes a scheme of homogeneous nucleation Määttänen [11], a simplified parametrization of heterogeneous nucleation, Brownian coagulation, condensation and evaporation[9]. In addition, MAD-VenLA incorporates a numerical process, mode-merging [10], that allows to transfer particles from a mode to another. We have parametrized vertical transport through a prescribed eddy diffusion coefficient profile based on the work of Lefèvre 2024 [12], with the aim of having realistic vertical transport of all species. A simple sedimentation scheme will be added as well, based on the equation of Stokes-Cunningham.

Results

We will present the results of our model with the initial state taken as the equilibrium cloud distribution from Stolzenbach[8]. We let the cloud evolve during several Earth days. The 1D simulations should not be too long, since they do not include advection and large-scale dynamics that are very important in the atmosphere of Venus. The first short runs are made to test the behavior of the cloud model and its 1D implementation, before moving on to 3D simulations.
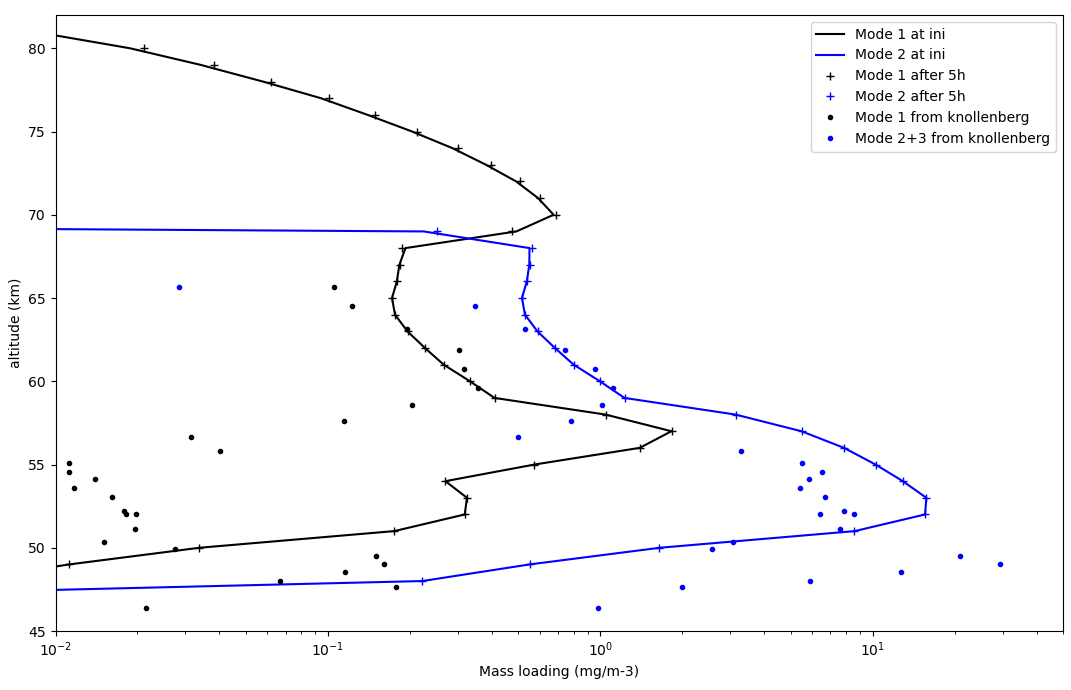
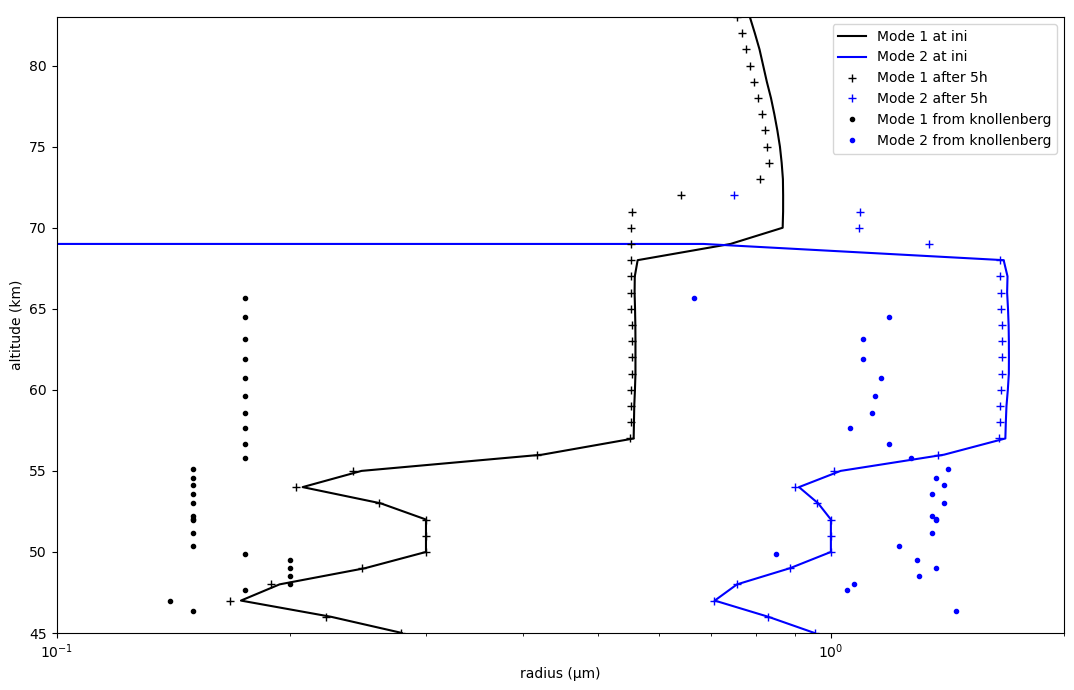
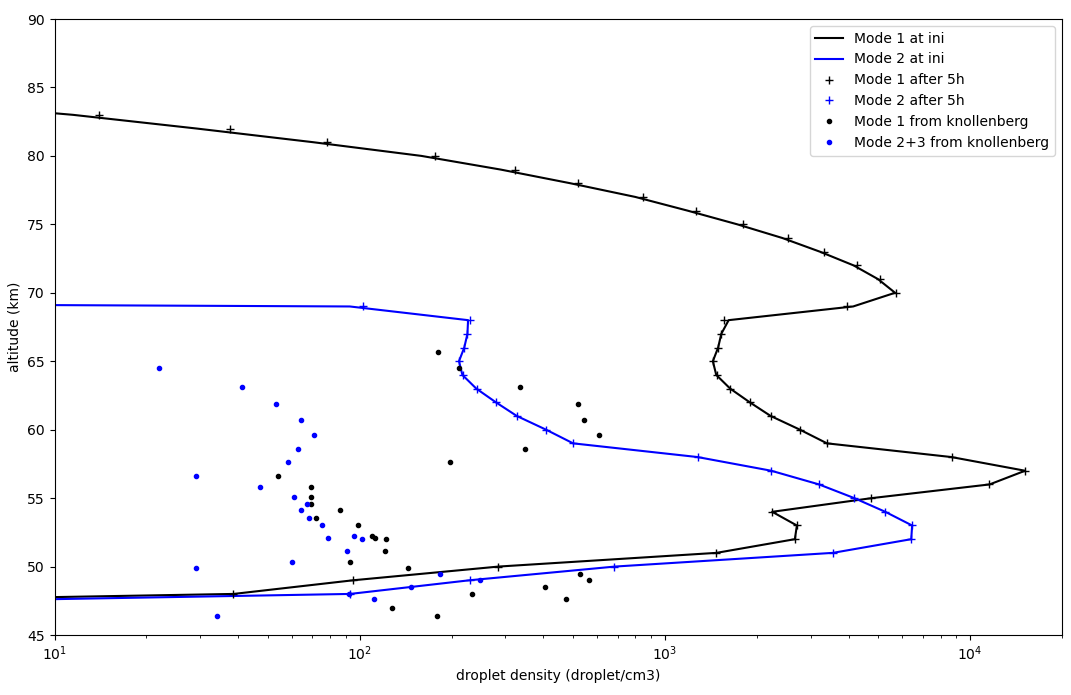
The aim of the first test is to study how the coupling between the microphysics and chemistry behaves in presence of parametrized vertical transport. From these tests we can see that the cloud remains in equilibrium over a more or less long period, maintaining a structure in line with what is expected in mass (Figure 3), and a bit less with concentration (Figure 2) and radius (Figure 1).

Other tests are in preparation, notably on nucleation that was not used in the initialization of the model. We will test how efficiently homogeneous nucleation will be able to replenish the cloud particle population, and thus get an idea of how much additional particle formation through heterogeneous nucleation would be needed. We will also test initializing the model without clouds, letting nucleation take care of the cloud formation.

This 1D study is only the first step in a larger project, and in particular it prepares the future 3D simulations. For the future 3D simulations an important choice is the microphysical time step. The length of the time step is a crucial issue for a planet where the duration of a day is of the order of 117 Earth days. Currently, our timestep (3 minutes) is the same for the chemistry and microphysics. This is sufficient for most of the processes, except for nucleation that is a very rapid process and might need a dedicated time step. The second important point to address is heterogeneous nucleation. Currently, this process is parametrized in a very simple way that does not really account for all the physics involved. In addition, the existence and nature of condensation nuclei in the atmosphere of Venus are unknown. The choice of the potential condensation nuclei and the complexity with which to take them into account is one of the questions we want to address.

Figure 1: Radius profile in micrometer of mode 1 (in black) and mode 2 (in blue) particles at the initialization (full line) and after 5 hours of simulation (crosses). The outputs are compared to the Knollenberg data (dots).

Figure 2: Droplet density profile (in droplet.cm-3) of mode 1 (in black) and mode 2 (in blue)  particles at the initialization (full line) and after 5 hours of simulation(crosses). The outputs are compared to the Knollenberg data (dots). Since MAD-VenLA is only composed of 2 modes, we sum up the mass of the mode 2 and mode 3 from the Knollenberg data (dots).

Figure 3: Mass-loading profile (in mg.m-3) of mode 1 (in black)  and mode 2 (in blue)  particles at the initialization (full line) and after 5 hours of simulation (crosses). The outputs are compared to the Knollenberg data (dots). Since MAD-VenLA is only composed of 2 modes, we sum up the mass of the mode 2 and mode 3 from the data (dots).

References

  • R. G. Knollenberg, D. M. Hunten, J. Geophys. Res. 85, 8039–8058 (1980).
  • T. Imamura, G. L. Hashimoto, J. Geophys. Res. 103, 31349–31366 (1998).
  • E. P. James, O. B. Toon, G. Schubert, Icarus. 129, 147–171 (1997).
  • K. Mcgouldrick, O. Toon, Icarus. 191, 1–24 (2007).
  • M. Yamamoto, M. Takahashi, J. Geophys. Res. 111, 2006JE002688 (2006).
  • G. Gilli et al., Icarus. 281, 55–72 (2017).
  • S. Lebonnois, N. Sugimoto, G. Gilli, Icarus. 278, 38–51 (2016).
  • A. Stolzenbach, F. Lefèvre, S. Lebonnois, A. Määttänen, Icarus. 395, 115447 (2023).
  • A. Määttänen, S. Guilbon, J. Burgalat, F. Montmessin, Advances in Space Research. 71, 1116–1136 (2023).
  • E. Whitby, F. Stratmann, M. Wilck, Journal of Aerosol Science. 33, 623–645 (2002).
  • A. Määttänen et al., JGR Atmospheres. 123, 1269–1296 (2018).
  • M. Lefèvre et al., Geophysical Research Letters.

How to cite: Streel, N., Määttänen, A., and Lefèvre, F.: Introducing detailed microphysics into the Venus Planetary Climate Model: model validation in one dimension, Europlanet Science Congress 2024, Berlin, Germany, 8–13 Sep 2024, EPSC2024-422, https://doi.org/10.5194/epsc2024-422, 2024.

14:40–14:50
|
EPSC2024-44
|
On-site presentation
Daniela Tirsch, Pedro Machado, Francisco Brasil, Jorge Hernández-Bernal, Agustín Sánchez-Lavega, John Carter, Franck Montmessin, Ernst Hauber, Klaus-Dieter Matz, and Ashwathy Nair

Due to the elliptical orbit of the Mars Express (MEX) spacecraft, its High Resolution Stereo Camera (HRSC [1]; spectral range 0.395-1.015 µm) can not only take surface observations from low altitude (near periapsis) to map the planet at the highest possible resolution (12.5 m/px), but also capture observations from higher altitudes at lower resolution (200 – 800 m/px, depending on observation altitude), covering much larger parts of the surface with a typical field of view from limb to limb. These high-altitude observations are ideal for observing atmospheric phenomena on Mars. After more than 20 years of the MEX mission, an extensive amount of image data on atmospheric phenomena on Mars has been accumulated, which has a great potential for scientific exploitation.

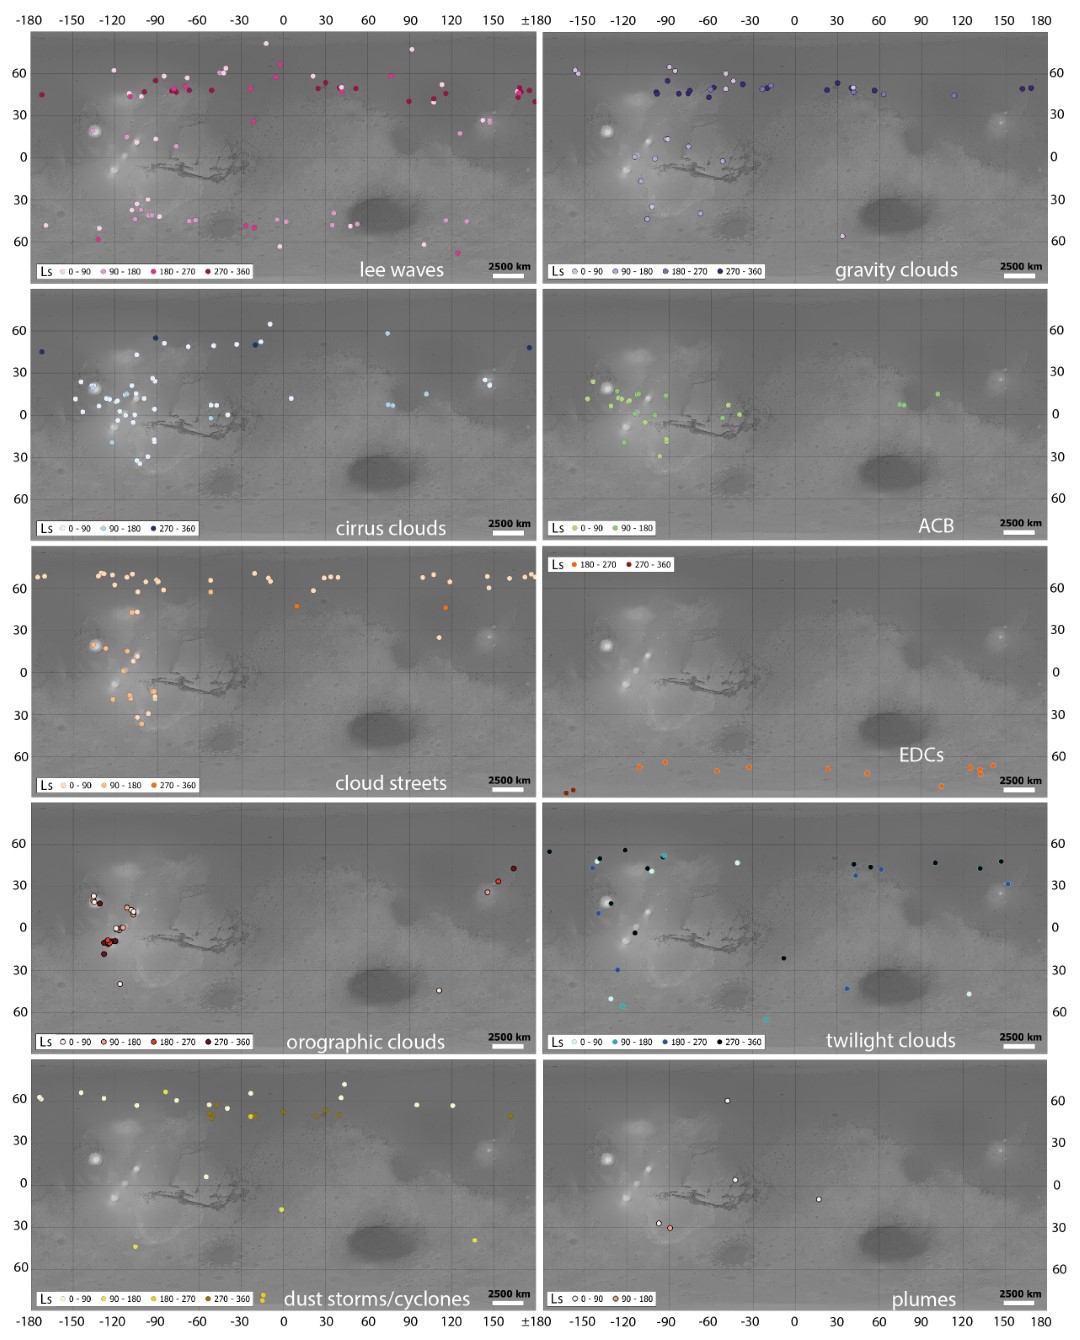
We have visually analyzed all HRSC high-altitude observations with respect to atmospheric phenomena such as clouds of different types, dust storms, cyclones, dust lifting events and other features, and compiled a database that should provide easy access to the information on what kind of phenomena can be found in which HRSC image. We have classified the different cloud types, compiled useful additional information and parameters (metadata), and analyzed the occurrence of each feature/event with respect to seasons and geographical locations. In a next step, this information will be used for further scientific applications such as spectral characterization of cloud compositions, cloud/wind speed and direction measurements, cloud height estimates and the analysis of the physical mechanisms behind the phenomena.

We will present our first results of this project and introduce the database, show examples of observed feature types and morphologies, present maps of the occurrence of phenomena on Mars and give examples of scientific applications.


[1] Jaumann, R., et al., 2007. The high-resolution stereo camera (HRSC) experiment on Mars Express: Instrument aspects and experiment conduct from interplanetary cruise through the nominal mission. Planetary and Space Science 55, 928-952.


Fig. 1: Current status of the database entries showing the occurrence of the respective cloud types and storm events by geographic location and season. (ACB = Aphelion Cloud Belt; EDC = Elongated Dust Clouds; background: blended HRSC/MOLA DTM and shaded relief)

Fig. 1: Current status of the database entries showing the occurrence of the respective cloud types and storm events by geographic location and season. (ACB = Aphelion Cloud Belt; EDC = Elongated Dust Clouds; background: blended HRSC/MOLA DTM and shaded relief)


How to cite: Tirsch, D., Machado, P., Brasil, F., Hernández-Bernal, J., Sánchez-Lavega, A., Carter, J., Montmessin, F., Hauber, E., Matz, K.-D., and Nair, A.: Clouds and Storms as seen by HRSC - A catalogue of atmospheric phenomena on Mars , Europlanet Science Congress 2024, Berlin, Germany, 8–13 Sep 2024, EPSC2024-44, https://doi.org/10.5194/epsc2024-44, 2024.

14:50–15:00
|
EPSC2024-533
|
On-site presentation
Antoine Damiens and Panayotis Lavvas

Context

In Titan’s lower stratosphere/high troposphere, temperature drops sufficiently for photochemical species to condense over the aerosol surface and form clouds. Condensation is triggered when the gaseous abundance crosses the saturation limit for each gas. Multiple studies, based on Cassini observations have explored the temporal and spatial variability of Titan’s clouds. Le Mouélic et al. 2018 [2] showed the progressive disappearance of the north polar cloud during the northern winter and its appearance at the south pole during the northern spring. VIMS data were used to study the rapid temporal changes that occur between the two poles before and after the equinox. Kok et al. 2014 [1] observed the formation of an HCN cloud in 2012 over the South pole in the upper part of the stratosphere, at an altitude of 300 km. The temperature required for HCN condensation is about 125 K. After the equinox (in 2009), a high concentration of tracer gases is observed at the South Pole [3], which may explain the significant cooling required to form the cloud at 300 km (assuming it’s greater than the heating due to the downward movement of air). Hanson et al. 2023 [4] discussed that the HCN cloud forms near 300 km and descends to the lower stratosphere followed by precipitation to the surface. Here we expand on previous studies by studying cloud formation with simultaneous condensation of multiple species in the south polar region.

Model Description

We use a 1D numerical model previously applied to Titan [5] that combines radiative transfer, photochemistry, microphysical evolution of haze and cloud size distributions, tracking of cloud condensation and nucleation, and accounts for atmospheric mixing, molecular diffusion, particle sedimentation and mixing. Primary particles are formed in the upper atmosphere and then coagulate to form aggregates. The growth mode of the falling haze particles is controlled by the fractal dimension of the aerosol. Cloud particle formation is initiated by heterogeneous nucleation of HCN on a haze particle under supersaturation conditions. We introduce 22 gas condensing species into the model that contribute to cloud formation. The rates of condensation and evaporation are given by the mass flux of condensing species entering and leaving the particle surface. This method has already been used for the study of Triton and Pluton [6], based on the model description of Smolarkiewicz 1982 [7].

Results

We explore the cloud / haze properties by showing simulation results at different latitudes, assuming temperature profiles corresponding to CIRS observations. We vary these temperature profiles as a function of solar longitude. After a benchmark of the simulation in equatorial conditions, we focus on south polar conditions to follow the cloud formation with different gas species. We study the evolution of the condensation of gas species at the South Pole after the equinox by comparing the simulated results with the observations from 2012 to 2017. We provide results on the optical properties, the simultaneous condensation of other gas species, and the microphysics of haze and clouds under the conditions described above.


References

[1] de Kok, R., Teanby, N., Maltagliati, L. et al. HCN ice in Titan’s high-altitude southern polar cloud. Nature 514, 65 - 67 (2014). https://doi.org/10.1038/nature13789
[2] S. Le Mouélic et al. Mapping polar atmospheric features on Titan with VIMS: From the dissipation of the northern cloud to the onset of a southern polar vortex, Icarus, Volume 311, 2018, Pages 371-383, https://doi.org/10.1016/j.icarus.2018.04.028.
[3] Vinatier, S. et al. Seasonal variations in Titan’s middle atmosphere during the northern spring derived from Cassini/CIRS observation. Icarus, Volume 250 (2015), Pages 95-115, https://doi.org/10.1016/j.icarus.2014.11.019.
[4] Lavender E. Hanson et al. , Investigation of Titan’s South Polar HCN Cloud during Southern Fall Using Microphysical Modeling, Planet. Sci. J. 4 237 (2023), https://doi.org/10.3847/PSJ/ad0837
[5] P. Lavvas, C.A. Griffith, R.V. Yelle, Condensation in Titan’s atmosphere at the Huygens landing site, Icarus, Volume 215, Issue 2, 2011, Pages 732-750, https://doi.org/10.1016/j.icarus.2011.06.040.
[6] Lavvas, P., Lellouch, E., Strobel, D.F. et al. A major ice component in Pluto’s haze. Nat Astron 5, 289–297 (2021). https://doi.org/10.1038/s41550-020-01270-3
[7] Piotr K. Smolarkiewicz. A Simple Positive Definite Advection Scheme with Small Implicit Diffusion, Monthly Weather Review, 479–486 (1983), https://doi.org/10.1175/1520-0493(1983)111<0479:ASPDAS>2.0.CO;2

How to cite: Damiens, A. and Lavvas, P.: Simulating clouds formation in Titan’s South polar region during post equinox, Europlanet Science Congress 2024, Berlin, Germany, 8–13 Sep 2024, EPSC2024-533, https://doi.org/10.5194/epsc2024-533, 2024.

15:00–15:05
Giant Planets
15:05–15:15
|
EPSC2024-479
|
On-site presentation
Jake Harkett, Leigh Fletcher, Oliver King, Michael Roman, Henrik Melin, Heidi Hammel, Ricardo Hueso, Agustín Sánchez-Lavega, Michael Wong, Stefanie Milam, Glenn Orton, Katherine de Kleer, Patrick Irwin, Imke de Pater, Thierry Fouchet, Pablo Rodríguez-Ovalle, Patrick Fry, and Mark Showalter

The Great Red Spot (GRS) is a remarkable feature of the Jovian atmosphere. Situated within the South Tropical Zone, it dominates the morphology of the southern hemisphere. Numerous spacecraft have visited Jupiter, but they have either lacked the mid-infrared instruments required to assess tropospheric structure and composition, or have been fly-by missions with insufficient time to probe such a specific part of the Jovian atmosphere. Ground-based observatories are capable of characterising this spectral region, often with higher spatial and spectral resolutions than space-based observatories. However, telluric absorption and the limited spectral coverage offered by narrow filters allows only a handful of discrete altitudes to be probed. As a result, there are still numerous unanswered questions regarding the aerosol formation processes, composition as well as the driving mechanism and longevity of the vortex.

JWST/MIRI observed the GRS in July and August 2022 as part of a Guaranteed-Time programme (Cycle 1 – GTO 1246). The Medium Resolution Spectrometer (MRS) was used, allowing the full 5 – 28 µm spectral region to be observed in the 6.6 x 7.7 arcsec field of view. This included the first ever mapping of the 5.5 – 7.7 µm range on Jupiter, a transitional region between thermal emission at long wavelengths and reflected sunlight at shorter wavelengths. This range required spectral models that considered multiple scattering of photons, which allowed us to probe the elevated aerosol structure dominating the GRS vortex in unprecedented detail. Firstly, the vertical temperature structure was constrained in the 7.3 – 10.8 µm range using the NEMESIS atmospheric retrieval software (Irwin et al., doi: 10.1016/j.jqsrt.2007.11.006). Secondly, these temperatures were used to map the 3D aerosol and gaseous distributions within the GRS in the 4.9 – 7.3 µm range. Various models were used to reproduce the observed spectra and the implications of these observations were assessed through comparison to theoretical models. A further comparison of the retrieved distribution of ammonia and water to this inferred aerosol abundance allowed us to speculate on the cloud formation processes taking place within the troposphere. Meanwhile, an analysis of the retrieved phosphine distribution enabled us to identify regions of convective upwelling outside the vortex. A considerable phosphine excess inferred above the GRS was linked to the higher aerosol opacity within the vortex. Potentially, this opacity shields phosphine from the UV light that would normally photolyse and remove it. Finally, the medium-resolution spectroscopy of the instrument was also used to search for spectral signatures of atmospheric species that cannot be detected from the ground. The 9.5 µm ammonia ice feature was not detected within the GRS wake on this occasion, possibly as a result of it not being present at the altitudes probed within this study, or due to it being rapidly coated by other species that obscure the spectral signature of the ammonia ice.

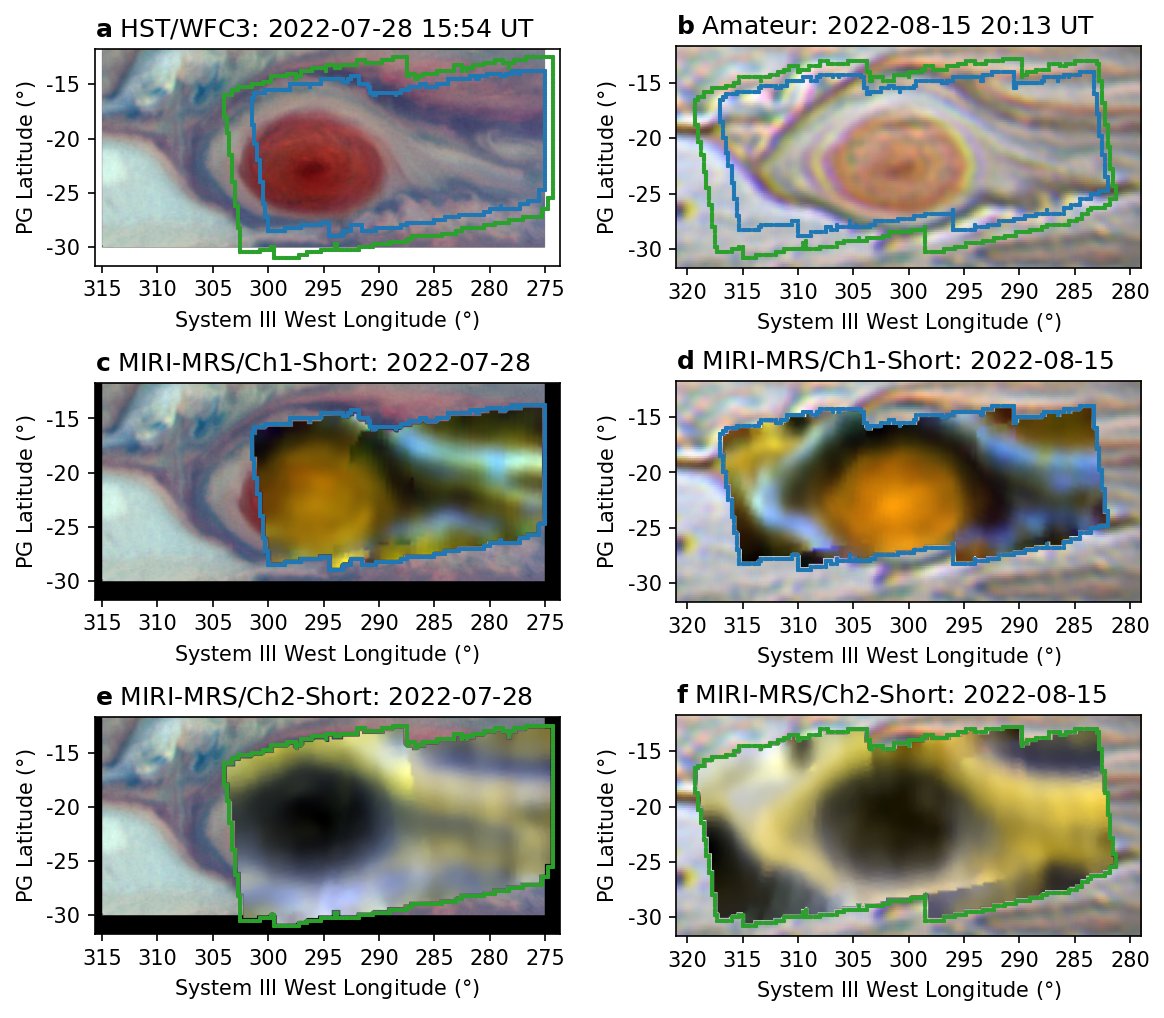
The MIRI data were also acquired alongside visible-light Hubble and near-infrared JWST/NIRCam observations taken close to the same date, probing the colourful upper aerosol layers. A comparison of this context data to the MIRI observations can be seen in Fig. 1. Further observations, courtesy of the VLT/VISIR instrument also provided additional mid-infrared data between the dates of the MIRI observations. This data visualised the whole Jovian disc and thus provided wider spatial context of the GRS’s interaction with the surrounding atmosphere. In this presentation we will: (i) introduce the retrieval methods used in this study; (ii) describe the inferred deep tropospheric aerosol structure and dynamics of the GRS; and (iii) using the spatial context observations, explore the interaction between the GRS aerosols and the surrounding atmosphere.


Figure 1: Comparison of False-colour JWST/MIRI data from channels 1 and 2 to visible context data from (a) Hubble (R=631 nm, G=502 nm, B=395 nm) and (b) Ground-Based amateur observations (Isao Miyazaki, 2024). The left-hand column displays data from 2022-07-28 while the right-hand column displays data from 2022-08-15. Differences in colour between the visible observations are due to different instruments and post-processing techniques being used. The size of the MIRI FOV is indicated by the blue and green lines for channels 1 and 2 respectively. (c) and (d) False-colour images of the ch1-short GRS MIRI data with the relevant visual context image as the background. For both MIRI images; B = 5.40 µm, G = 5.50 µm and R = 5.60 µm. The red band contains reflected sunlight from within a deep ammonia absorption band, indicating strong aerosol reflection rather than temperature. The green and blue bands are dominated by thermal emission, darker blue and green components outside the GRS therefore correspond to thick aerosol layers outside the GRS. (e) and (f) False-colour images of the ch2-short GRS MIRI data. For both; B = 8.62 µm, G = 8.57 µm and R = 8.56 µm. Beyond 7.30 µm, the Jovian spectrum is dominated by thermal emission, darker regions correspond to regions of high aerosol opacity and cooler temperatures. All frames have been shifted to be centred on the GRS longitudinal position in July and August. Subtle changes in colour between epochs are due to the different observing geometries of the observations.

How to cite: Harkett, J., Fletcher, L., King, O., Roman, M., Melin, H., Hammel, H., Hueso, R., Sánchez-Lavega, A., Wong, M., Milam, S., Orton, G., de Kleer, K., Irwin, P., de Pater, I., Fouchet, T., Rodríguez-Ovalle, P., Fry, P., and Showalter, M.: The Vertical Aerosol Structure of Jupiter’s Great Red Spot from JWST/MIRI 5 - 7 µm Spectroscopy, Europlanet Science Congress 2024, Berlin, Germany, 8–13 Sep 2024, EPSC2024-479, https://doi.org/10.5194/epsc2024-479, 2024.

15:15–15:25
|
EPSC2024-630
|
On-site presentation
José Ribeiro, Pedro Machado, Santiago Pérez-Hoyos, and Patrick Irwin

There is still some debate on the origin and distribution of Jupiter’s red colouration. Based on the red compound obtained in a laboratory by Carlson et al. (2016)[1] through the reaction of photolysed ammonia with acetylene, Stromovsky et al. (2017)[2] proposed the idea of a “universal chromophore” which was able to fit observations with Cassini/VIMS-V. Baines et al.(2019)[3] later concluded that the chromophore would be located in a thin layer above the ammonia clouds, which was known as the “Crème Brûlée” model. However, other models propose a different scheme, with a more extended and less blue absorbing chromophore layer, such as Pérez-Hoyos et al. (2020)[4] for a North Temperate Belt disturbance and Braude et al. (2020)[5] for the overall latitudinal structure, even without discarding the possible existence of a universal chromophore. More recently, Aguiano-Arteaga et al. (2023)[6] analysed HST/WFC3 images of Jupiter’s Great Red Spot, as well as its surroundings and the Oval BA. Their results suggest the presence of two colouring aerosols, one very similar to the “universal chromophore” proposed by Stromovsky et al. (2017)[2] and a new colouring species at tropospheric levels, below the main chromophore layer. This highlights that there is still some uncertainty on how the aerosols are vertically distributed and their properties as well as the temporal and spatial variability, which, at last instance, is linked to the unknowns related to the formation and the nature of the absorbing particles and their chemistry.

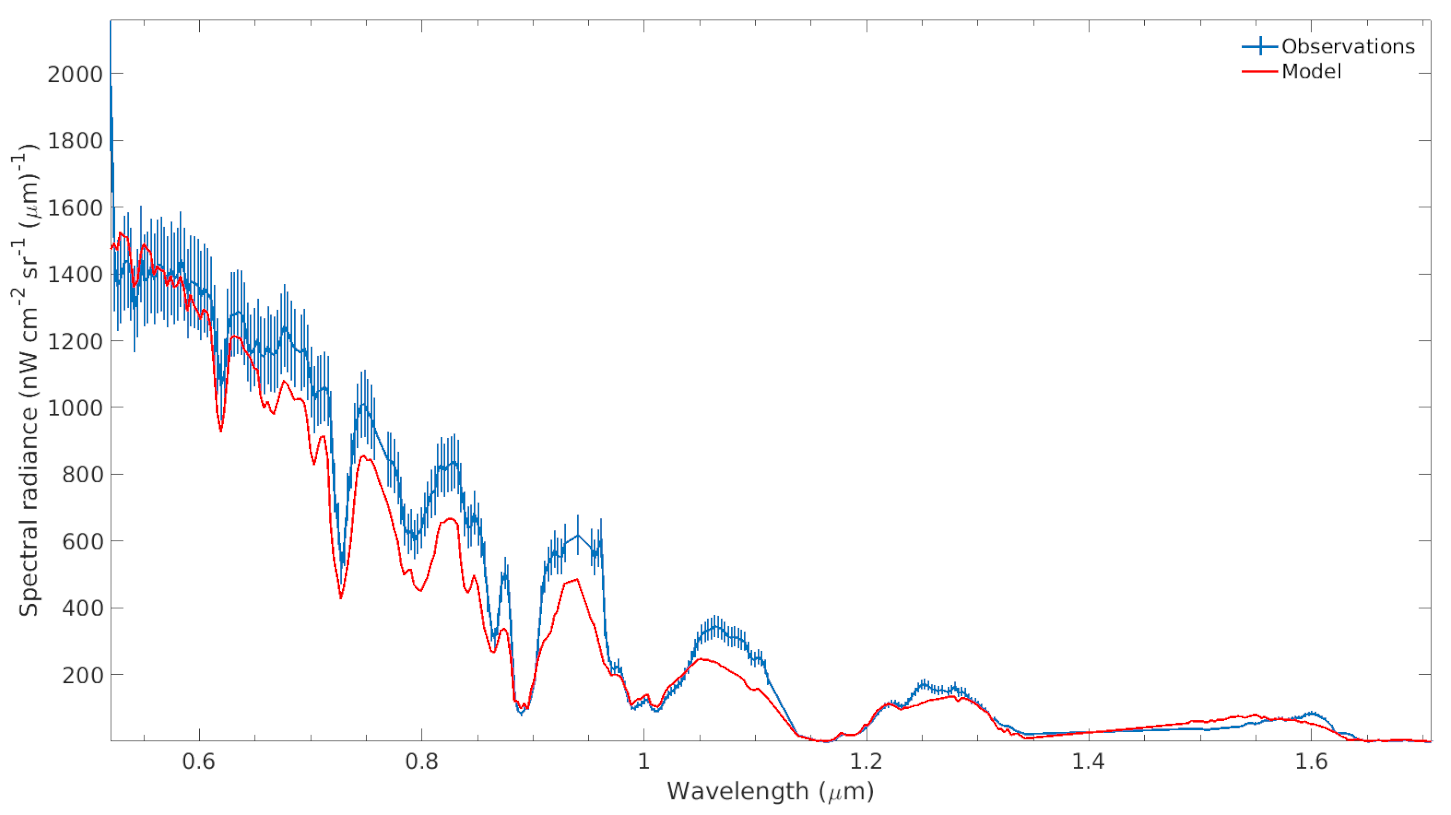
In this work, we analysed Jupiter spectra obtained for the first time with CARMENES in Calar-Alto in 2019. The Calar Alto high-Resolution search for M dwarfs with Exoearths with Near-infrared and optical Échelle Spectrographs is an instrument operating at the 3.5m telescope at the Calar Alto Observatory. It consists of two separated spectrographs covering the wavelength ranges from 0.52 to 0.96 µm and from 0.96 to 1.71 µm with spectral resolutions R = 80,000-100,000, each of which performs high-accuracy radial-velocity measurements (∼1 m s⁻¹) with long-term stability. While the observations in this work were taken for Doppler velocimetry purposes, we used here a downgraded resolution version (R = 173-570) so the observations match the available spectral data for methane, the dominant gaseous source of opacity in the Jovian spectra.

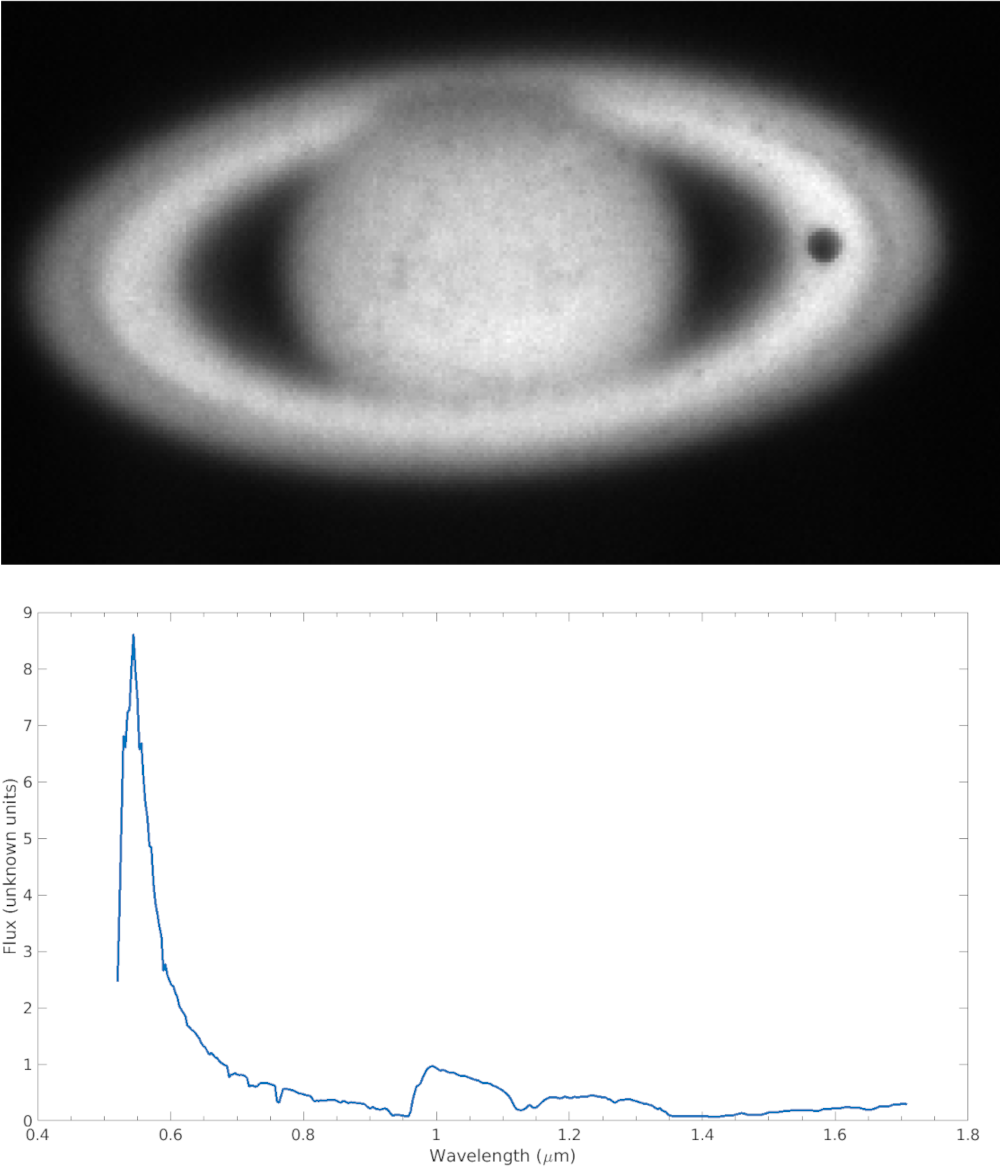
To achieve flux calibration, 2017 first-time observations of Saturn with CARMENES were used, in particular, the observations of Saturn’s B ring (Figure 1). We used these to obtain the response function of the instrument, no other sources of calibration being available at the desired resolution. We used the spectrum of Saturn’s B ring in terms of absolute reflectivity (I/F) from Poulet et al. (2003)[7] as the flux calibrator to calculate the response function. We checked the flux calibration and its uncertainty comparing with the normalized albedo spectrum of Saturn from Karkoskcha (1994)[8]. Lastly, we applied the flux calibration to the Jupiter observations and compared them with MUSE/VLT Jupiter observations from Braude et al. (2020)[5].

For this analysis, we used the NEMESIS (Nonlinear Optimal Estimator for MultivariatE Spectral analySIS) radiative transfer suite (Irwin et al., 2008 [9]). This tool allows coverage of both reflection and emission from any planetary atmosphere in scattering and non-scattering environments. The code utilizes an optimal estimator method (Rodgers, 2000) [10] to find the best plausible values of the parameters that define the atmospheric model, with an a priori parametrization of the atmosphere and the observational uncertainties as the starting point. Our goal is to retrieve aerosol properties from the Jovian atmosphere using the NEMESIS radiative transfer suite, in order to constrain the cloud and aerosol vertical distribution as well as the chromophore(s) properties that give Jupiter its reddish colouration in some bands and storms. In particular, we want to compare different competing vertical models, with an extended or concentrated chromophore layer. For doing so, we used spectra from both the centre of the disk as well as near the limb in order to highlight the effects of the aerosols when Jupiter is observed from various viewing angles. We present here our first exploratory results from this analysis.


Figure 1: One of the CARMENES guiding camera images and visible and NIR spectra of Saturn's B ring used for flux calibration

Figure 1: One of the CARMENES guiding camera images and visible and NIR spectra of Saturn's B ring used for flux calibration


Figure 2: First model spectrum obtained (red) when compared with the observations (blue) after retrieving two aerosol density profiles.


References:

  • Carlson, R. W., et al. (2016). Chromophores from photolyzed ammonia reacting with acetylene: Application to Jupiter's Great Red Spot. Icarus, 274, 106–115.

  • Sromovsky, L. A., et al. (2017). A possibly universal red chromophore for modeling color variations on Jupiter. Icarus, 291, 232–244.

  • Baines, K. H., et al. (2019). The visual spectrum of Jupiter's Great Red Spot accurately modeled with aerosols produced by photolyzed ammonia reacting with acetylene. Icarus, 330, 217–229.

  • Pérez-Hoyos, S., et al. (2020). Color and aerosol changes in Jupiter after a North temperate belt disturbance. Icarus, 132, 114021.

  • Braude, A. S., et al. (2020). Colour and tropospheric cloud structure of Jupiter from MUSE/VLT: Retrieving a universal chromophore. Icarus, 338, 113589.

  • Anguiano-Arteaga, A., et al.(2023). Temporal variations in vertical cloud structure of Jupiter's Great Red Spot, its surroundings and Oval BA from HST/WFC3 imaging. Journal of Geophysical Research: Planets, 128, e2022JE007427.

  • Poulet, F., et al. (2003). Compositions of Saturn's rings A, B, and C from high resolution near-infrared spectroscopic observations. A&A, 412, 1, 305–316.

  • Karkoschka, E. (1994). Spectrophotometry of the Jovian Planets and Titan at 300- to 1000-nm Wavelength: The Methane Spectrum. Icarus, 111, 1, 174–192.

  • Irwin, P., et al. (2008). The NEMESIS planetary atmosphere radiative transfer and retrieval tool. J. Quant. Spectrosc. Radiat. Transf., 109, 1136–1150.

  • Rodgers CD. (2000). Inverse methods for atmospheric sounding: theory and practice. Singapore: World Scientific.

How to cite: Ribeiro, J., Machado, P., Pérez-Hoyos, S., and Irwin, P.: Retrieving Jovian aerosol properties from CARMENES spectra: exploratory results, Europlanet Science Congress 2024, Berlin, Germany, 8–13 Sep 2024, EPSC2024-630, https://doi.org/10.5194/epsc2024-630, 2024.

15:25–15:35
Exoplanets
15:35–15:45
|
EPSC2024-13
|
On-site presentation
Veronique Vuitton, Cedric Wolters, Isabelle Schmitz, Chao He, Francois-Regis Orthous-Daunay, Sarah Moran, Carlos Afonso, Sarah Horst, Nikole Lewis, and Julianne Moses

Transmission spectra have suggested that condensate clouds and/ or photochemical haze are present in the atmospheres of many temperate to warm exoplanets [1]. Aerosols can affect atmospheric composition directly through condensation and heterogeneous reactions, and indirectly by impacting the depth of penetration of photolyzing radiation, as well as the thermal structure and dynamics [2]. However, haziness may not be simply controlled by a single or a simple combination of planetary/stellar parameters [3,4]. We still need more observations, modeling work, and laboratory experiments to fully understand the complex physical and chemical processes that lead to hazy exoplanet atmospheres [5].

We have performed a series of laboratory atmosphere simulation experiments dedicated to the synthesis of haze analogues (tholins) under a broad range of atmospheric compositions and temperature (from 102× to 104× solar metallicity, 300–800 K) relevant to sub-Neptunes. In the solid organic material produced from a gas mixture designed to be analogous to a 103× solar metallicity exoplanet atmosphere at 400 K, thousands of molecular species with general chemical formulae C𝑐HhN𝑛O𝑜 were detected with very high-resolution mass spectrometry, possibly including some of prebiotic interest [6]. These measurements, performed on the soluble phase, represent only a fraction of the total sample. Here, we extend this previous study to focus on the difference between the soluble fraction, insoluble fraction and the bulk composition using a Fourier transform ion cyclotron resonance mass spectrometer coupled with a laser desorption ionization source (LDI-FTICR).

Laboratory analogues were synthesized at Johns Hopkins University in the PHAZER setup by exposing a gas mixture of 56% H2O, 14.7% He, 11% CH4, 10% CO2, 6.4% N2, and 1.9% H2 to an AC glow discharge. The gas mixture flows continuously through a stainless-steel reaction chamber. The produced particles are retrieved from the chamber’s inside wall, transferred to plastic vials and kept in an inert atmosphere, in the dark. More details about sample production and recovery can be found in [7].

A Fourier transform ion cyclotron resonance mass spectrometer (FTICR Solarix XR equipped with a 12 T superconducting magnet, Bruker available in the COBRA laboratory, at the University of Rouen, France) coupled with a laser desorption ionization source (LDI laser Nd:YAG×3 355 nm) was used to acquire ultra-high-resolution mass spectra (mass resolving power 𝑚∕Δ𝑚50% of 1,500,000 at m/z 150 and 500,000 at m/z 500). Analyses were performed in the m/z 100-1000 range in both positive and negative mode. To treat the data, we use the Attributor software that has been developed at IPAG for non-targeted analysis of mass spectrometry data, using IGOR Pro (WaveMetrics, USA). The detailed procedure used for the data treatment and validation is described in Cédric Wolters’ PhD thesis [8].

In order to determine the similarities between the soluble and insoluble fractions, we compare all the assignments and generate a Venn diagram, as shown in Figure 1. The Venn diagram shows that about one-third of the molecules assigned (7780 out of 23702) are present in all three phases. The majority of molecules detected in the bulk (14443) are found either in both the soluble and insoluble phase (7780), or only in the insoluble phase (5048). There is also a significant number of molecules unique to both the soluble fraction (3274), insoluble fraction (4993) or both (992), that are not found in the bulk, likely because of ionisation/sensitivity issues. This is in line with the findings of [9] for Titan tholins. Furthermore, the fractions present different overall characteristics in terms of unsaturation and content in heteroatoms. This may have some consequences for the ability of haze particles to act as cloud condensation nuclei in water-rich exoplanet atmospheres [9].
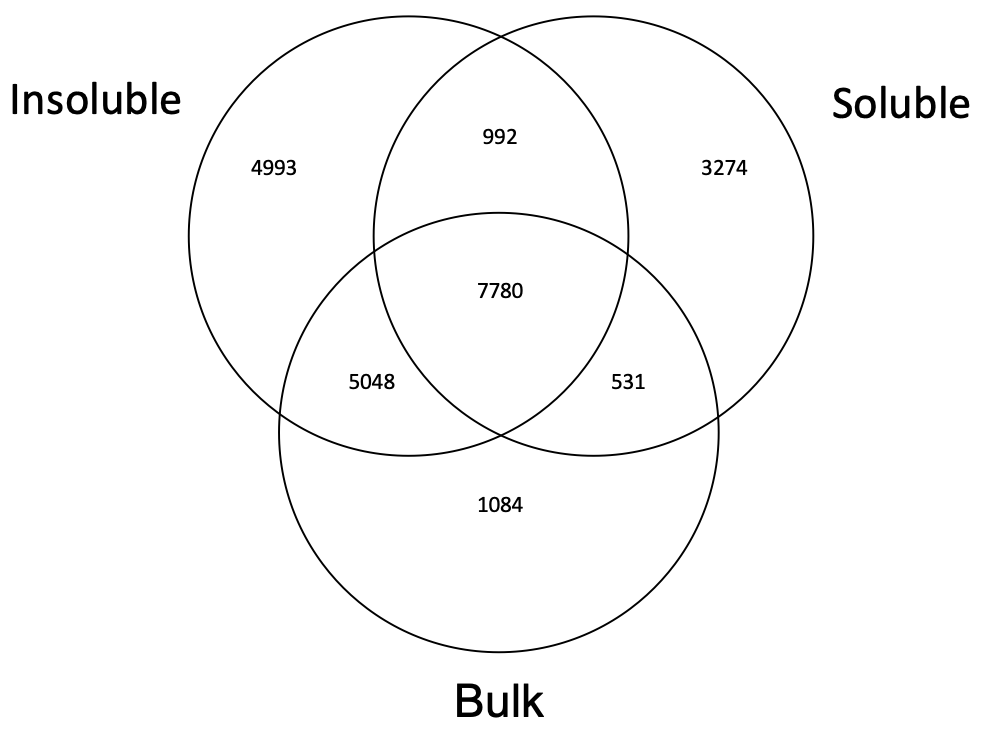
Figure 1: Venn diagram of the number of assignments for the soluble and insoluble fractions and bulk. Assignments common to each sample are shown in the intersecting spaces.

Acknowledgements

This work was supported by the French National Research Agency in the framework of the Investissements d’Avenir program (ANR-15-IDEX-02), through the funding of the "Origin of Life" project of the Univ. Grenoble-Alpes and the French Space Agency (CNES) under their Exobiology and Solar System programs. C. Wolters obtained a PhD fellowship from CNES/ANR (ANR-16-CE29-0015 2016-2021). C. He was supported by the Morton K. and Jane Blaustein Foundation. S.E. Moran was supported by NASA Earth and Space Science Fellowship Grant 80NSSC18K1109. Portions of this study were supported by NASA Exoplanets Research Program Grant NNX16AB45G. Access to the Centre National de la Recherche Scientifique (CNRS) FTICR research infrastructure Infranalytics (FR2054) is gratefully acknowledged.

References

[1] Madhusudhan, N., 2019. Exoplanetary Atmospheres: Key Insights, Challenges, and Prospects. Annu. Rev. Astron. Astrophys. 57, 617–663. doi:10.1146/annurev-astro-081817-051846.

[2] Mills, F.P., Moses, J.I., Gao, P., Tsai, S.M., 2021. The Diversity of Planetary Atmospheric Chemistry. Space Sci. Rev. 217, 43. doi:10.1007/ s11214- 021- 00810- 1.

[3] Dymont, A.H., Yu, X., Ohno, K., Zhang, et al., 2022. Cleaning Our Hazy Lens: Exploring Trends in Transmission Spectra of Warm Exoplanets. Astrophys. J. 937, 90. doi:10.3847/1538-4357/ac7f40.

[4] Estrela, R., Swain, M.R., Roudier, G.M., 2022. A Temperature Trend for Clouds and Hazes in Exoplanet Atmospheres. Astrophys. J. Lett. 941, L5. doi:10.3847/2041-8213/aca2aa.

[5] Gao, P., Wakeford, H.R., Moran, S.E., Parmentier, V., 2021. Aerosols in Exoplanet Atmospheres. J. Geophys. Res.-Planet 126, e06655. doi:10.1029/2020JE006655.

[6] Moran, S.E., Hörst, S.M., Vuitton, V., He, C., et al., 2020. Chemistry of Temperate Super-Earth and Mini-Neptune Atmospheric Hazes from Laboratory Experiments. Planet. Sci. J. 1, #17. doi:10.3847/PSJ/ab8eae.

[7] He C., Hörst, S.M, Lewis N.K., Yu, X., et al., 2018. Laboratory Simulations of Haze Formation in the Atmospheres of Super-Earths and Mini-Neptunes: Particle Color and Size Distribution, Astrophys. J. Lett., 856, L3. doi: 10.3847/2041-8213/aab42b

[8] Wolters, C., 2021. Caractérisation moléculaire d’échantillons organiques complexes par spectrométrie de masse et chromatographie en phase liquide. Ph.D. thesis. Université Grenoble Alpes.

[8] Maillard, J., Carrasco, N., Schmitz-Afonso, I., Gautier, T., Afonso, C., 2018. Comparison of soluble and insoluble organic matter in analogues of Titan’s aerosols. Earth Planet. Sc. Lett. 495, 185–191. doi:10.1016/j.epsl.2018.05.014.

[9] Yu, X., He, C., Zhang, X., Hörst, S.M., et al.., 2021. Haze evolution in temperature exoplanet atmospheres through surface energy measurement. Nature Astronomy 5, 822-831. doi:10.1038/s41550-021-01375-3.
How to cite: Vuitton, V., Wolters, C., Schmitz, I., He, C., Orthous-Daunay, F.-R., Moran, S., Afonso, C., Horst, S., Lewis, N., and Moses, J.: Experimental investigation of the molecular composition of organic hazes in a water-rich exoplanet atmosphere, Europlanet Science Congress 2024, Berlin, Germany, 8–13 Sep 2024, EPSC2024-13, https://doi.org/10.5194/epsc2024-13, 2024.

15:45–15:55
|
EPSC2024-945
|
On-site presentation
Louis Maratrat, Nathalie Carrasco, Audrey Chatain, Arnaud Buch, Ludovic Vettier, Thomas Drant, Yassin Jaziri, Orianne Sohier, and Maeva Millan

Context

Photochemical hazes, which are aerosols formed by photochemical reactions, can be an abundant source of complex organic matter. Titan’s aerosols, produced in the N2/CH4 atmosphere of the biggest Moon of Saturn, are probably the most relevant example to illustrate the molecular complexity and diversity that can be contained in such hazes (Pernot et al 2010). Many studies performed on analogs of Titan’s aerosols synthetized in laboratory called Tholins, have revealed the presence of very diversified CxHyNz aliphatic (nitriles, amines) (Gautier et al 2011) and aromatic (notably N-aromatic) (Maillard et al 2021) organic compounds. Among this complex array of nitrogenous organics, prebiotic molecules such as adenine has already been identified (Neish et al 2010). Moreover, the hydrolysis of such material is also a source of amino acids, and other canonical DNA & RNA bases (Neish et al 2009). These results thus justify the importance of photochemical hazes in prebiotic chemistry. In this perspective, considering other analogs of organic photochemical aerosols appears to be interesting notably for sulfur. Sulfur is indeed one of the fundamental elements of life, the famous C,H,N,O,P,S, but despite its abundance in the molecule of living (in amino acids methionine and cysteine for example), it is still not understood how it could have been incorporated into organic matter. That is why the synthesis of sulfur organic aerosols can give clues for prebiotic sulfur chemistry. But such synthesis also allows to explore the atmospheric chemistry of sulfur which has not been fully studied experimentally so far (He et al 2020) and is very important in the context of the JWST mission. IR signatures of SO2 have indeed been detected in different types of exoplanets: in the hot Jupiter WASP-39b (Tsai et al 2023), and potentially in two temperate sub-Neptunes TOI-270d (Benneke et al 2024) and WASP-107b (Dyrek et al 2023).

Methods

The objective of this work was to synthetize organic sulfur aerosols to consider their potential input of organic matter for prebiotic chemistry. To do so, several gaseous mixtures based on N2/CH4 (95/5), which is very efficient for organic growth, have been considered. More precisely, four different gaseous mixtures of N2/CH4/SO2 with varying SO2 content (0, 0.1, 1, and 10%) were used to produce analogs of aerosol in a DC plasma setup. The solids were then analyzed by elementary analysis, and FT-IR, while the gas phase has been characterized with a quadrupole mass spectrometer.

The FT-IR, and elementary analysis will provide a global characterization of the chemical composition of the solid materials produced to infer their potential organic content potentially interesting for prebiotic chemistry.

First MS results

Considering the MS gas phase analysis, the comparison between the different mass spectra of the four tested gas mixtures reveal big contrasts. The presence of SO2 appears to be detrimental to organic growth necessary for the formation of organic aerosols. As shown in Figure 1, C3 and C4 nitriles, major gaseous products of this organic growth, are observed especially in the most SO2 depleted conditions.

How to cite: Maratrat, L., Carrasco, N., Chatain, A., Buch, A., Vettier, L., Drant, T., Jaziri, Y., Sohier, O., and Millan, M.: Sulphur organic aerosols and their contribution to prebiotic chemistry , Europlanet Science Congress 2024, Berlin, Germany, 8–13 Sep 2024, EPSC2024-945, https://doi.org/10.5194/epsc2024-945, 2024.

15:55–16:00

Posters: Mon, 9 Sep, 10:30–12:00 | Poster area Level 2 – Galerie

Display time: Mon, 9 Sep, 08:30–Mon, 9 Sep, 19:00
Chairpersons: Panayotis Lavvas, Anni Määttänen, Audrey Chatain
Terrestrial Bodies
P37
|
EPSC2024-429
|
On-site presentation
|
Hiroki Karyu, Takeshi Kuroda, Takeshi Imamura, Naoki Terada, Ann Carine Vandaele, Arnaud Mahieux, and Sébastien Viscardy

Venus is globally covered by thick hydrated sulfuric acid (H2SO4) aerosols, which play a pivotal role in the Venusian atmospheric system. The condensation and evaporation processes affect the abundance of H2SO4 vapor and H2O vapor and the chemistry related to these species. Additionally, the aerosol distribution serves as a key indicator for atmospheric dynamics. Thus, studying aerosol processes is vital for understanding various atmospheric phenomena.

The Solar Occultation in the Infrared (SOIR) instrument aboard the Venus Express (VEx) spacecraft measured the mesospheric aerosol and gas vertical profiles closely linked to these condensation and evaporation processes. These observations showed that the upper haze layers can reach altitudes up to 100 km, with the water vapor concentration increasing with altitude. However, the dynamics that maintain these aerosol layers at such altitudes and the interactions between aerosols and gases remain poorly understood.

To investigate these interactions, we developed a one-dimensional cloud microphysics model that simulates the distribution of H2SO4 vapor, H2O vapor, and H2SO4-H2O aerosols from 40 to 100 km (Karyu et al. 2024). To examine how gases and aerosols are transported, we conducted case studies with four distinct patterns of eddy diffusion coefficients between altitudes of 60–70 km and 85–100 km. In addition, we performed an additional case study using a temperature profile obtained by VEx/SOIR (Mahieux et al. 2015, 2023) to examine the impact of the temperature on the gas species and aerosol distributions.

We found that the high eddy diffusion coefficients derived by Mahieux et al. (2021) significantly enhance the model's ability to replicate the observed distribution of upper haze. This indicates that efficient eddy transport is critical to defining the microphysical properties of the haze layer. Variations in these coefficients also influenced the vertical distribution of water vapor, affecting its overall presence within and above the cloud layers. The H2SO4 VMR in the upper haze layer is also highly sensitive to the eddy diffusion coefficient above 85 km, ranging from ~5 pptv to ~0.5 ppbv. However, the simulated values are orders of magnitude lower than the observational upper limit suggested by Sandor et al. (2012). Finally, the present study identifies the best-fit eddy diffusion coefficients as ∼360 m2 s−1 above 85 km and ∼2 m2 s−1 between 60 and 70 km.

Moreover, the temperature profile, especially when updated with the recent SOIR data, has a marked effect on the modeled concentrations of H2O and H2SO4 vapors. Higher temperatures in the SOIR profile resulted in greater saturation vapor pressures, leading to the evaporation of upper haze particles and increased vapor concentrations. As a result, the H2O VMR profile aligns well with SOIR observations. This underlines the critical role of aerosol evaporation in the transport of H2O vapor in the Venusian mesosphere.


Karyu, H., Kuroda, T., Imamura, T., et al. 2024, PSJ, 5, 57

Mahieux, A., Vandaele, A. C., Bougher, S. W., et al. 2015, P&SS, 113, 309

Mahieux, A., Yelle, R. V., Yoshida, N., et al. 2021, Icar, 361, 114388

Mahieux, A., Robert, S., Piccialli, A., et al. 2023, Icar, 405, 115713

Sandor, B. J., Clancy, R. T., & Moriarty-Schieven, G. 2012, Icar, 217, 839

How to cite: Karyu, H., Kuroda, T., Imamura, T., Terada, N., Vandaele, A. C., Mahieux, A., and Viscardy, S.: One-dimensional Microphysics Model of Venusian Clouds from 40 to 100 km: Impact of the Middle-atmosphere Eddy Transport and SOIR Temperature Profile on the Cloud Structure, Europlanet Science Congress 2024, Berlin, Germany, 8–13 Sep 2024, EPSC2024-429, https://doi.org/10.5194/epsc2024-429, 2024.

P38
|
EPSC2024-644
|
On-site presentation
Jeremie Lasue, Anni Määttänen, Lola Falletti, Augustin Grunewald, Eliott Marceau, Michael Zolensky, and François Ravetta

Introduction

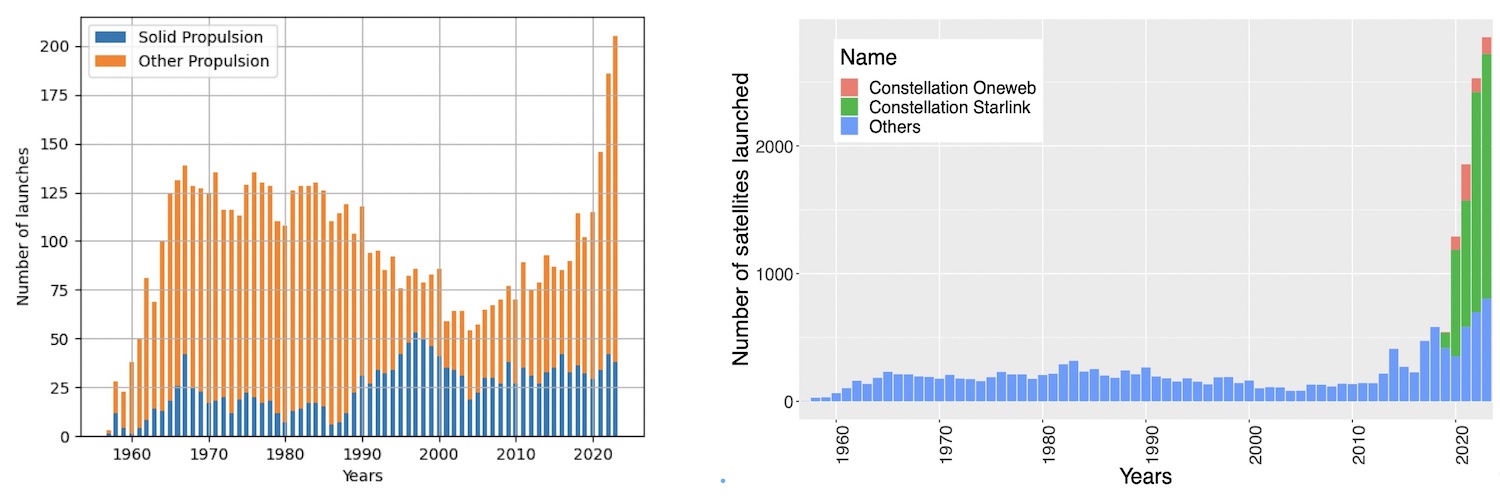
The life cycle of a spacecraft starts and ends in the Earth’s atmosphere: it interacts with the atmosphere right after the launch and during the atmospheric reentry when it usually mostly ablates. Both phases induce emissions of gases and solid particles, providing a source of these components in the middle atmosphere, particularly in the stratosphere. Little is known about the exact nature, composition and effects of these emissions on the atmosphere and climate, but their impact is expected to rise as more and more orbiting satellites are launched and inevitably re-enter. Since 2000, the number of space rockets launched per year has increased by a factor 3 globally. At the same time, the number of satellites launched in orbit around the Earth per year has increased by about a factor of 30 (Fig. 1). One may wonder whether this volume of anthropogenic material injected into the terrestrial stratosphere can be detected and what the consequences may be.

Figure 1: Rocket launches and satellites injected in orbit per year (source: McDowell, J. "Launch Vehicle Database", 2023).

Studying stratospheric materials injection

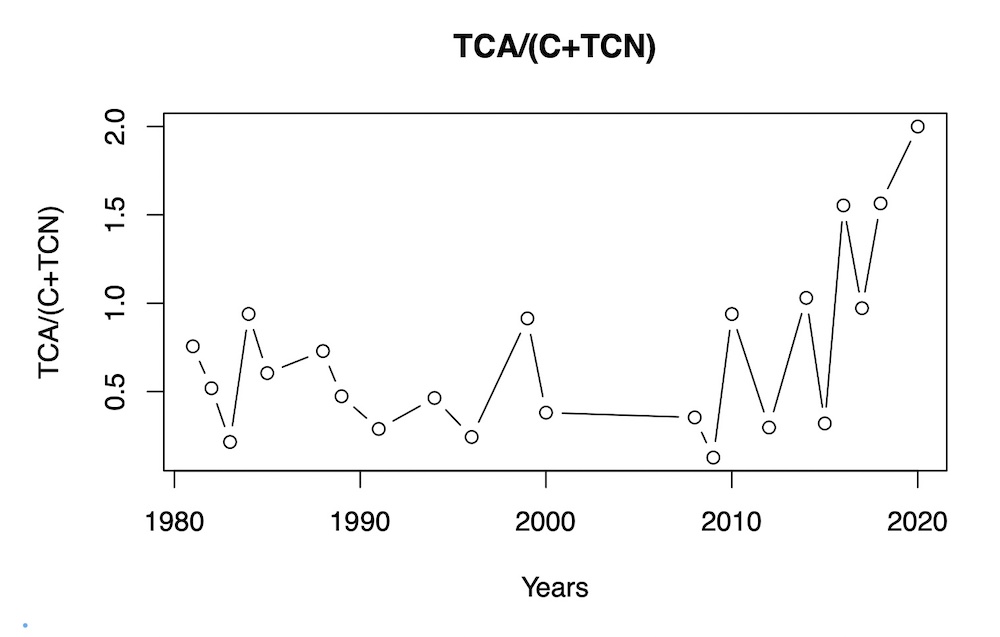
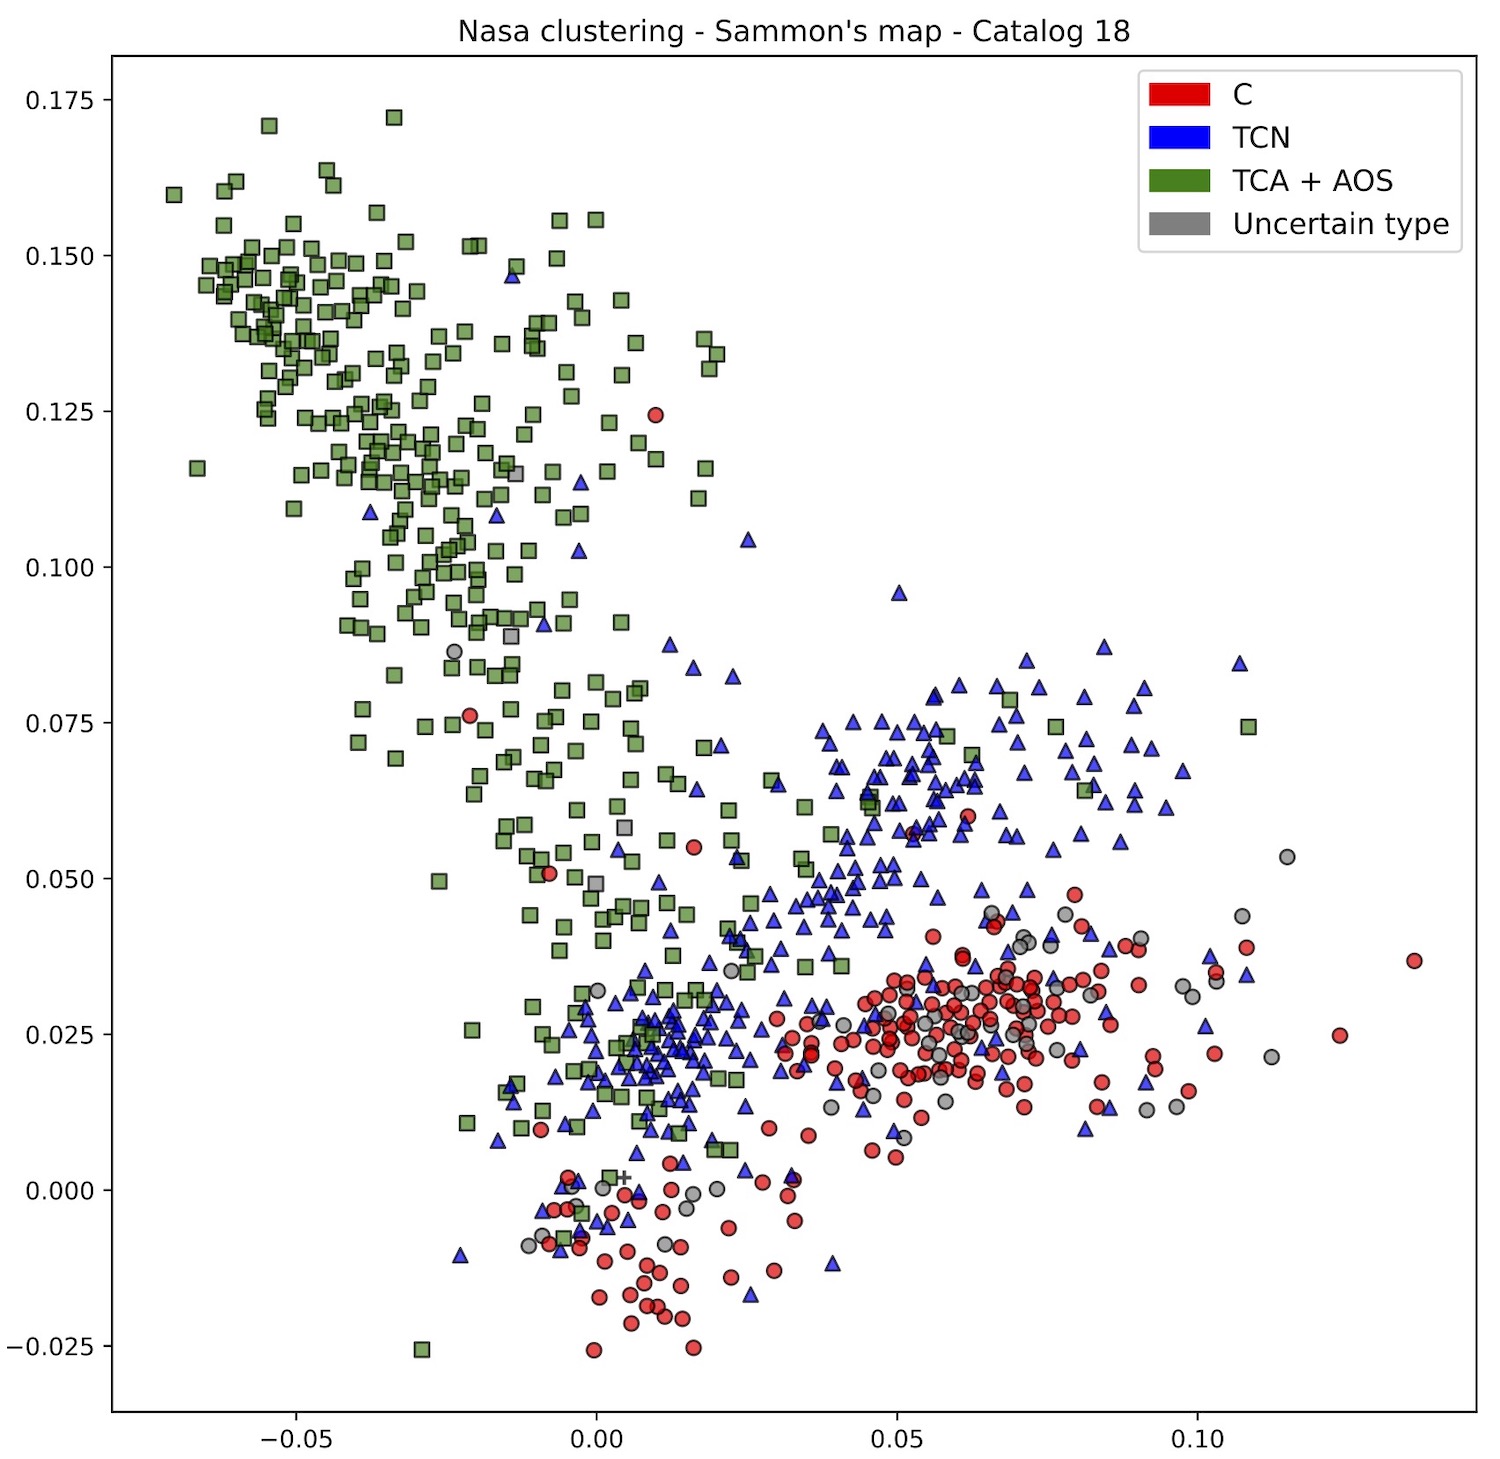
In order to study the cosmic dust particles arriving on Earth, the NASA Johnson Space Center (JSC) has been systematically collecting solid dust particles from the Earth’s stratosphere by aircraft equipped with dedicated particle collectors since 1981. So far, 25 catalogs have been published, covering campaigns of collection from 1981 to 2020, with a total of 5071 solid particles that have been preliminarily characterized and curated. In this work, we use the preliminary classification of the dust particles. Based on SEM images and EDS compositions the collected dust is separated into four groups: C (Cosmic), TCN (Terrestrial Contaminant Natural), TCA (Terrestrial Contaminant Artificial) and AOS (Aluminum Oxide Sphere). The AOS being mostly generated by solid rocket propellant, they also belong to the TCA class. A 10-fold increase in stratospheric solid particles was previously noticed in the 1970s - 1980s and linked to an increase in rocket launches, but this effort has not been continued (Zolensky et al. 1989). Assuming the sampling and processing of the stratospheric particles collection are unbiased, the cosmic dust catalog database can reflect long-term temporal changes in the stratospheric solid particles compositions. Our analysis of the published data indicates that from 1980 to 2009 the cosmic dust particles typically represent on average 40% of the collection with TCA and TCN corresponding to about 30% each. In recent years, the TCA fraction has doubled to about 60% of the collection (Fig. 2, 2010-2020). This increase in anthropogenic particles is likely due to the overall human space activity and its recent increase. Further classification of the collected dust particles by composition should be performed to better assess their origins (from launchers or satellites, Fig. 3).

Figure 2: Number of particles of different origins from the NASA stratospheric collection. Recent years reflect an increase in anthropogenic contaminant particles (source: NASA Cosmic dust catalogs 1 to 25; Lasue et al. 2024).

Figure 3: Nonlinear two-dimensional projection (Sammon’s map) of the EDS composition of NASA Cosmic dust particles catalog 18, illustrating the visual separation of the main types of particles collected.

Collection of liquid stratospheric aerosols by the NASA aircraft SABRE program have also shown that those materials are affected by space activities. About 10% of stratospheric sulfuric acid particles larger than 120 nm in diameter contain aluminum and other elements from spacecraft reentry (Murphy et al. 2023). These levels of metallic contents are expected to increase in the future with unknown effects on the atmosphere and its physical processes.

Simulating the atmospheric impact

Atmospheric reentry effects on the atmosphere are largely unknown. But they will increase as low-earth orbit constellations of satellite develop further.

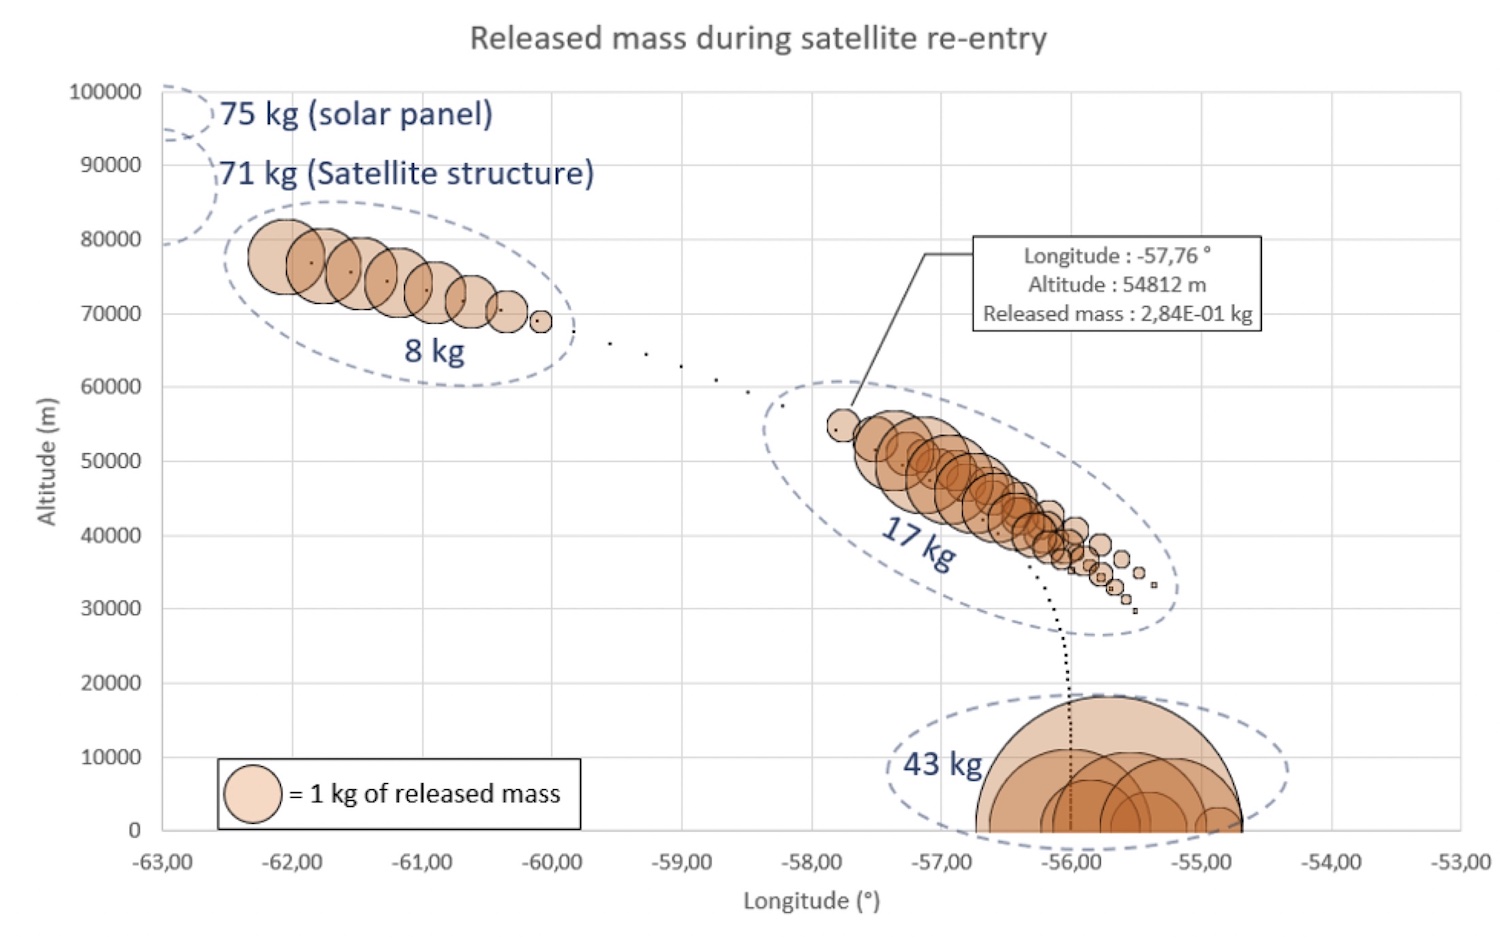
We intend to model the reentry and the fate of the ablated material with numerical models. The first of these is DEBRISK (Annaloro 2020; 2024), developed by the French Space Agency CNES. DEBRISK performs detailed modelling of the demise in the atmosphere of a given object (satellite/debris/…) on a given orbit that can both be described in detail. As output parameters, the model can provide, for example, the ablated mass as a function of altitude in the atmosphere (Fig. 4). Calculation of average mass profiles for the most common satellite types and estimates of the number of reentries per year will allow us to make useful estimates of the mass injected in the atmosphere annually and its evolution. These will be compared to other estimates published in the literature.

Figure 4: Repartition in altitude and longitude of the released mass, during a 214 kg (dry mass) Starlink satellite re-entry.

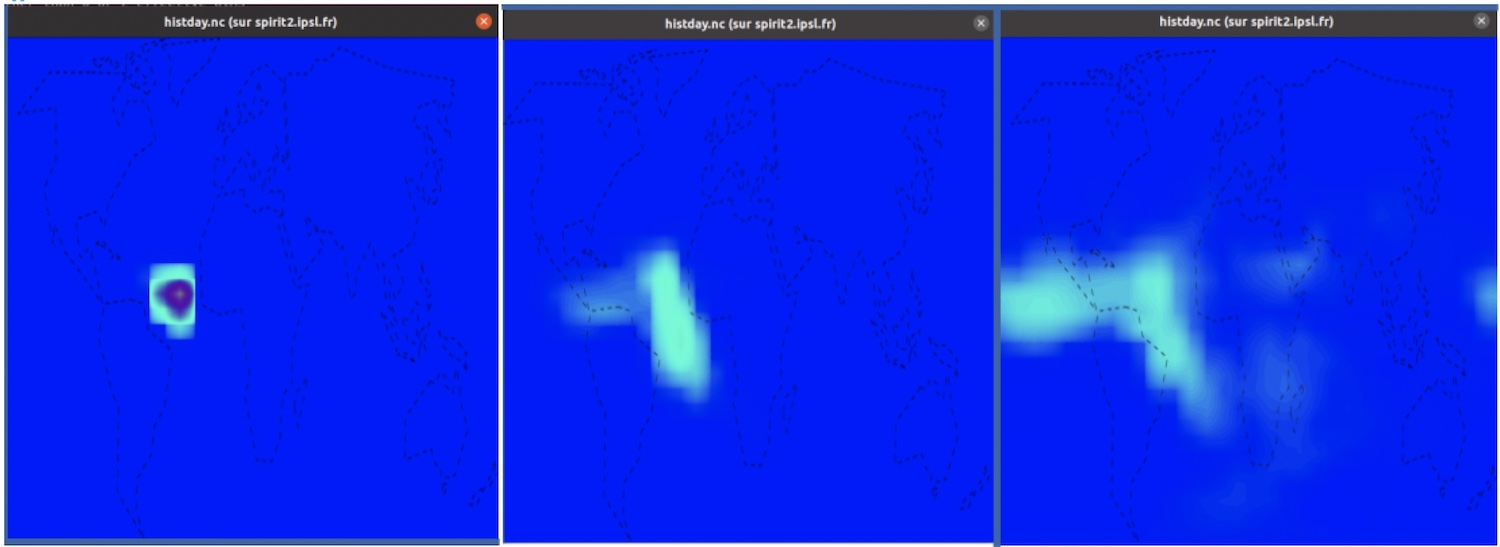
The second model is a Global Climate Model, the IPSL-LMDZ version 6 (Hourdin et al. 2020) that includes a description of the stratospheric sulfate aerosols (Kleinschmitt et al., 2013). This code needs to be slightly modified so that it can model particles not composed of a sulfuric acid solution. Before making the modifications, we will do low-resolution tests by using a passive tracer, i.e., a variable that is only transported in the model and that is not modified by any other processes. The final goal is to use as inputs the estimates of average annual injected mass profiles from DEBRISK, and model the fate of these particles in the atmosphere including the modeling of their microphysical processes and potentially their heterogeneous chemistry (Fig. 5).

Figure 5: Evolution of a mass of particles during 21 days, on the LMDZ climate model (low resolution) 2 days (left), 12 days (middle) and 21 days (right) after injection

Perspectives

Future work will be dedicated to better identify the natural and anthropogenic particles collected and described in the existing databases and develop new modes of collection. We will also use numerical modelling to produce quantitative estimates of the injected mass, the lifetime of particles in the middle atmosphere (stratosphere) and the relative abundances of the anthropogenic particles with respect to the stratospheric background aerosol population.

How to cite: Lasue, J., Määttänen, A., Falletti, L., Grunewald, A., Marceau, E., Zolensky, M., and Ravetta, F.: Assessing the contamination of the Earth’s stratospheric aerosol layer due to space activities, Europlanet Science Congress 2024, Berlin, Germany, 8–13 Sep 2024, EPSC2024-644, https://doi.org/10.5194/epsc2024-644, 2024.

P39
|
EPSC2024-813
|
ECP
|
On-site presentation
Iida Kostamo, Johanna Salminen, Anu Kaakinen, Outi Meinander, Antti Penttilä, and Karri Muinonen

Introduction

Atmospheric dust has large-scale effects on planetary radiation, global climate, and biogeochemical cycles, and is therefore a critical component of the Earth’s climate. However, the dynamics and impact of the dust is poorly understood (e.g., [1]). Particularly two strong absorbers of solar energy, magnetic minerals and giant particles, have been neglected in aerosol and climate models (e.g., [2][3]). The effects of magnetic (nano)particles can be comparable to black and brown carbon, they promote ice nucleation and play a role in cloud formation (e.g., [4]). It has been recently discovered that strong winds are able to carry even the giant particles (≥ 100 μm) long distances, from Sahara to Iceland [5]. Despite their global importance, both the magnetic nanoparticles and the giant particles remain poorly described. The optical and light scattering properties and the exact mechanism by which these particles initiate ice nucleation are not yet understood.

Our project combines experimental and theoretical approaches to enhance our understanding of giant particles and magnetic minerals in atmospheric dust, utilising methods from both geosciences and physics. Ultimately, our work aims to contribute to characterising the particles and their source areas, long-range transport, and scattering effects, to be utilised in emission, transport, and deposition modelling, and in climate models.

Dust samples

The research material consists of Saharan dust that was deposited in Finland and collected as citizen science samples by the Finnish Meteorological Institute during 2021. The citizen science initiative yielded samples from 525 locations, with one or more samples collected from each site. The first results regarding some of the dust samples were published in 2023 [6]. The multidisciplinary study showed that the Saharan dust deposited in Finland originated from the Sahel desert (south of Sahara), based on the magnetic properties of the particles, and the System for Integrated modeLling of Atmospheric coMposition (SILAM) model (silam.fmi.fi). These results are an encouraging starting point for a more detailed analysis of the remaining > 500 samples.

Methods

This study begins by using mineralogical, geochemical, and magnetic methods to identify and characterise the particles in the Saharan dust samples. The particle grain-size and shape distribution are fundamental for understanding and predicting atmospheric residence times, optical properties, transport, and settling processes. Laser grain-size analyser and both dynamic and static image analyses will be used to determine the grain-sizedistributions and the particle shape (incl. sphericity, roundness, and aspect ratio). Bulk petrography and heavy mineral analysis provides the framework for the geological classification and yields information on the source, and both sedimentary and the pre-aeolian transport processes.

Magnetic mineral characterisation is fundamental for source discrimination and for understanding both atmospheric optical and cloud formation properties. Magnetic methods are non-destructive and powerful in characterising the type, particle size, and quantity of magnetic materials. Measurements will be carried out in order of increasing magnetic field: initial susceptibility with two frequencies, NRM demagnetisation, anhysteretic remanence, and isothermal remanence.

The research then focuses on the scattering and absorption of light by these particles, both experimentally and theoretically. The scattering matrix measurements will be conducted to analyse the physical and chemical characteristics, such as shape and composition, of the particles. The experimentally obtained information will then be used for developing the theoretical modelling of the particles, using numerical methods [7][8][9][10]. This is the first time when the scattering studies will culminate in an analysis of radiative effects of both the giant and magnetic particles in the Earth’s atmosphere.

For bulk material optical properties, the modular integrating-sphere spectrometer will be used to determine the reflection and absorption spectra of particles in the ultraviolet-visual-near-infrared wavelength range. The spectral directional scattering from a particle layer will be measured with a goniometer. For light scattering properties, the 4 × 4 scattering matrix of a dust particle relates the Stokes parameters (intensity with linear and circular polarisation) of the incident light to the Stokes parameters of the scattered light. In Helsinki, the unique acoustic levitator facility allows for measurements of the upper left-hand 2 × 2 block of the scattering matrix for a large particle in controlled position and orientation. The aim of the measurements is to develop profound shape, structure, and compositional models for these particles. The scattering matrix and bulk optical property measurements will be matched with particle models of varying sophistication and a study follows on the implications of the particle absorption and scattering properties in atmospheric radiative energy transfer.

References

[1] B.A. Maher et al. Earth Science Reviews, 99(1-2):61–97, 2010.
[2] A.A. Adebiyi and J.F. Kok. Science Advances, 6(15), 2020.
[3] N. Moteki et al. Nature Communications, 8(15329), 2017.
[4] B.A. Maher. Aeolian Research, 3(2):87–144, 2011.
[5] G. Varga et al. Scientific Reports, 11(11891), 2021.
[6] O. Meinander et al. Scientific Reports, 13(21379), 2023.
[7] K. Muinonen et al. Journal of Quantitative Spectroscopy & Radiative Transfer, 55(5), 1996.
[8] K. Muinonen et al. Journal of Quantitative Spectroscopy & Radiative Transfer, 110:1628–1639, 2009.
[9] H. Lindqvist et al. Journal of Quantitative Spectroscopy & Radiative Transfer, 217:329–337, 2018.
[10] T. Väisänen et al. Journal of Quantitative Spectroscopy & Radiative Transfer, 241, 2020.

How to cite: Kostamo, I., Salminen, J., Kaakinen, A., Meinander, O., Penttilä, A., and Muinonen, K.: Giant Particles and Magnetic Minerals in Atmospheric Dust, Europlanet Science Congress 2024, Berlin, Germany, 8–13 Sep 2024, EPSC2024-813, https://doi.org/10.5194/epsc2024-813, 2024.

P40
|
EPSC2024-832
|
ECP
|
On-site presentation
Nathan Le Guennic, Panyotis Lavvas, Tommi Koskinen, Devin Hoover, and Pascal Rannou

The opaque haze layers of Titan directly influence the global temperature and photochemistry, and chemical reactions might also be driven by heterogeneous processes involving haze particles [Lavvas et al., 2008, 2011]. Moreover, haze is an essential component for understanding cloud formation and the following meteorological and chemical cycles [McKay et al., 2001, Barth and Toon, 2003, Luz et al., 2003, Lebonnois et al., 2012, Larsonet al., 2014].

Haze extinction can be derived from different Cassini measurements such as stellar occultation realised by VIMS and UVIS instruments onboard the Cassini spacecraft [Bellucci et al., 2009, Koskinen et al., 2011] or by direct observation by CIRS [Vinatier et al., 2010] and ISS [Seignovert et al., 2021], and they provide a good insight on haze distribution. Extinction, however, depends on both the density and size of aerosol particles, and determining these two quantities remains a challenge, particularly for validating microphysics models. Retrieved density profiles based on extinction have to assume a fixed size for particles [Bellucci et al., 2009, Vinatier et al., 2010] with values based on Huygens/DISR observations from Tomasko et al., 2008, so this assumption is valid for a narrow range of altitude and location. In parallel, determining density and size distributions can be achieved through numerical simulations including several physical processes (aerosol growth within a microphysics model, ion coupling) but they rely on multiple assumptions regarding thermal structure, dynamics, and chemistry [Lavvas et al., 2011, 2013].

We present a retrieval analysis from UVIS data aiming to retrieve both size and density by fitting a forward model on the data from multiple observation angles. This analysis accounts for forward-scattering effect induced by the aggregate structure of haze particles [West, 1991]. We use data from the UVIS FUV channel where haze scattering is evident at wavelengths longer than about 1600 Å. The observation covers several fly-bys of the moon among the entire spacecraft's lifetime between 2005 and 2017. UVIS spatial resolution allows the analysis to be performed on different parts of the atmosphere and above different surface locations. In order to maximize the signal-to-noise ratio, all observed spectra for each fly-by dataset are averaged in bins of altitude, latitude and longitude.

For a given line of sight geometry, the output UV emission is computed based on the processes happening at each segment of the line of sight: the scattering from the aerosols, the airglow emission, and the Rayleigh scattering by the gas, modulated by the gas and haze extinction. Therefore, simulated emission depends on the mixing ratios of gaseous absorbers given as input, and the profiles of haze density and mean radius that are introduced as two free parameters. Inversion is performed using the maximum a priori approach [Rodgers, 2000] performed on several Cassini observations simultaneously to exploit a large phase angle coverage.

Preliminary results reveal the altitude profiles of Titan's haze density and particle size derived from direct measurements of scattered light. We present the haze properties and distribution for different locations above Titan and for different years of observations. We also discuss interesting spatial variability with respect to latitude, and differences between the day and night sides.

References

E. L. Barth and O. B. Toon. "Microphysical modeling of ethane ice clouds in titan’s atmosphere." Icarus, 162(1):94–113, 2003.

A. Bellucci et al. "Titan solar occultation observed by cassini/vims: Gas absorption and constraints on aerosol composition." Icarus, 201(1):198–216, 2009.

T. Koskinen et al. "The mesosphere and lower thermosphere of titan revealed by cassini/uvis stellar occultations." Icarus, 216(2):507–534, 2011.

E. J. Larson, O. B. Toon, and A. J. Friedson. "Simulating titan’s aerosols in a three dimensional general circulation model." Icarus, 243:400–419, 2014.

P. Lavvas, A. Coustenis, and I. Vardavas. "Coupling photochemistry with haze formation in titan’s atmosphere, part ii: Results and validation with cassini/huygens data." Planetary and Space Science, 56(1):67–99, 2008. ISSN 0032-0633. Surfaces and Atmospheres of the Outer Planets, their Satellites and Ring Systems: Part III.

P. Lavvas, M. Sander, M. Kraft, and H. Imanaka. "Surface chemistry and particle shape: Processes for the evolution of aerosols in titan’s atmosphere." The Astrophysical Journal, 728(2):80, jan 2011.

P. Lavvas et al. "Aerosol growth in titan’s ionosphere." Proceedings of the National
Academy of Sciences, 110(8):2729–2734, 2013

S. Lebonnois, J. Burgalat, P. Rannou, and B. Charnay. "Titan global climate model: A new 3-dimensional version of the ipsl titan GCM." Icarus, 218(1):707–722, 2012.

D. Luz et al. "Latitudinal transport by barotropic waves in titan’s stratosphere: II. results from a coupled dynamics–microphysics–photochemistry gcm." Icarus, 166(2):343–358, 2003.

C. McKay et al. "Physical properties of the organic aerosols and clouds on titan." Planetary and Space Science, 49(1):79–99, 2001.

C. D. Rodgers. Inverse Methods for Atmospheric Sounding. WORLD SCIENTIFIC, 2000.

B. Seignovert et al. "Haze seasonal variations of titan’s upper atmosphere during the cassini mission." The Astrophysical Journal, 907(1):36, jan 2021.

M. Tomasko, L. Doose, S. Engel, L. Dafoe, R. West, M. Lemmon, E. Karkoschka, and C. See. "A model of titan’s aerosols based on measurements made inside the atmosphere." Planetary and Space Science, 56(5):669–707,2008. Titan as seen from Huygens - Part 2.

S. Vinatier et al. "Analysis of cassini/cirs limb spectra of titan acquired during the nominal mission ii: Aerosol extinction profiles in the 600-1420cm-1 spectral range." Icarus, 210(2):852–866, 2010.

R. A. West. "Optical properties of aggregate particles whose outer diameter is comparable to the wavelength." Applied Optics, 30(36):5316–5324, Dec 1991.

How to cite: Le Guennic, N., Lavvas, P., Koskinen, T., Hoover, D., and Rannou, P.: Aerosol properties in the atmosphere of Titan from Cassini/UVIS observations of haze scattering, Europlanet Science Congress 2024, Berlin, Germany, 8–13 Sep 2024, EPSC2024-832, https://doi.org/10.5194/epsc2024-832, 2024.

P41
|
EPSC2024-294
|
ECP
|
On-site presentation
Rodrigo Zamudio Ramírez, José de la Rosa, Jorge Cruz, Benjamín Leal, and Paola Molina

Introduction

Titan, with a radius of 2,575 km is the second largest satellite of the Solar System, and the largest satellite of Saturn. Titan is the most Earth-like body in the Solar System, because has a moist climate with an active weather cycle (involving methane and perhaps ethane), a stable surface liquids, and a thick atmosphere [1] mainly composed of nitrogen and methane, in which they are carried various physical and chemical processes due to the energy sources that act on it, therefore its study will help us understand organic chemistry of planetary atmospheres [2,3].

The photochemistry in Titan’s atmosphere begins with the dissociation and ionization of the main atmospheric components by external energy sources such as Solar UV, Saturn's magnetosphere, solar wind and galactic cosmic rays. The identity and characteristics of this energy sources is important because, among other things, this determines the influences in the chemistry of the entire atmosphere and the surface of the satellite [2,3].

Based on this, in this work we experimentally study the possible effect that the incidence of cosmic rays would have on the chemistry of Titan's atmosphere. To emulated this process, Titan's simulated atmosphere was subjected to different doses of gamma radiation. Preliminary results show that gamma radiation forms saturated, linear and branched hydrocarbons (ethane, propane, butane and isobutane, etc); however, the presence of nitriles and aerosols has not been identified.


Materials and methods

The simulated atmosphere of Titan (10% methane in nitrogen) is prepared using a gas mixer (Linde FM-4660). The two gases used are from the Linde brand and with a high degree of purity; for nitrogen, the purity was 99.998%, while that of methane was 99.97%. Subsequently, the gas mixture is introduced into a Pyrex glass reactor with a capacity of 1 L, reaching a pressure of 1000 mbar with the help of a Schlenk line (Fig. 1).


Figure 1. Gas mixing and Schlenk line for the simulation of planetary atmospheres. Credit: [4]


To emulate the process of cosmic ray incidence, the simulated Titan’s atmosphere was subjected to different doses of gamma radiation (from a minimum dose of 12.5 kGy to a maximum dose of 300 kGy), which is generated by cobalt 60Co sources at the Irradiation Unit of the Institute of Nuclear Sciences of the UNAM (Fig. 2). For each irradiation dose, five replicates were carried out.

Figure 2. Irradiation of the simulated atmosphere of Titan.


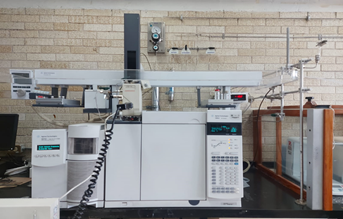
After the irradiation, the compounds generated are separated, identified and quantified using an instrumental technique, comprising a gas chromatograph (GC) (Agilent Technologies 7890A) coupled to a mass spectrometer (MS) (Agilent Technologies 5975C) (Fig. 3). Each analysis began at 50°C with a five minutes isotherm, then there was a temperature ramp of 10 °C per minute until reaching a final temperature of 240 °C, maintaining these conditions until the end of the analysis time, which was 30 minutes.

Figure 3. Coupled Gas Chromatography and Mass Spectrometry System.


Results and discussion

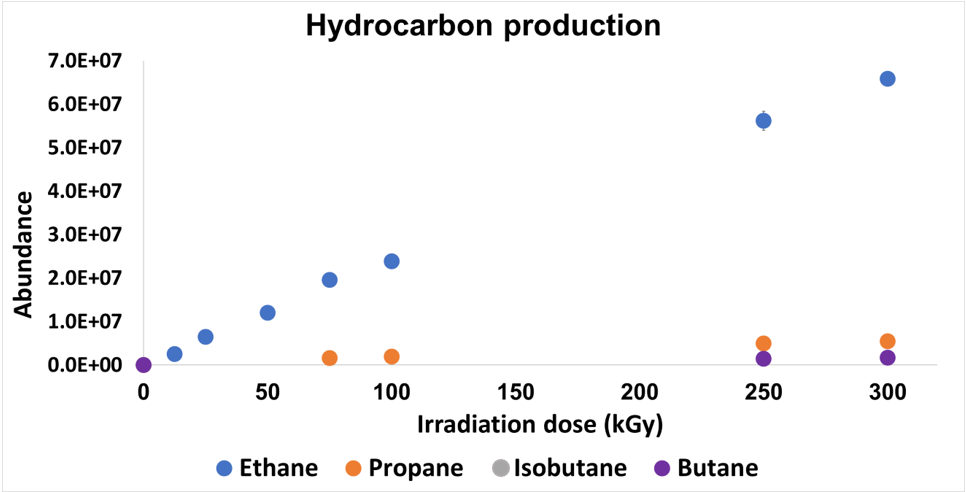
Results show that gamma radiation forms linear and branched saturated hydrocarbons have been identified (ethane, propane, isobutane and butane) (Fig. 4 & Table 1), without the presence of aerosols. The first hydrocarbons to appear is ethane, from the lowest dose of 12.5 kGy, then propane appears at 75 kGy and finally isobutane and butane at 100 kGy. From this irradiation dose, the four compounds are present, increasing their abundances.


 Figure 4. Chromatogram of the simulated atmosphere of Titan after irradiating at 300 kGy.


Table 1. Production of compounds by gamma radiation     


After the identification of the main hydrocarbons generated, the formation rates were determined for each compound and with the flow of cosmic ray energy received by Titan's atmosphere (9.0 x 10⁻³ erg cm-2 sec-1) [5], the formation rate of these compounds per year was preliminarily calculated due to the incidence of cosmic rays ((Fig. 5 & Table 2)).

}

Figure 5. Abundance curve of compounds generated by gamma radiation. The lack of data between irradiation doses of 100 - 250 kGy is because at the time of writing this work, those samples have not yet been analyzed.


Table 2. Preliminary production rate of compounds by gamma radiation.


 Conclusion.

Gamma radiation favors the formation of linear, saturated and branched hydrocarbons, but not unsaturated, aromatic, nitrile hydrocarbons or aerosols. In addition, the main hydrocarbon formed by this energy source is ethane, followed by propane, isobutane and finally butane.

These preliminary results are relevant to understanding the possible dynamics and chemistry that would take place in the lower part of Titan's atmosphere, since this zone is where cosmic rays would have the greatest effect.


References.

[1] Mitchell, J. L., & Lora, J. M. (2016). The Climate of Titan. Annual Review of Earth and Planetary Sciences, 44(Volume 44, 2016), 353–380. https://doi.org/10.1146/ANNUREV-EARTH-060115-012428/CITE/REFWORKS.

[2] Sagan, C., Thompson, W. R., & Khare, B. N. (1992). Titan: a laboratory for prebiological organic chemistry. Accounts of Chemical Research, 25(7), 286–292. https://doi.org/10.1021/AR00019A003.

[3] Lavvas, P., Galand, M., Yelle, R. V., Heays, A. N., Lewis, B. R., Lewis, G. R., & Coates, A. (2011). Energy deposition and primary chemical products in Titan’s upper atmosphere. Icarus, 213(1), 233-251.

[4] de la Rosa, J. G. (2001). Estudio de irradiaciones tipo relámpago en una atmósfera simulada de Titán. [Tesis de Maestría, Universidad Nacional Autónoma de México].

[5] Sagan, C., & Thompson, W. R. (1984). Production and condensation of organic gases in the atmosphere of Titan. Icarus, 59(2), 133-161.

How to cite: Zamudio Ramírez, R., de la Rosa, J., Cruz, J., Leal, B., and Molina, P.: Study of the incidence of gamma radiation on a simulated atmosphere of Titan: An experimental approach, Europlanet Science Congress 2024, Berlin, Germany, 8–13 Sep 2024, EPSC2024-294, https://doi.org/10.5194/epsc2024-294, 2024.

Exoplanets
P43
|
EPSC2024-168
|
ECP
|
On-site presentation
Maureen Cohen, Paul Palmer, Massimo Bollasina, Adiv Paradise, and Paola Tiranti

Transmission spectroscopy is a leading method for characterising the atmospheric composition of exoplanets, but clouds and hazes in an observing target’s atmosphere frequently lead to muted or featureless spectra. Clouds and hazes also reciprocally interact with chemical species in the atmosphere and both affect and are affected by the planet’s climate, making modelling cloudy and hazy atmospheres extremely challenging. The complexity, sensitivity, and interdependence of these factors create a prohibitively large parameter space for exoplanet atmosphere modelling.

To meet this challenge, we present ExoPlaSim, an intermediate complexity 3-D climate model with radiatively active haze transport. ExoPlaSim is a fast, flexible, and portable model with a Python API that can ingest laboratory data on optical properties of hazes to simulate a range of hazy exoplanet atmospheres. We simulate a parameter space consisting of one Earth-sized and one super Earth-sized tidally locked terrestrial planet, using stellar spectra approximating TRAPPIST-1 and Wolf 1061, and testing 32 rotation periods for each planet ranging from 6 hours to 30 days. We used optical data published by He et al. 2024 [1] for laboratory-generated organic photochemical haze.

In agreement with past studies, we find that the simulated atmospheres fall into three main circulation regimes: banded for fast rotators, double jet for intermediate rotators, and single jet for slow rotators. The banded regime features two prograde mid-latitude jets and one retrograde equatorial jet and resembles Earth’s general circulation. The double jet regime develops two superrotating prograde mid-latitude jets and associated baroclinic Rossby waves, while the single jet regime has one superrotating equatorial jet and large nightside Rossby gyres. There is an additional transitional circulation regime between the banded and double jet regimes. Each circulation regime is associated with a distinct haze distribution which is non-uniform at the terminator region.

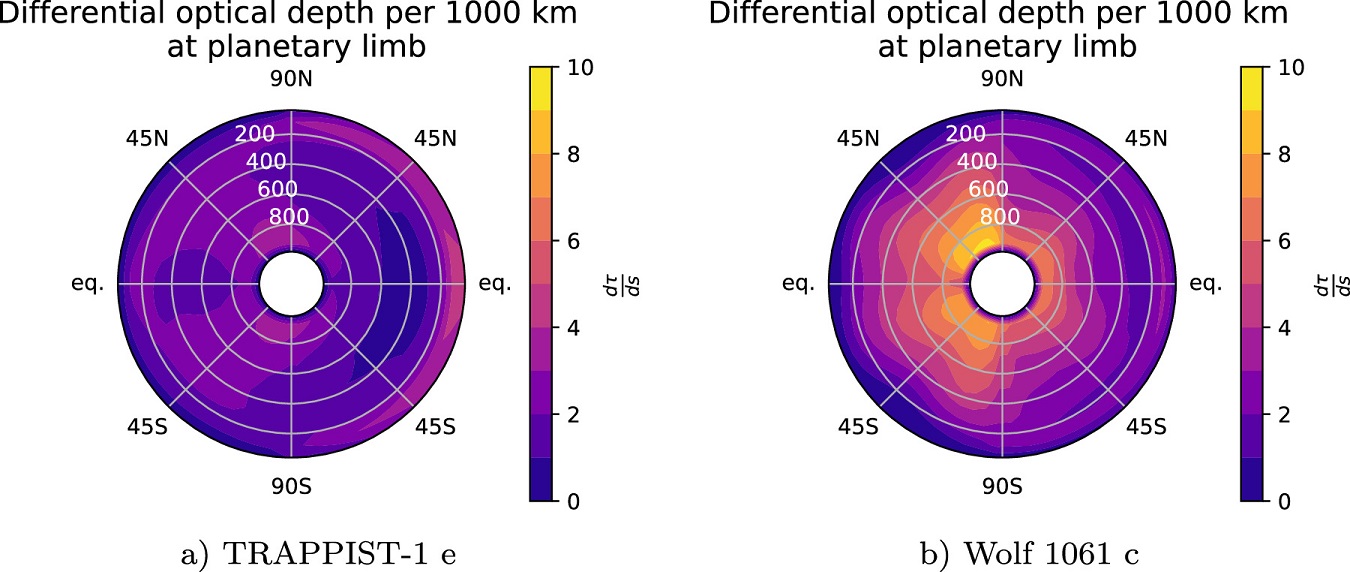
Figure 1 shows the haze optical depth at the planetary terminator when viewed from the host star. The super-Earth simulated (Wolf 1061 c) has a hazier terminator than the Earth-sized planet (TRAPPIST-1 e) due to build-up of haze particles in the “eyewall” of the nightside Rossby gyres. Both simulated planets show significant terminator asymmetry.

Figure 1: Optical depth at the planetary limb for two different planets with rotation periods of 18 days.

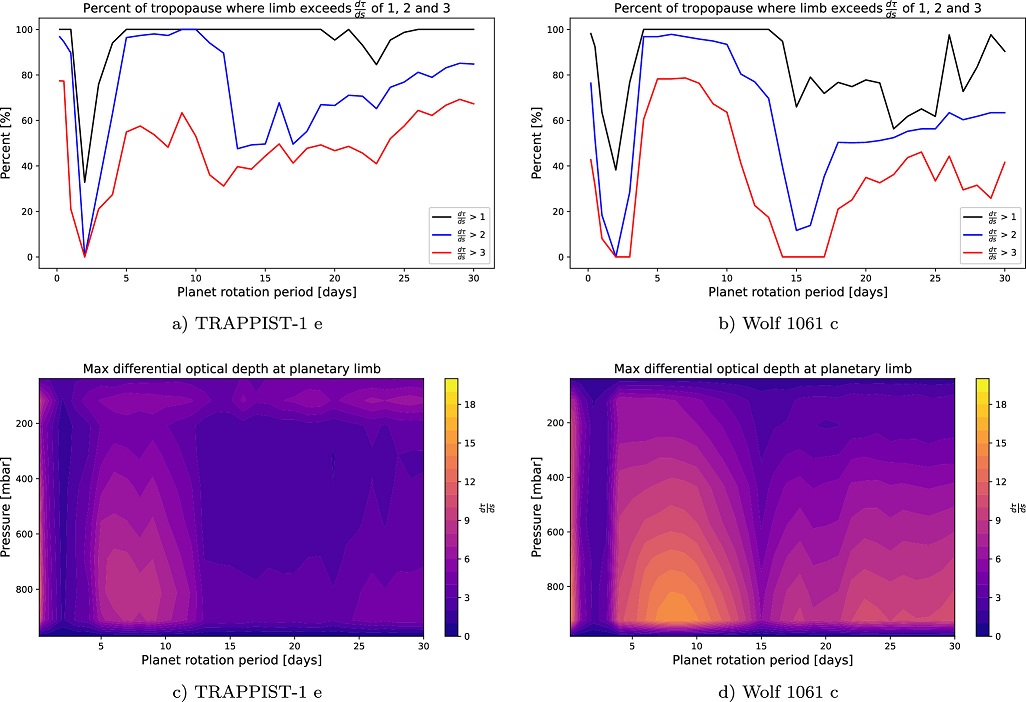
Figures 2 and 3 shows the full parameter space of rotation periods for both planets. Fast rotators developed uniformly hazy atmospheres, while the transitional space between 1-day and 3-day rotation periods resulted in very low haze amounts. Planets in the double jet regime developed hazier terminators because the gyres associated with the baroclinic Rossby waves, which tend to form on the terminator, collect haze particles and increase the terminator optical depth. Planets in the single jet regime had less hazy terminators because the gyres remained fully confined to the nightside. 

Figure 2: Haze mass at the planetary limb as a function of rotation period, adjusted for planet size.

Figure 3: Optical depth at the planetary limb as a function of rotation period

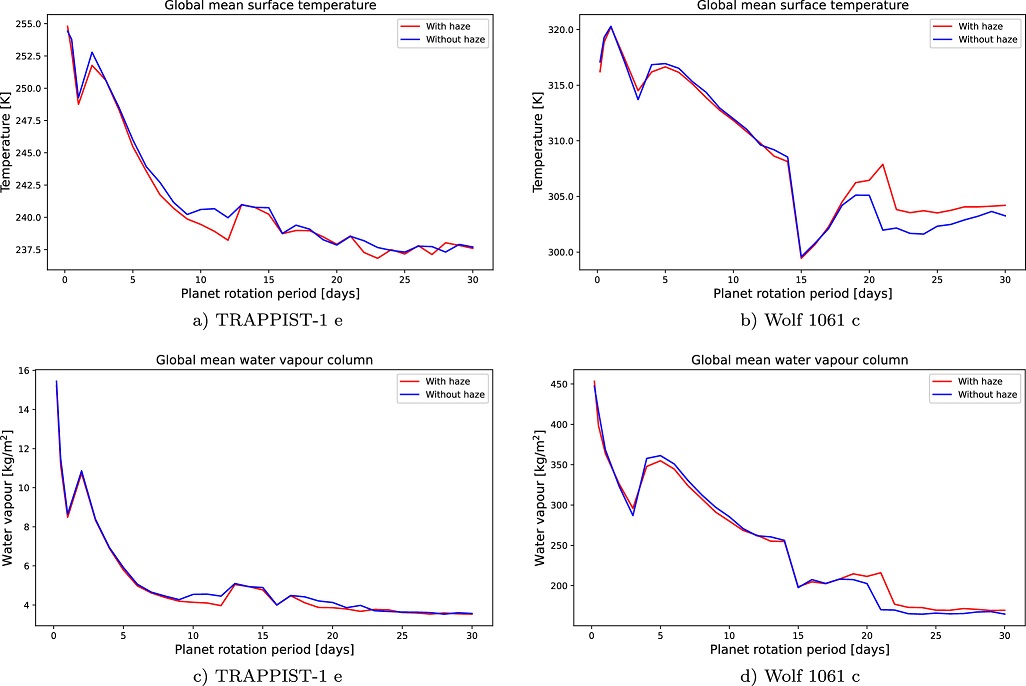
Figure 4 shows the impact of the haze particles on the global mean surface temperature and global mean water vapour column for each simulation through comparison with identical simulations performed without haze. In our study, the hazes had very little impact on the planetary climate because they are primarily scattering, with low absorption. However, preliminary simulations with a different set of haze optical data show that this finding is very much not generalisable: different types of haze can have a profound impact on the climate and general circulation.

Figure 4: Global mean surface temperature and global mean water vapour column as a function of rotation period, for simulations with and without haze.

Our work shows that hazy exoplanet atmospheres likely do not have uniform haze distribution at the terminator. Data analysis methods such as transmission strings may be able to distinguish exoplanet circulation patterns based on these non-uniform aerosol distributions. In addition, we provide a tool for first-order testing of the sensitivity of exoplanet climates to different types of hazes.

References:

[1] He, C., Radke, M., Moran, S.E. et al. Optical properties of organic haze analogues in water-rich exoplanet atmospheres observable with JWST. Nat Astron 8, 182–192 (2024). https://doi.org/10.1038/s41550-023-02140-4

How to cite: Cohen, M., Palmer, P., Bollasina, M., Paradise, A., and Tiranti, P.: Haze Optical Depth in Exoplanet Atmospheres Varies with Rotation Rate: Implications for Observations, Europlanet Science Congress 2024, Berlin, Germany, 8–13 Sep 2024, EPSC2024-168, https://doi.org/10.5194/epsc2024-168, 2024.

P44
|
EPSC2024-642
|
ECP
|
On-site presentation
YunMa: Advancing Atmospheric Cloud and Haze Analysis in the Next-Generation Exoplanet Data Era 
(withdrawn after no-show)
Sushuang Ma, Yuichi Ito, Ahmed Faris Al-Refaie, Quentin Changeat, Billy Edwards, and Giovanna Tinetti
P45
|
EPSC2024-513
|
ECP
|
On-site presentation
Thomas Drant, Ella Sciamma-O'Brien, Zoé Perrin, Ludovic Vettier, Louis Maratrat, Enrique Garcia-Caurel, Diane Wooden, Lora Jovanovic, and Claire Ricketts

Introduction

Photochemical hazes are solid particles produced in the upper layers of planetary atmospheres. They are observed in Solar System objects (Titan, Pluto, Triton, Gas Giant planets) as well as in exoplanet atmospheres. After their formation, these small spherical particles agglomerate forming fractal aerosols which later sediment at the surface. They strongly impact observations of planetary atmospheres and surfaces, their intrinsic optical properties are essential data used to interpret observations as well as predict their influence on the climate.

The composition of these photochemical aerosols is unknown, it however dictates the intrinsic optical properties, also known as refractive indices or optical constants, which are the main data needed to compute their overall radiative effect in different types of models. Laboratory setups were developed since the 1980s to produce analogs of these aerorols and directly measure their refractive indices [1,2,3,4].

Aim

In the era of the James Webb Space Telescope (JWST) and in preparation of future missions dedicated to atmospheres of exoplanets (ARIEL) and Solar System objects (e.g. Dragonfly), refractive indices of laboratory haze analogs are needed for a variety of gas compositions, in a broad spectral range. Previous data were usually limited to a narrow spectral range making their use in climate calculations difficult. Previous work also revealed that the various experimental conditions changing from one setup to another affect the composition of haze analogs and thus their refractive indices [5].

In this work, we aim to improve our understanding on the link between gas composition and refractive indices along with the influence of the experimental setup. As part of a new collaboration between LATMOS (France) and NASA Ames (US), we produced analog samples from similar gas compositions but using different setups. We produced analogs from gas compositions mimicking the atmosphere of Titan (N2-CH4) and Pluto (N2-CH4-CO) along with N-poor atmospheres relevant for Solar System gas giants and exoplanet atmospheres. Using these different gas compositions and both experimental setups, we aim to better understand the influence of nitrogen and carbon monoxide in the optical properties of these solid organic materials.

Methods

We use different measurements to retrieve the refractive indices in a broad spectral ranging from UV to far-IR. We use reflection ellipsometry along with transmission and reflection spectroscopy to derive the refractive indices from UV to near-IR. Fourier-Transform (FT) transmission spectroscopy measurements were performed at Synchrotron Soleil (France) to derive the refractive indices from near-IR to far-IR (up to 200 microns). Different models were developed and validated to assess the accuracy of the retrieved refractive indices.

Results

For an analog produced with similar gas composition but with different setups, we found significant variations in the k values in the UV-visible spectral range. This suggests an important change in composition between the different samples caused by the experimental conditions (residence time of the gas, irradiation efficiency, temperature). Given that the upper layers of planetary atmospheres are heated from the absorption of stellar radiation by these photochemical hazes, the differences revealed in these k values should be considered. In the mid-IR, the signature strength of amine groups (-NH, -NH2) relative to aliphatics (-CH2, -CH3) is affected by the experimental setup and the methane concentration (relative to N2). The observations of these signatures in photochemical hazes of Solar System and exoplanetary objects might help us understand their composition and formation mechanisms.

During the presentation, we will further discuss the refractive indices of Titan, Pluto and exoplanet analogs. We will also highlight the impact of these refractive indices in radiative parameters controlling the observations and the climate of planetary bodies (e.g. absorption coefficient and single-scattering albedo). We will discuss implications for the re-analysis of the Titan VIMS observations acquired during the Cassini-Huygens mission. We will discuss implications for observations of hazy exoplanet atmospheres with JWST.

References

[1] Khare, B.N., Sagan, C., Arakawa, E.T., et al. 1984, Icarus, 60, 127-137

[2] Imanaka, H., Cruikshank, D.P., Khare, B.N., McKay, C.P. 2012, Icarus, 218, 247–261

[3] Sciamma-O’Brien, E., Dahoo, P.-R., et al. 2012, Icarus, 218, 356–363

[4] He, C., Hörst, S.M., Radke, M., Yant, M. 2022, Planetary Science Journal, 3

[5] Brassé, C., Muñoz, O., Coll, P., Raulin, F. 2015, Planetary and Space Science, 109-110, 159–174


How to cite: Drant, T., Sciamma-O'Brien, E., Perrin, Z., Vettier, L., Maratrat, L., Garcia-Caurel, E., Wooden, D., Jovanovic, L., and Ricketts, C.: Refractive indices of photochemical haze analogs relevant for Solar System and exoplanetary objects , Europlanet Science Congress 2024, Berlin, Germany, 8–13 Sep 2024, EPSC2024-513, https://doi.org/10.5194/epsc2024-513, 2024.