
 1,2,
1,2,- 1University of Belgrade, Faculty of Mathematics, Department of astronomy, Serbia (andjelka@matf.bg.ac.rs)
- 2University of Kent, School of Physics and Astronomy , United Kingdom (N.J.Mason@kent.ac.uk)
The Vera C. Rubin Observatory Legacy Survey of Space and Time (LSST) will deliver multiband time-domain photometry for an unprecedented number of sources (Ivezić et al. 2019), motivating a shift from single-feature anomaly detection toward structured biosignature searches in observable space (Gallay, Davenport & Croft 2025; Kovačević, Mason & Ćiprijanović 2025; Li et al. 2022). Correlated, coherent perturbations across the six LSST passbands (320–1100 nm) can encode surface reflectance, haze, and biologically motivated spectral features. Building on the coherence framework of Kovačević, Mason et al. (2026) and aerial-biosphere scenarios in sub-Neptune atmospheres (Seager et al. 2021), we test whether a Vegetation Red Edge (VRE) signature produces a statistically detectable, directionally coherent displacement in the LSST multiband colour vector, separable from astrophysical noise without spectroscopy.
We simulated a 649-spectrum grid spanning pressure, H₂/He composition, CH₄, and haze in a GJ 1214b-like sub-Neptune template (PSG; Villanueva et al. 2022). A VRE sigmoid proxy was injected at λ₀ = 0.705 µm with f_VRE = 0.00, 0.10, 0.30 and widths w = 0.02, 0.05 µm, then convolved through Rubin/LSST throughput curves to produce synthetic AB magnitudes. Figure 1 shows the differential flux ΔFVRE for a representative model (0.1 bar, 95.5% H₂/He, methane-poor, haze-free): a sigmoid rise from zero shortward of the VRE edge projecting into correlated broadband colour shifts across the r and i passbands.
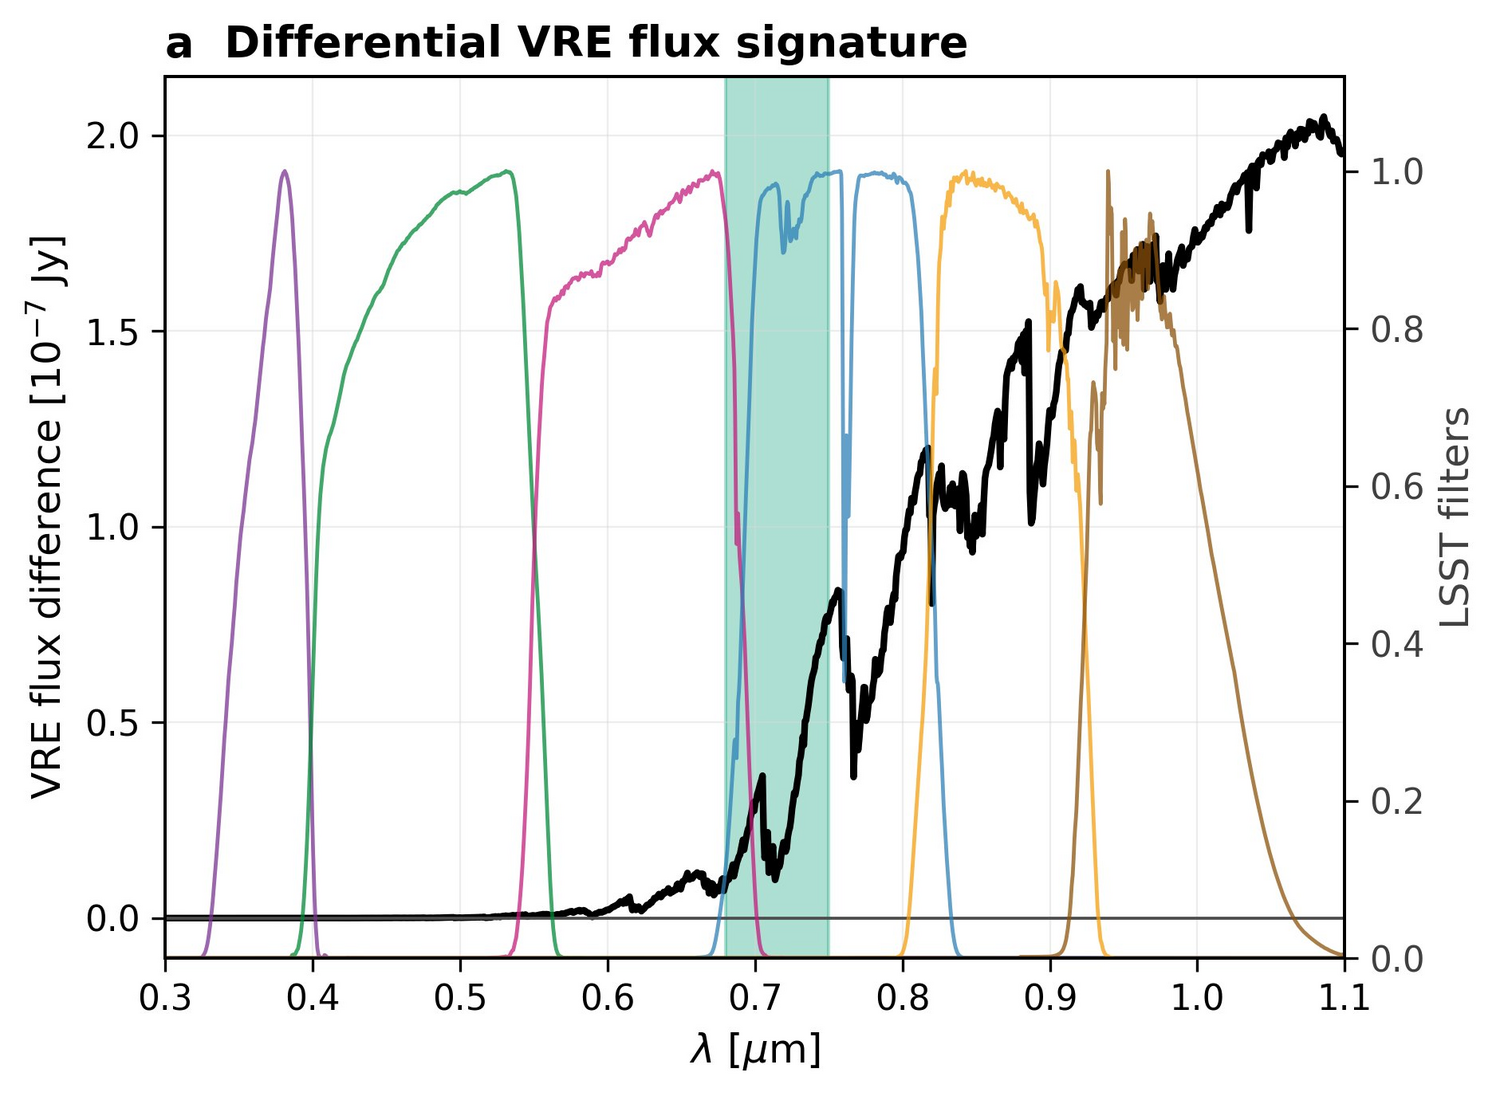
Figure 1 . Differential VRE flux signature through LSST filters. The black curve shows ΔFVRE for a representative PSG model (0.1 bar, 95.5% H₂/He, methane-poor, haze-free). The shaded green region marks the VRE edge (0.68–0.75 µm), straddling the r and i filters. The perturbation projects into correlated colour shifts across multiple LSST bands — a broadband coherent displacement, not an isolated narrow feature.
After penalising haze and methane nuisance directions using a generalised Rayleigh quotient, the learned VRE coherence score is SVRE = Δ(r−i) + 0.661 Δ(i−z), with propagated noise floor σVRE = 0.024 mag. The weights W₁ = 1.0 and W₂ = 0.661 maximise VRE sensitivity while penalising the CH₄ and haze response directions. Figure 2 shows the differential colour heatmaps conditioned on VRE fraction (fVRE) for all 649 spectra. At fvre = 0.00 the entire population collapses to the origin. At fVRE = 0.10 the cloud shifts coherently to Δ ≈ 0.004 mag, and at fVRE = 0.30 it migrates further to Δ ≈ 0.010 mag. The population migrates as a compact directional cloud rather than diffusing, confirming that the VRE perturbation produces a reproducible colour displacement consistent across all atmospheric nuisance parameter combinations.
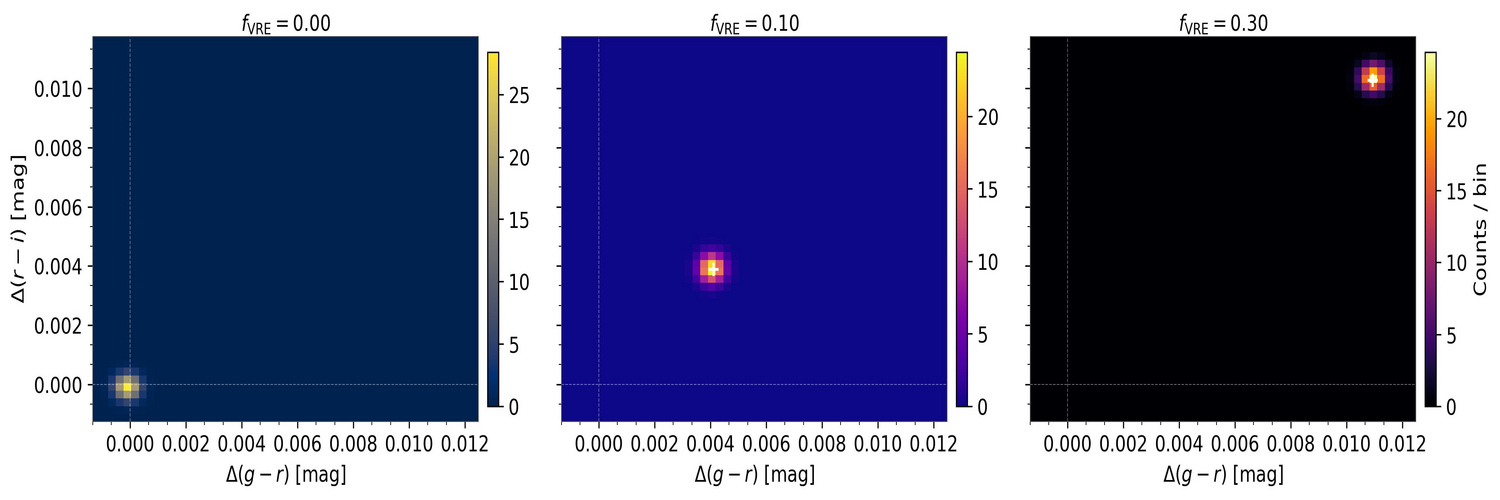
Figure 2. Differential colour space conditioned on VRE fraction. Density histograms for all 649 PSG spectra at fVRE = 0.00 (left), 0.10 (centre), and 0.30 (right). The population migrates coherently as a compact directed cloud with increasing VRE coverage.
Figure 3 shows the SNRVRE distribution (left) and nuisance analysis (right) for fVRE = 0.00, 0.10, and 0.30, yielding SNR ≈ 0.00, 0.25, and 0.63 respectively — all sub-threshold (SNR < 1) at single-epoch LSST precision. The empirical coherence threshold τ = 0.3 marks where the VRE projection begins separating systematically from baseline and nuisance directions in differential colour space. The right panel's three flat horizontal bands confirm that the penalised score successfully projects out the methane nuisance direction across four decades of CH₄ abundance. The signal is thus sub-threshold but non-zero, coherent, and growing monotonically with fVRE — the ideal regime for considerening survey-scale stacking (Figure 4).
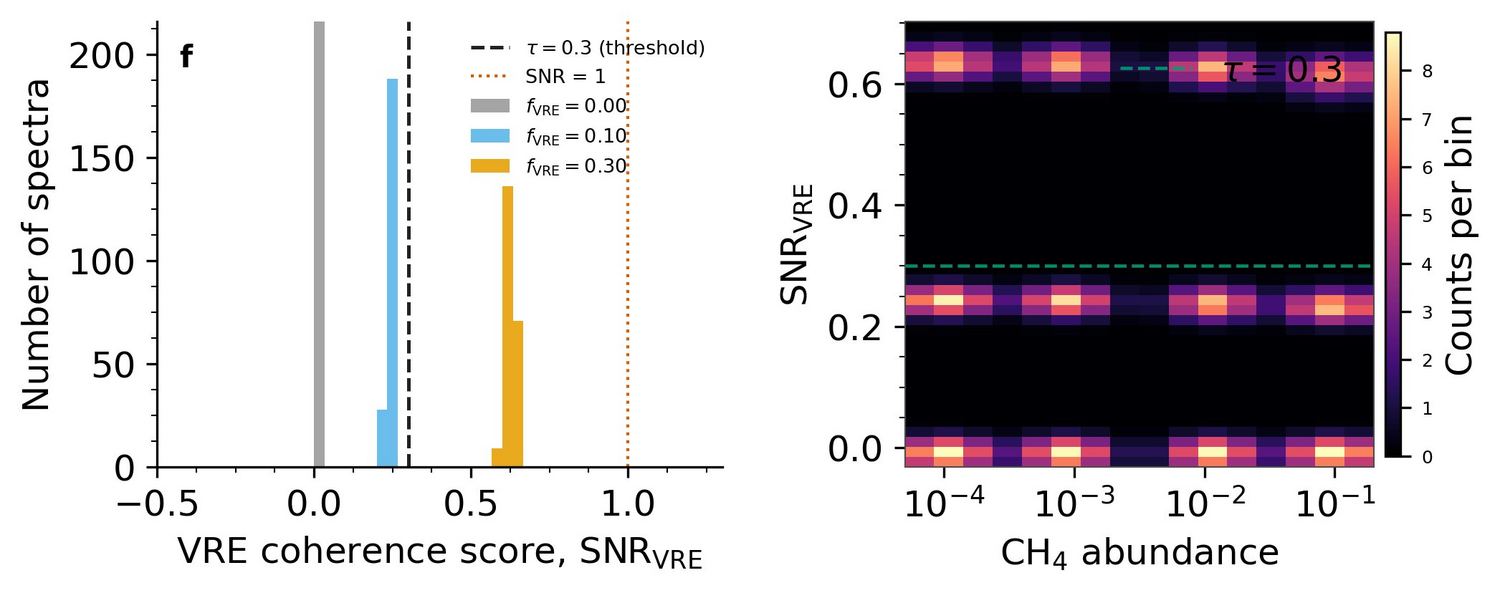
Figure 3. VRE coherence score distribution and CH₄ nuisance analysis. Left: stacked histogram of SNRVRE by VRE fraction. Three peaks at SNR ≈ 0.00, 0.25, 0.63 confirm the signal is sub-threshold at single epoch. Dashed line: τ = 0.3 . Right: log₁₀(CH₄) versus SNRVRE density. Flat horizontal bands across four CH₄ orders of magnitudes confirm the penalised score projects out the methane nuisance direction.
Figure 4 presents the stacking feasibility forecast. Following Pont et al. (2006), stacked significance follows S(N, f_sys) = √N · D₀ / √(1 + N · f²_sys), where N is independent LSST targets or epochs, D₀ the median single-object VRE coherence score, and f_sys the fractional systematic floor. For f_sys = 0, significance grows as √N, reaching 3σ at N ≈ 53 and 5σ at N ≈ 148. Systematics saturate the ceiling at S_max = D₀/f_sys: moderate f_sys = 0.10 caps significance near 3σ, while f_sys = 0.20 prevents 3σ detection entirely. Achieving 5σ requires f_sys < D₀/5, imposing a sub-millimagnitude calibration requirement on r−i and i−z bands. Since the VRE signal is sub-threshold but coherent and nuisance-free, population-scale stacking over N = 53–148 targets is the natural path to a significant biosignature detection.
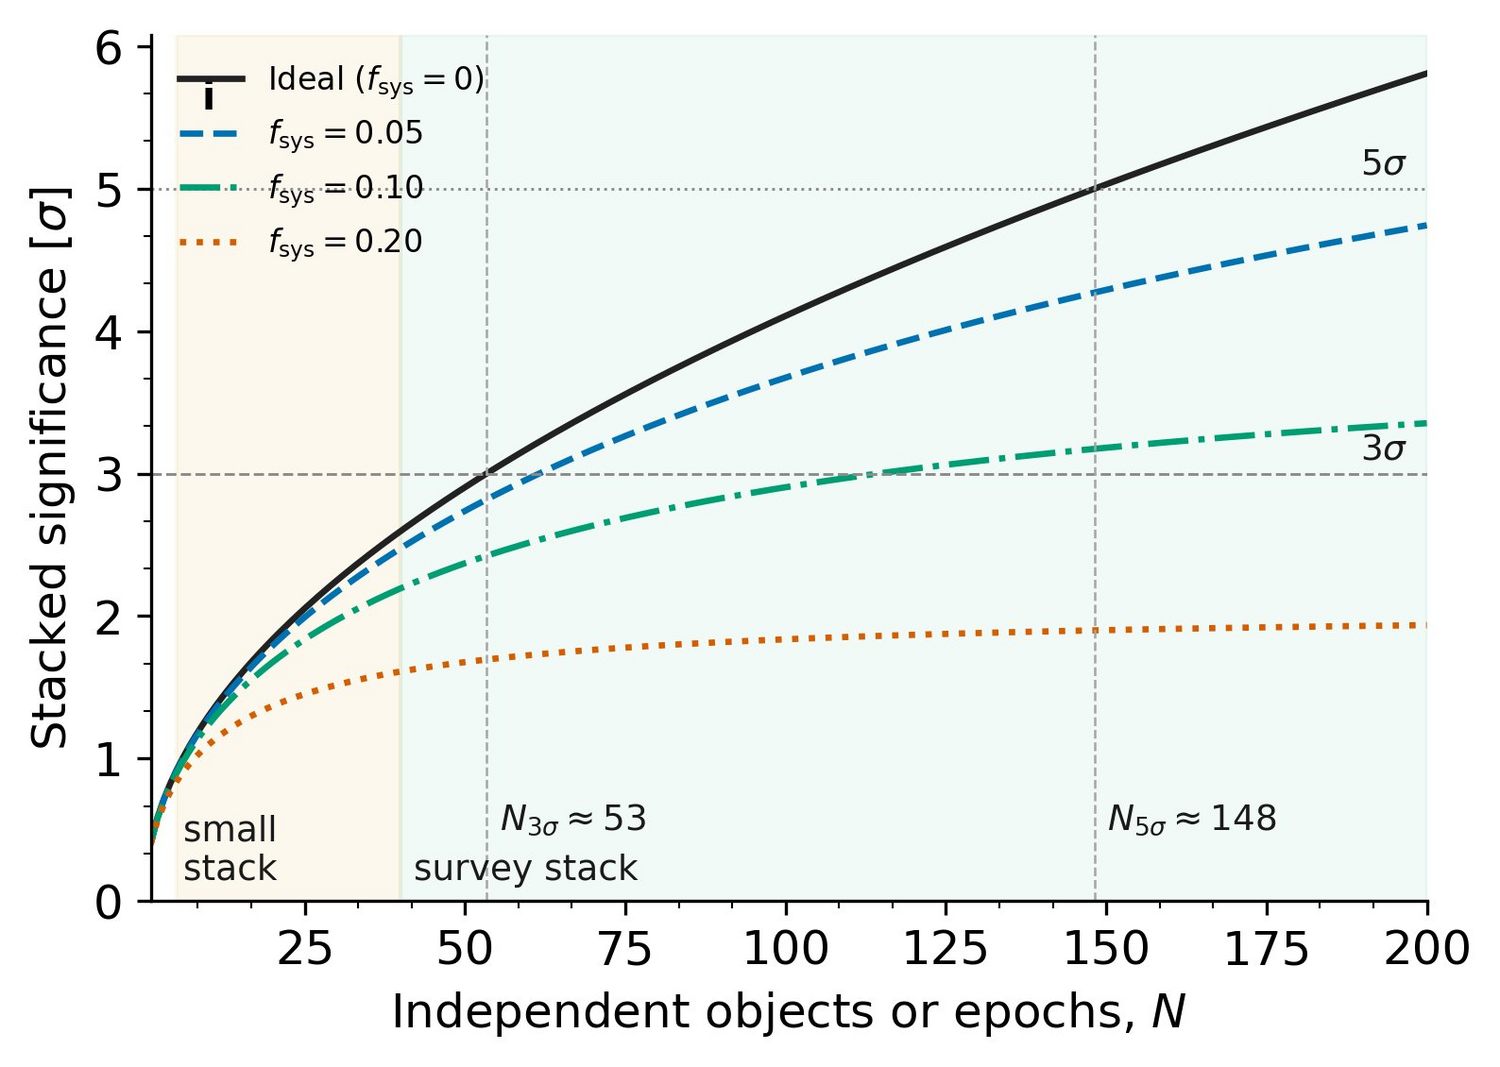
Figure 4. Stacking feasibility forecast for LSST. Stacked significance versus N independent objects or epochs for f_sys = 0.00, 0.05, 0.10, 0.20. Ideal case reaches 3σ at N ≈ 53 and 5σ at N ≈ 148. f_sys = 0.10 saturates near 3σ; f_sys = 0.20 capped below 2σ. Shaded: small-stack (N = 5–40) and survey-stack (N = 40–200) regimes.
Outlook
We demonstrate that VRE-like biosignature perturbations produce statistically coherent displacements in Rubin/LSST broadband colour space, separable from CH₄ and haze nuisance directions through penalised coherence scoring. The signal is sub-threshold at single-epoch precision but accumulates to statistical significance through survey-scale stacking. Future work will extend the framework to realistic LSST cadences, a wider range of host star types, extinction corrections, and machine learning classifiers trained on the full Δ-colour manifold.
References
- Gallay E. M., Davenport J. R. A., Croft S., 2025, AJ, 170, 95.
- Ivezić Ž., et al. 2019, ApJ, 873, 111.
- Kovačević A., Mason N. J., Ćiprijanović A., 2025, Frontiers in Astronomy and Space Sciences, 12, 1594485.
- Kovačević A., Mason N. J., Ćiprijanović A., Long B., et al., 2026, Proc. IAU Symposium No. 404, submitted.
- Li X., Ragosta F., Clarkson W. I., Bianco F. B., 2022, ApJSS, 258, 2.
- Pont, F., Zucker, S., Queloz, D., 2006,MNRAS, 373(1), 231.
- Seager S., Petkowski J. J., Gao P., et al., 2021, Universe, 7, 172.
- Villanueva G. L., et al. 2022, Fundamentals of the Planetary Spectrum Generator.
How to cite: Kovacevic, A., Mason, N., and Moore, M.: Prototype Coherence-Based Biosignature Searches with Vera C Rubin Observatory Legacy Survey of Space and Time, Europlanet Science Congress 2026, The Hague, The Netherlands, 7–11 Sep 2026, EPSC2026-763, https://doi.org/10.5194/epsc2026-763, 2026.


