
 1,1,1,1,3
- 1Department of Physics, University of Helsinki, School of Physics, Finland (yehor.surkov@helsinki.fi)
- 2V.N. Karazin Kharkiv National University, Kharkiv, Ukraine
- 3Space Science Institute, Boulder, USA
Introduction: Thermal emission appears in lunar reflectance spectra beyond ~2500 nm, where surface-emitted radiation becomes comparable to sunlight reflection [e.g., 1,2]. This thermal component distorts diagnostic absorption bands of minerals such as pyroxenes and spinel [e.g., 3] and can obscure spectral signatures of volatiles like hydroxyl and water (OH/H₂O). Several methods have been proposed to retrieve this component [e.g., 1,4–6]. Among them, the iterative procedure proposed by Clark et al. [4] is widely used and has been implemented in the Chandrayaan-1 M³ calibration pipeline [7]. The method assumes the lunar surface behaves as a gray body, with emissivity defined as 1 – R₀(λ), where R₀(λ) is the reflected solar fraction. However, R₀(λ) is geometry-dependent and not directly observed beyond 2500 nm, requiring a complex iterative approach to assess it with approximations before separating the thermal emission from the reflectance [4].
Method: Here, we explore an alternative approach for thermal emission removal from M³ data using a single-step subtraction of the thermal component [1,2]. Like previous methods, it is based on the graybody concept. However, it avoids empirical estimations of the reflected solar fraction by treating thermal emissivity in a different way. The first step is to define the forward model. The apparent albedo, obtained by dividing the measured radiance by the incident solar flux, can be expressed as follows:
Here, α, i, and e denote the phase, incidence, and emergence angles, with i and e depending on the local surface normal. Ar+e(λ) includes both reflected and emitted components; An(λ) is the reflectance at normal geometry, and F(α, i, e, λ) is the photometric function. Constants are LSun = 1.696×10¹¹ m, RSun = 6.96×10⁸ m, and C₂ = 1.44×10⁴ µm·K. Emissivity is defined as 1 − ε·An(λ), where ε·An(λ) is the hemispherical-directional albedo. The general expression for ε is (see Eq. 6.14 in [2])
where φ is the azimuthal angle. Finally, one can invert Eq. 1 with respect to An(λ) and obtain an expression for the normal albedo:


Data: To demonstrate the method, we applied it to M3 data from the Aristarchus crater (Frame ID: M3G20090612T060502) and the Reiner Gamma swirl (Frame ID: M3G20090613T032520), as shown in Fig. 1a. Due to the iterative nature of the original thermal correction [7], we began with level-1 data and performed solar normalization, thermal correction, and photometric correction to bring the data into the RELAB photometric system (30°, 0°, 30°). Whenever possible, we used original M3 calibration inputs, including the solar spectrum, digital terrain models, geometric angles, and the photometric function [7]. To isolate the effect of thermal correction, we retained the original surface temperature maps (Fig. 1b), although alternative temperature-estimation approaches also exist [e.g., 2,5]. For simplicity, we assume emissivity as 1 − An(λ), consistent with the original approach [4]. The factor ε = 1 follows from Eq. 2 if a Lambertian-like photometric function F(α, i, e, λ) = cos(e)cos(i) is used. This approximation neglects the subpixel-scale structure of the lunar surface, which will be addressed in future work. Lastly, we did not apply the thermal-polishing step from the original pipeline [7], as this correction multiplies the spectra by a coefficient close to one and generally has a negligible effect.
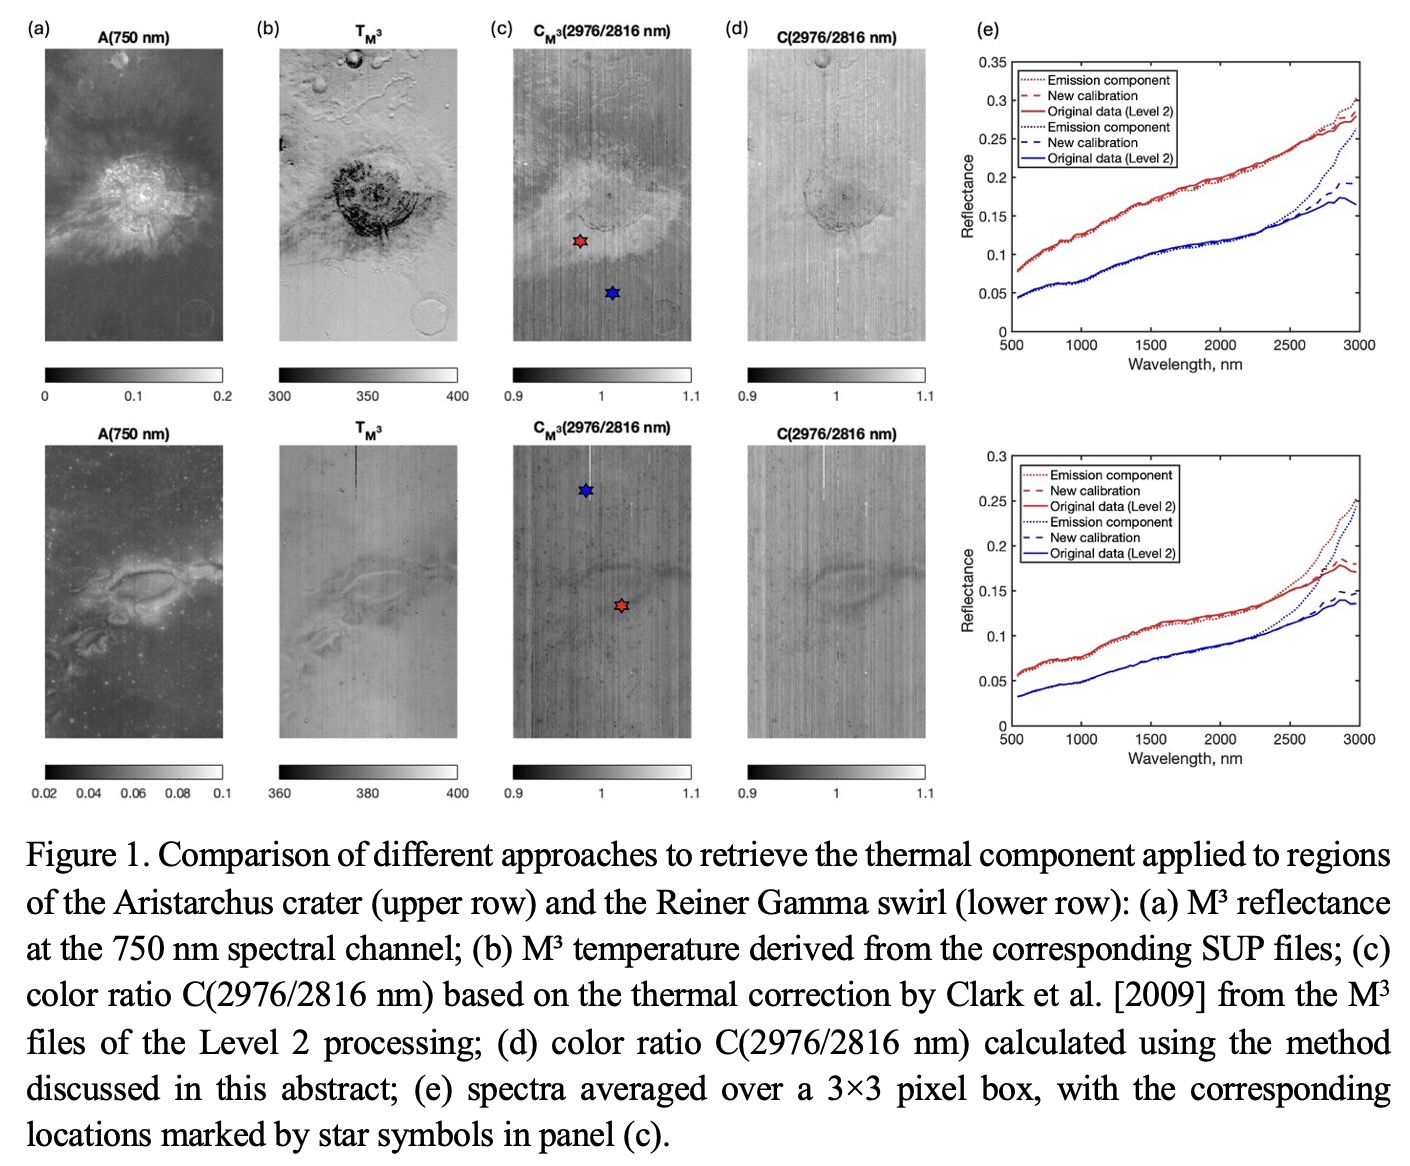
Results: Both frames were acquired at relatively small phase angles: 21.3° for the Aristarchus crater and 8° for Reiner Gamma, resulting in a notable thermal-emission component between 2700 and 2950 nm. The selected sites show significant reflectance differences, and the Aristarchus region also features strong temperature variations due to complex topography. This makes them suitable for testing the method by (1) mapping the color ratio C(2976/2816 nm) using both the original M3 reflectance data (Fig. 1c) and the proposed approach (Fig. 1d), and (2) comparing the spectra from selected locations (Fig. 1e).
As shown, the color ratio derived from the original M3 reflectance data generally correlates with albedo, except for several sites on the southern slope and the crater peak. In contrast, the ratio calculated using the proposed method appears smoother and nearly featureless. It shows similar values across bright ejecta, the moderately bright southern Aristarchus Plateau, and the darker surrounding mare basalts. The lower values observed at the crater walls, central peak, and nearby areas are more likely linked to surface immaturity than to compositional differences. Similar behavior is seen at various mare-highland boundaries across latitudes, although these cases are beyond the scope of this abstract.
Lunar swirls, high-albedo diffuse formations, are among the few features that consistently exhibit lower color-ratio values. In Fig. 1, the Reiner Gamma swirl serves as an example. Notably, the swirl’s reflectance remains significantly lower than that of the bright Aristarchus ejecta. Thus, while their higher albedo may account for slightly cooler surface temperatures, it does not fully explain the reduced color ratios. This effect may instead point to the swirls’ unique photometric or compositional properties, as suggested by previous studies [e.g., 8].
Conclusions and future work: A simplified single-step method for thermal emission removal from Chandrayaan-1 M³ data has been considered. The method avoids complex iterative calibration. Applied to the Aristarchus and Reiner Gamma regions, it produces smoother spectral color ratios that do not reveal clear correlation with the surface reflectance. Future work will refine emissivity modeling and temperature estimation using more sophisticated photometry. The method could also be applied to other hyperspectral datasets of airless Solar System bodies, such as the High-Resolution Volatiles and Minerals Moon Mapper (HVM3) onboard Lunar Trailblazer [9].
References:
[1] Y. Shkuratov, et al. PSS 59, 1326-1371 (2011). https://doi.org/10.1016/j.pss.2011.06.011
[2] Y. Shkuratov, G. Videen, V. Kaydash, Optics of the Moon. Elsevier (2025). https://doi.org/10.1016/C2018-0-03000-5
[3] Y. Surkov, et al. PSS 240, 105831 (2024). https://doi.org/10.1016/j.pss.2023.105831
[4] R. Clark, et al. JGR 116, E00G16. (2011) https://doi.org/10.1029/2010JE003751
[5] S. Li, R. Milliken. JGR Planets 121(10), 2081-2107 (2016). https://doi.org/10.1002/2016JE005035
[6] J. Banfield, et al. 47th LPSC, LPI, Houston, USA, 1594 (2016).
[7] S. Lundeen, et al (2011) http://pds-imaging.jpl.nasa.gov/data/m3/CH1M3_0004 /DOCUMENT/DPSIS.PDF.
[8] D. Domingue, et al. PSJ 5, 161 (2024). https://doi.org/10.3847/PSJ/ad2179
[9] D. Thompson, et al. 51st LPSC, LPI, Houston, USA, 2052 (2020).
How to cite: Surkov, Y., Shkuratov, Y., Penttilä, A., Muinonen, K., Björn, V., and Videen, G.: Untangling Heat: Retrieving the thermal component from Chandrayaan-1 M³ spectra, EPSC-DPS Joint Meeting 2025, Helsinki, Finland, 7–12 Sep 2025, EPSC-DPS2025-1000, https://doi.org/10.5194/epsc-dps2025-1000, 2025.