Multiple terms: term1 term2
red apples
returns results with all terms like:
Fructose levels in red and green apples
Precise match in quotes: "term1 term2"
"red apples"
returns results matching exactly like:
Anthocyanin biosynthesis in red apples
Exclude a term with -: term1 -term2
apples -red
returns results containing apples but not red:
Malic acid in green apples
hits for "" in
Network problems
Server timeout
Invalid search term
Too many requests
Empty search term
MITM8

Session assets
[1] Hapke B. (1993) Theory of Reflectance and Emittance Spectroscopy.
[2] Raponi A. et al., (2020) 14th EPSC 2020, abstract 761.
[3] De Sanctis M. C. (2002) SSR, 163, 329-369.
How to cite: Raponi, A., Ciarniello, M., Formisano, M., Filacchione, G., Capaccioni, F., De Sanctis, M. C., and Frigeri, A.: Roughness of planetary surfaces: statistical multi-facet approach combining Hapke and fractal theories, EPSC-DPS Joint Meeting 2025, Helsinki, Finland, 7–13 Sep 2025, EPSC-DPS2025-1932, https://doi.org/10.5194/epsc-dps2025-1932, 2025.
The growing availability of hyperspectral data from planetary missions ranging from CubeSats to flagship programs has led to many studies aiming to infer surface mineralogy through remote sensing techniques. The Moon Mineralogical Mapper (M³) aboard Chandrayaan-1 provides visible and near-infrared data (430–3000nm) at 140 m/pixel resolution and has been widely used to infer lunar surface composition [1]. A common strategy involves applying unmixing models, often Non-Negative Matrix Factorization (NNMF), to M³ images with varying reflectance and compositional properties, using laboratory reference spectra from the RELAB database for comparison [2,3]. These spectra from standard materials represent typical lunar minerals such as olivine, pyroxenes, plagioclase, iron-titanium oxides, and volcanic glasses.
This study first focuses on reproducing previous efforts to estimate the lunar mineralogy, applied to the Apollo 17 landing site (Figure 1). Then it shifts toward highlighting the methodological uncertainties involved in interpreting hyperspectral imagery using unmixing models in remote sensing applications.
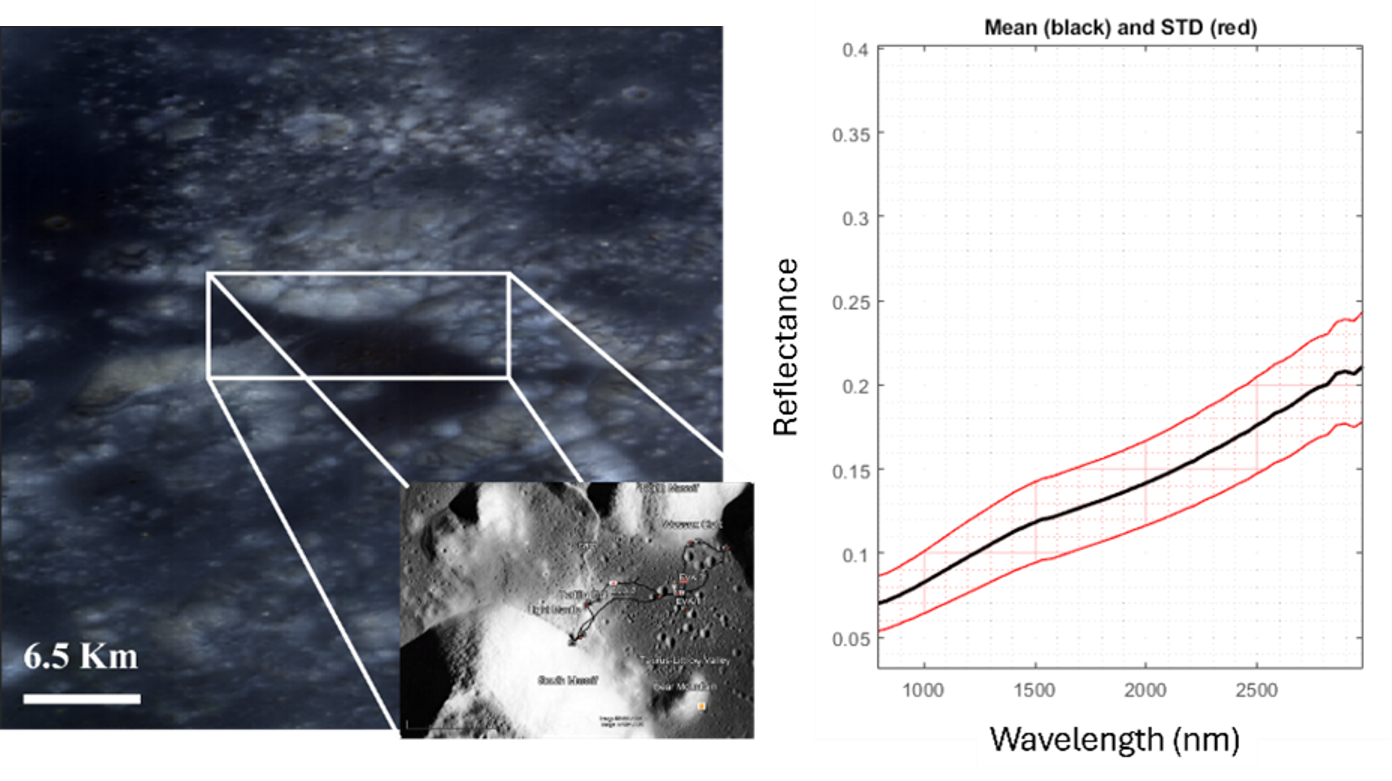
Figure. 1 (Top)Taurus-Littrow Valley. (Bottom) Mean (dark) reflectance spectrum and standard deviation (red) of the Taurus-Littrow Valley hyperspectral image.
In the initial stage, a spatial binning with 8X8 window was applied to reduce the signal-to-noise ratio of the image. Principal Component Analysis (PCA) was then used to reduce data dimensionality and highlight surface variations. Initially applied on the binned image, PCA revealed that the first component explained 98% of the variance, mainly reflecting topography and illumination differences. To minimize these effects and enhance chemical information, the first derivative of the spectral data was applied (same preprocessing was applied to reference spectra, Figure.2). A second PCA was then performed to determine the chemical rank of the matrix, which suggested that NNMF should be carried out with 3–4 principal components.
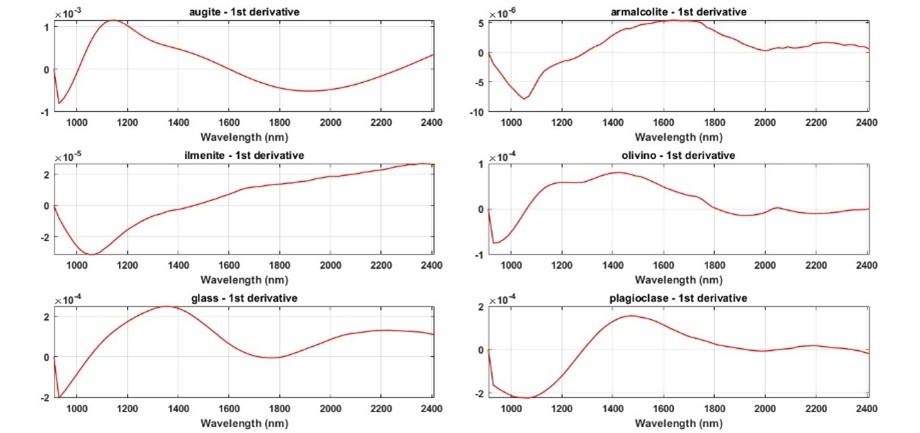
Figure. 2 First derivative of reference spectra from RELAB.
NNMF was performed to unmix and extract surface components, possibly revealing features that may correspond to geochemical variations. In this final stage, it was assumed that three principal components could be present within the image. Figure. 3 shows the spatial distribution of the combination of these three components (top), along with the corresponding “pure” spectra (bottom) extracted by the model after applying NNMF using endmember initialization and non-negativity constraints [4] applied to the contributions. Commonly, when these results were compared with preprocessed spectra from RELAB, compounds such as pyroxenes, olivine, volcanic-glass, may be identified (Figure. 3), with acceptable lack of fit and a total variance explanation exceeding 99%.
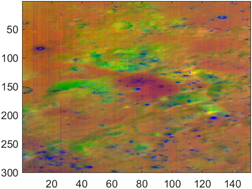
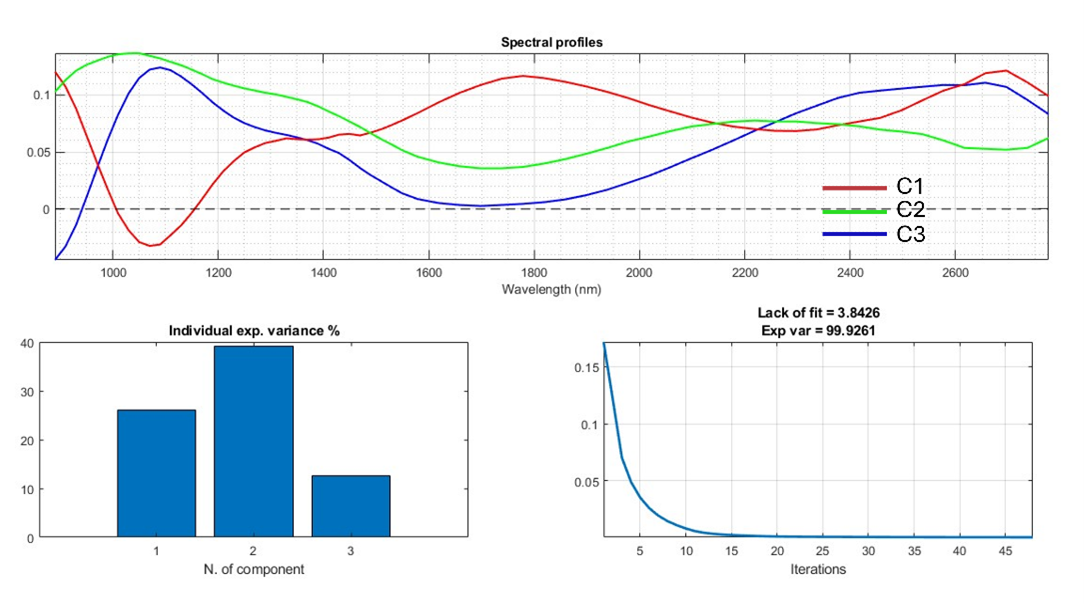
Figure. 3 False RGB showing the concentrations of the three main components after applying NNMF model using endmember initialization and non-negativity constraints.
However, while spectral unmixing models have been widely applied in remote sensing for decades, limited attention has been paid to the intrinsic ambiguities they involve. Although simpler ambiguities (such as those related to scale or sign) can often be addressed using basic constraints like non-negativity, rotational ambiguity remains a significant and underexplored source of uncertainty. For these reasons, it is important to highlight that solutions derived from NNMF (commonly referred to as Multivariate Curve Resolution with non-negativity constraints) depend considerably on the degrees of freedom allowed by the optimization algorithm (e.g., Alternating Least Squares, ALS). To visualize and quantify this issue, feasibility plots were employed through MCRbands and FACpack (Figure. 4), which map the set of all admissible solutions within the NNMF framework [5-7].
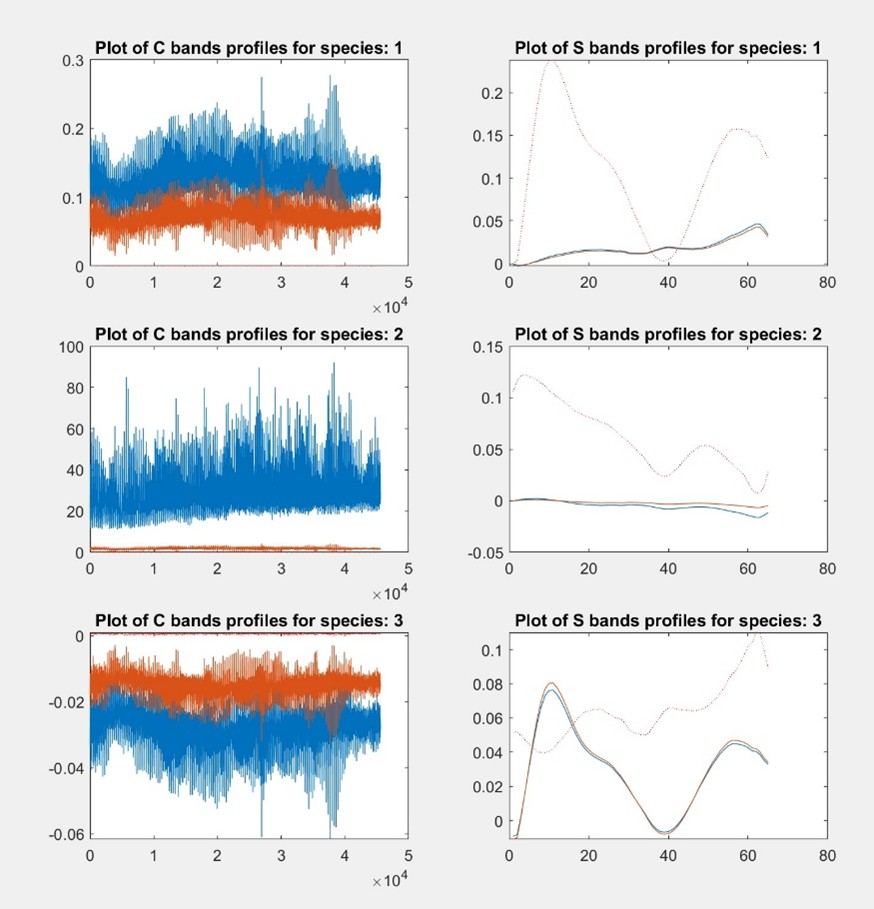
Figure. 4 Feasibility plots for the three components calculated. Right, the contributions and left, the spectral profiles obtained. Contributions: Blue and red represents the solution obtained and the plausible solution that could also be considered as optimal.
Figure 4 shows that any space covered between those solutions could be considered feasible. On the left, the spectra calculated and the feasible spectra both indicate a strong lack of specificity and uniqueness in the solutions, clearly stating that the model is not stable enough to be deemed an optimal solution. The extent of solution variability reveals that differences between the acceptable solution and real solutions for the considered species are considerable due to rotational freedom. In conclusion, we emphasize the importance of a more rigorous consideration of ambiguity in remote sensing applications. Additionally, the presence of regolith and volcanic rocks on the lunar surface makes it unlikely that a 140 m/pixel represents a pure mineral spectrum [8].
Keywords: Remote sensing, Chemometrics, Unmixing models, Near Infrared.
Acknowledgements: Work supported through the PAMMAT project: “Alteration processes in Mars and Moon Meteorites, and Terrestrial Analogues at different environments: Mars2020, Rosalind Franklin and Returned Samples from Mars and Moon” (Grant No. PID2022-142750OB-I00), funded by the Spanish Agency for Research (through the Spanish Ministry of Science and Innovation, MCIN, and the European Regional Development Fund, FEDER).
References:
[1] R. O. Green, C. Pieters, P. Mouroulis,et al. (2011). Journal of Geophysical Research: Planets, 116 (E10) (E00G19).
[2] Adams, J. B., & McCord, T. B.(1971). Optical properties of mineral separates, glass, and anorthositic fragments from Apollo mare samples. In Proceedings of the Lunar Science Conference, vol. 2, p. 2183.
[3] Reflectance Experiment Laboratory (RELAB), 2008. Brown University, Providence
[4] De Juan, A., & Tauler, R.(2006). Multivariate curve resolution (MCR) from 2000: progress in concepts and applications. Critical reviews in analytical chemistry, 36(3-4), 163-176.
[5] Jaumot, J., & Tauler, R.(2010). MCR-BANDS: A user friendly MATLAB program for the evaluation of rotation ambiguities in Multivariate Curve Resolution. Chemometrics and Intelligent Laboratory Systems, 103(2), 96-107.
[6] Jaumot, J., Gargallo, R., De Juan, A., & Tauler, R.(2005). A graphical user-friendly interface for MCR-ALS: a new tool for multivariate curve resolution in MATLAB. Chemometrics and intelligent laboratory systems, 76(1), 101-110.
[7] Sawall, M., Kubis, C., Selent, D., Börner, A., & Neymeyr, K.(2013). A fast polygon inflation algorithm to compute the area of feasible solutions for three‐component systems. I: concepts and applications. Journal of Chemometrics, 27(5), 106-116.
[8] Cavalli, R. M. (2023). Spatial validation of spectral unmixing results: A systematic review. Remote Sensing, 15(11), 2822.
How to cite: Alberquilla, F., Gorla, G., Amigo, J. M., Aramendia, J., Martínez Arkarazo, I., Vazquez de la Fuente, I., Población, I., Coloma, L., Arana, G., Castro, K., and Madariaga, J. M.: Understanding the boundaries of “Spectral Unmixing”: Considerations for reliable mineralogical interpretation in remote sensing and space missions., EPSC-DPS Joint Meeting 2025, Helsinki, Finland, 7–13 Sep 2025, EPSC-DPS2025-705, https://doi.org/10.5194/epsc-dps2025-705, 2025.
The near-Earth asteroid (3200) Phaethon displays activity when it passes its perihelion at 0.14 au from the Sun. It is also thought to be linked to the Geminid meteor shower (e.g. [1], [2]). Phaethon has been hypothesized to be connected to, for example, the main-belt asteroid (2) Pallas. The two asteroids could be remnants of a common parent body or Phaethon could be an ejected piece of Pallas. Thermal models of Phaethon show heterogeneity between its northern and southern hemispheres either in the surface grain size or porosity, or both [3]. Recently, Yamato-type (CY) carbonaceous chondrite meteorites have been connected to Phaethon and the CY meteorites are now believed to be originated from the asteroid [4]. Using CY meteorites, a light-scattering model is created for the surface of Phaethon to study its surface properties and heterogeneity.
Samples of 6 different CY meteorites are studied at the University of Helsinki Astrophysical Scattering Laboratory. The ground samples reflectance spectra is measured using an integrating sphere spectrometer and linear polarization using a polarizing goniometer. The mineralogy of the samples has been studied with XRD by King et al. [5]. The samples contain mostly olivine and iron sulphide, and small amounts of pyroxene and metals. The iron sulphide is in the form of troilite. For modeling, the samples are simplified as olivine particles with troilite inclusions. A multiparticle media is then constructed of these particles. Light-scattering simulations with SIRIS (geometric optics with diffuse scatterers framework) [6], RT-CB (radiative transfer and coherent backscattering code) [7], and exact calculations based on the Maxwell Equations are combined to recreate the measured spectral and polarization properties for the samples. A simulation model of the meteorite sample should be able to replicate both the spectral and polarization measurements, and the simulation parameters are tuned until these requirements are met.
Simulating the multiparticle media follows a method described in Martikainen et al. [8]. First the light-scattering properties of troilite inclusions are obtained by simulating troilite as different sized single particles using SIRIS and exact calculations. The light-scattering properties of these particles are then averaged over a size distribution to produce values that describe an ensemble of different sized particles. These values are then used as an internal medium in an olivine single particle, modeled using SIRIS. Light-scattering properties of different sized olivine particles are then averaged over their respective size distribution. The values of the size averaged olivine particles are then used to construct a multiparticle regolith media. The regolith media simulations are run using both SIRIS and RT-CB. RT-CB takes coherent backscattering into account in the modeling, and is thus suited for polarization modeling. Spectra are modeled using SIRIS, which is computationally lighter.
Initially the troilite was replaced by iron in the models. Troilite is a rare mineral in Earth’s crust and mostly found in meteorites. Troilite’s light-scattering properties have thus not been properly characterized, and its refractive index not accurately derived. In Moreau et al. [9], troilite has been synthesized, and from these samples the refractive index of troilite will be derived in the 400 nm – 2500 nm region. To derive the refractive index, the same method from Martikainen et al. [8] will be used. Ground and sieved troilite’s reflectance spectra will be measured. The spectra will then be modeled using multiparticle media, with varying refractive index values to find a best match between measurements and simulations.
A model is created that explains the scattering properties of the CY meteorite samples. The model for the meteorites is then compared to the observations of Phaethon. Model values representing particle size and roughness, composition, and porosity are optimized against Phaethon’s spectra and polarization data, especially focusing on explaining the surface heterogeneity between the hemispheres. The model can also be used to study the connection between Phaethon and Pallas by fitting it to spectral and polarization data from Pallas.
[1] F. L. Whipple, "1983 TB and the Geminid Meteors", International Astronomical Union Circular, Volume 3881, 1983.
[2] I. P. Williams, Z. Wu, "The Geminid meteor stream and asteroid 3200 Phaethon", Monthly Notices of the Royal
Astronomical Society, Volume 262, 1993.
[3] E. MacLennan, S. Marshall, Mikael Granvik, "Evidence of surface heterogeneity on active asteroid (3200)
Phaethon", Icarus, Volume 388, 2022.
[4] E. MacLennan, M. Granvik, "Thermal decomposition as the activity driver of near-Earth asteroid (3200)
Phaethon", Nature Astronomy, 8, 60–68, 2024
[5] A.J. King, H.C. Bates, D. Krietsch, H. Busemann, P.L. Clay, P.F. Schofield, S.S. Russell, "The Yamato-type (CY)
carbonaceous chondrite group: Analogues for the surface of asteroid Ryugu?", Geochemistry, Volume 79, Issue
4, 2019.
[6] K. Muinonen, T. Nousiainen, H. Lindqvist, O. Muñoz, G. Videen, "Light scattering by Gaussian particles with
internal inclusions and roughened surfaces using ray optics", Journal of Quantitative Spectroscopy and Radiative
Transfer Volume 110, 2009.
[7] K. Muinonen, "Coherent Backscattering of Light by Complex Random Media of Spherical Scatterers: Numerical
Solution", Waves in Random Media 14(3), 2004.
[8] J. Martikainen, A. Penttilä, M. Gritsevich, H. Lindqvist, K. Muinonen, "Spectral modeling of meteorites at
UV-vis-NIR wavelengths", Journal of Quantitative Spectroscopy and Radiative Transfer, Volume 204, 2018.
[9] J.-G. Moreau, A. Jõeleht, J. Aruväli, M.J. Heikkilä, A.N. Stojic, T. Thomberg, J. Plado, S. Hietala, "Bulk synthesis of
stoichiometric/meteoritic troilite (FeS) by high-tempera
How to cite: Vuori, M., Penttilä, A., Muinonen, K., MacLennan, E., and Granvik, M.: Modeling the surface properties of asteroid (3200) Phaethon using CY-chondrite meteorites, EPSC-DPS Joint Meeting 2025, Helsinki, Finland, 7–13 Sep 2025, EPSC-DPS2025-1582, https://doi.org/10.5194/epsc-dps2025-1582, 2025.
Lunar swirls are bright areas on the otherwise darker mare regions on the Moon. Our current study focuses on the Reiner Gamma swirl, centered slightly north of the equator and on the side facing Earth, at coordinates 7.5°N, 59.0°W. We are using the same data as prior research to the lunar swirl, namely the data in Weirich et al. (Planet. Sci. J. 4, 212, 2023) and Domingue et al. (Planet. Sci. J. 5, 161, 2024).
Our analysis of photometric data and the use of the particulate medium (PM) model (Muinonen et al., A&A 531, A150, 2011; Wilkman et al., PS&S 118, 255, 2015) follows our approach with the surface of Mercury (Björn et al., Planet. Sci. J. 5, 260, 2024). However, there is a difference in the extent of the area being examined: here, we apply the methods to a localized area on the Moon, as opposed to the average Mercury surface as in Björn et al. (2024). In addition, the amount of data is orders of magnitude larger than the Mercury data, which prevents the use of the same pipeline as before. Therefore, we use a Python-language implementation, healpy (Zonca et al., J. Open Source Softw. 4, 1298, 2019), of the HEALPix discretization (Górski et al., Astrophys. J. 622, 759, 2005) to reduce the number of data points by averaging the reflectance inside a bin in the incidence-emergence-azimuth angles. We utilize the Reiner Gamma swirl mapping results of Chuang et al. (Planet. Sci. J. 3, 231, 2022) to separately examine areas, or ”units”, with different brightnesses: the bright on-swirl unit, the dark off-swirl unit, and the transitionary diffuse-swirl unit.
To deduce physical properties of the regolith of Reiner Gamma, we apply the PM model to photometric data. The model describes a regolith with a fractional Brownian motion surface, which characterizes well the surface roughness of atmosphereless bodies in the Solar System (Muinonen et al., 2011). The model has three geometry parameters: the packing density v, the fractal Hurst exponent H, and the amplitude of height variation σ. Figure 1 shows the effects that the geometry parameters have on the regolith.
Our preliminary results for a subset of the data suggest that the diffuse-swirl regolith around Reiner Gamma is similar in surface roughness but less densely packed than Mercury’s regolith: v ≈ 0.44, H ≈ 0.60, σ ≈ 0.10. For comparison, the packing density of the regolith of Mercury was derived to be v = 0.547±0.004 (Björn et al., 2024). In the future, we plan to extend the analysis to photometric data of the Mare Ingenii swirl (33.7°S, 163.5°E) as well.
How to cite: Björn, V., Muinonen, K., Penttilä, A., Domingue, D., Weirich, J., Chuang, F., and Surkov, Y.: Photometric modeling of the regolith in the Reiner Gamma lunar swirl, EPSC-DPS Joint Meeting 2025, Helsinki, Finland, 7–13 Sep 2025, EPSC-DPS2025-1339, https://doi.org/10.5194/epsc-dps2025-1339, 2025.
1. Introduction
Accurate and high-resolution digital elevation models (DEMs) are essential for Martian landing site selection and geological analysis [1]. However, existing photogrammetric DEMs suffer from low resolution and limited coverage[2]. Traditional shape from shading (SfS) recovers pixel-scale terrain details based on surface reflectance model[3]. However, Martian atmospheric scattering distort image brightness, making it unreliable for representing actual terrain-induced variations, thereby reducing reconstruction reliability[3,4]. Current atmospheric correction methods rely on external sources such as the Mars Climate Database (MCD), or estimated through optimization, which are resolution-limited and unstable[5,6]. To address these limitations, a novel single-image shape from shading method with atmospheric correction (SI-AC-SfS) is proposed to generate high-resolution DEMs by integrating reflectance model into an atmospheric framework[6]. It estimates optical depth using a shadow-based inversion and simulates scattering parameters via the Discrete Ordinate Radiative Transfer (DISORT), eliminating reliance on external products[7]. Applied to a single Context Camera (CTX) image and a low-resolution DEM, it generates a high-resolution DEM with enhanced surface detail and higher accuracy compared to traditional SI-SfS, as validated against the HiRISE reference DEM.
2. Method
The proposed SI-AC-SfS method aims to reconstruct high-resolution DEMs of the Martian surface with improved geometric accuracy by correcting for atmospheric effects. The overall workflow comprises three main steps: 1) joint modeling of atmospheric scattering and surface reflectance; 2) atmospheric parameter estimation from image information and DISORT; and 3) construction and optimization of the SI-AC-SfS loss function. The method takes as input a single preprocessed CTX image and a low-resolution DEM and produces a refined high-resolution DEM.
3. Test data
The experimental analysis of the proposed SI-AC-SfS method was conducted using a single CTX image (6 m/pixel) and the corresponding photogrammetric DEM (20 m/pixel) to generate a high-resolution DEM (6 m/pixel). Evaluation was performed against a HiRISE DEM (1 m/pixel). The study site, located at the Perseverance rover landing site in Jezero Crater (18.41°N, 77.69°E), spans 7.08 km × 2.94 km. The CTX image was preprocessed (e.g., radiometric calibration) using ISIS3 software and manually registered to the photogrammetric DEM. Atmospheric optical depth and scattering parameters of the CTX image were estimated using a shadow-based inversion method and DISORT simulations, respectively. Table 1 summarizes the CTX image properties and atmospheric conditions.
Table 1. Basic information of the used image in the experimental
| Image ID | Image time | Incidence angle | Emission angle | Pixel resolution | solar azimuth | Optical Depth |
|
F05_XN_20N282W |
2014-08-16 |
57.34° |
8.88° |
5.62m |
256.49° |
0.32 |
4. Results
Figure 1 shows the input, generated, and reference DEMs. Both SI-SfS and SI-AC-SfS results contain more detailed information compared to the photogrammetric DEM, demonstrating their ability to reconstruct fine-scale topography. However, it is important to note that hillshade images reflect only enhanced surface details, and the geometric accuracy of the reconstructed DEM must be quantitatively assessed using a reliable reference DEM.
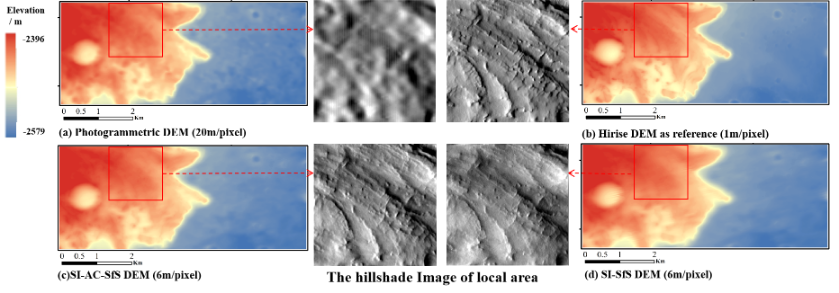
Figure 1. The input photogrammetric DEM and the generated DEM.
Table 2 summarizes the quality metrics of different DEMs. Although the traditional SI-SfS method yields a high PCC (0.83), it exhibits a larger RMSE than the initial DEM, indicating that uncorrected atmospheric scattering leads to visually plausible but geometrically inaccurate results. In contrast, the proposed SI-AC-SfS method achieves the lowest RMSE (3.74 m), MAE (2.91 m), and MAD (19.33 m) when compared with the HiRISE DEM. These results demonstrate that while SI-SfS enhances surface detail, atmospheric correction is crucial for ensuring geometric accuracy in high-resolution Martian DEMs.
Table 2. Overall quality metrics of the different DEMs.
|
Photogrammetric DEM |
SI-SfS DEM |
SI-AC-SfS DEM |
HiRISE DEM |
|
|
RMSE(m) |
4.03 | 4.09 | 3.74 | N/A |
|
MAE(m) |
3.12 | 3.12 | 2.91 | N/A |
|
MAD(m) |
24.75 | 20.89 | 19.33 | N/A |
|
PCC |
0.63 | 0.83 | 0.84 | 0.79 |
RMSE represents root mean square error; MAE represents mean absolute error; MAD represents maximum absolute deviation; PCC represents pearson correlation coefficient.
5. Discussion and Conclusion
Figure 2 presents a profile comparison from different DEMs to assess the effect of atmospheric correction. In the traditional SI-SfS result, image brightness caused by atmospheric scattering is misinterpreted as terrain variation, resulting in inaccurate elevation reconstruction at points A and B. In contrast, the proposed SI-AC-SfS DEM profile aligns more closely the HiRISE DEM, with a lower MAD (3.32 m) than SI-SfS (5.19 m) and the photogrammetric DEM (3.46 m).
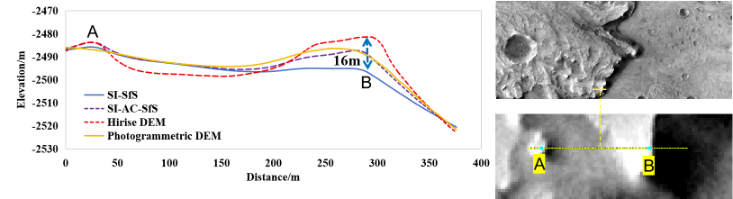
Figure 2. Profile comparison across different DEMs.
This study proposes the SI-AC-SfS method, which integrates an atmospheric scattering framework with optical depth and scattering parameters derived through a shadow-based inversion and DISORT simulation, effectively overcoming the traditional SI-SfS limitation of misinterpreting image brightness caused by atmospheric scattering as terrain variation. The experimental results demonstrate that the proposed SI-AC-SfS method is effective in generating reliable, high-resolution DEMs on Mars, providing critical support for future exploration missions. Future work will focus on the extension to a multi-image shape and albedo from shading framework with atmospheric correction to more effectively account for atmospheric scattering and albedo variations.
Acknowledgements
This work was supported by the National Natural Science Foundation of China under Grants 42221002 and 42101447. The authors would like to thank the MRO CTX and HiRISE teams (htt ps://ode.rsl.wustl.edu/mars/), as well as the developers of the open-source DISORT (https://github.com/LDEO-CREW/Pythonic-DISORT) and ISIS3 (https://isis.astrogeology.usgs.gov/).
References
[1] Lorenz R D. 2023. AdSpR. 71. 1. [2] Heipke C, Oberst J, Albertz J, et al. 2007. P&SS. 55, 14. [3] Alexandrov, O., & Beyer, R. A. 2018. E&SS. 5, 652. [4] Qian, J., Ye, Z., Qiu, S., et al. 2025. Icar, 25, 116494. [5] Liu, W. C., & Wu, B. 2023. JPRS. 204, 237. [6] Hess, M., Tenthoff, M., Wohlfarth, K., & Wöhler, C. 2022. JIm. 6, 158. [7] Shaheen, F., Scariah, N. V., Lala, M. G. N., et al. 2022. Icar. 388, 115.
How to cite: Qian, J., Ye, Z., Xu, Y., Huang, R., and Tong, X.: Single-image Shape and from Shading with Atmospheric Correction for Precise Topographic Reconstruction on Mars, EPSC-DPS Joint Meeting 2025, Helsinki, Finland, 7–13 Sep 2025, EPSC-DPS2025-849, https://doi.org/10.5194/epsc-dps2025-849, 2025.
Please decide on your access
Please use the buttons below to download the supplementary material or to visit the external website where the presentation is linked. Regarding the external link, please note that Copernicus Meetings cannot accept any liability for the content and the website you will visit.
Forward to presentation link
You are going to open an external link to the presentation as indicated by the authors. Copernicus Meetings cannot accept any liability for the content and the website you will visit.
We are sorry, but presentations are only available for users who registered for the conference. Thank you.
Planetary formation theories aim to explain the evolution of planets from the proto-planetary disk. Comets are thought to be primitive remnants that never accreted into planets and now reside in the Oort cloud and Kuiper belt. Their highly elliptical orbits shield them from solar radiation for most of their lifetimes, preserving their original composition. As such, comets offer a unique window into the early Solar System. Investigating their internal structure and composition can provide critical tests for models of planetary formation.
Previous in-situ missions have employed infrared (IR) spectroscopy and ground-penetrating radar to study cometary nuclei. While radar can probe below the surface, its spatial resolution is limited by long wavelengths. Conversely, IR provides high spatial resolution but lacks subsurface penetration. Terahertz (THz) time-domain spectroscopy offers a promising middle ground, combining centimeter-scale penetration with millimeter-scale resolution. Moreover, key molecular species, such as amino acids detected on comets, exhibit distinctive absorption features in the THz range.
As part of the SUBICE project, we are investigating the suitability of THz time-domain spectroscopy for in-situ space applications. For that purpose, we built a laboratory setup called COCoNuT (Characteristic Observation of Cometary Nuclei using THz-spectroscopy) [1]. COCoNuT can simulate the conditions found on comets in a thermal vacuum chamber and houses a commercial THz time domain spectrometer. Using cometary simulants, we conduct proof-of-concept experiments to assess the viability of this technique for future space missions [2].
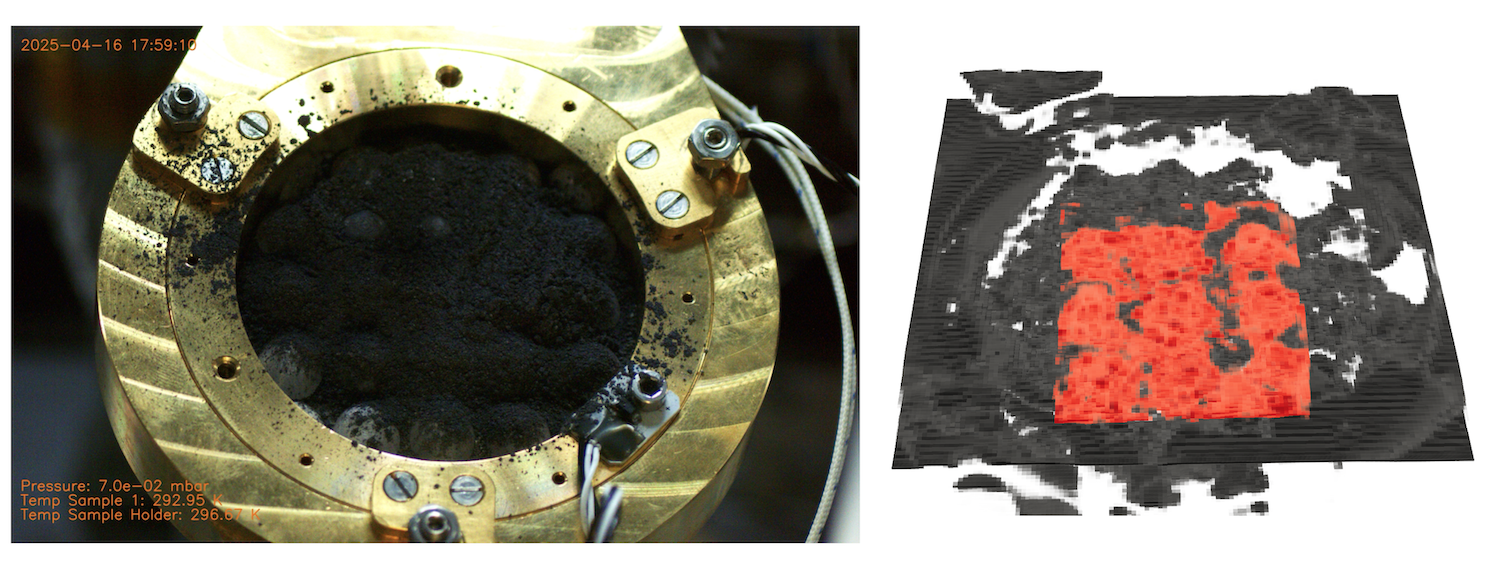
Figure 1: Pebble simulant printed out of Cyclic-Olefin-Copolymer (COC) and covered with cometary dust analogue (SiO2/charcoal, 9:1 mixture). The 3D THz scan with the reconstructed pebbles in red is shown to the right.
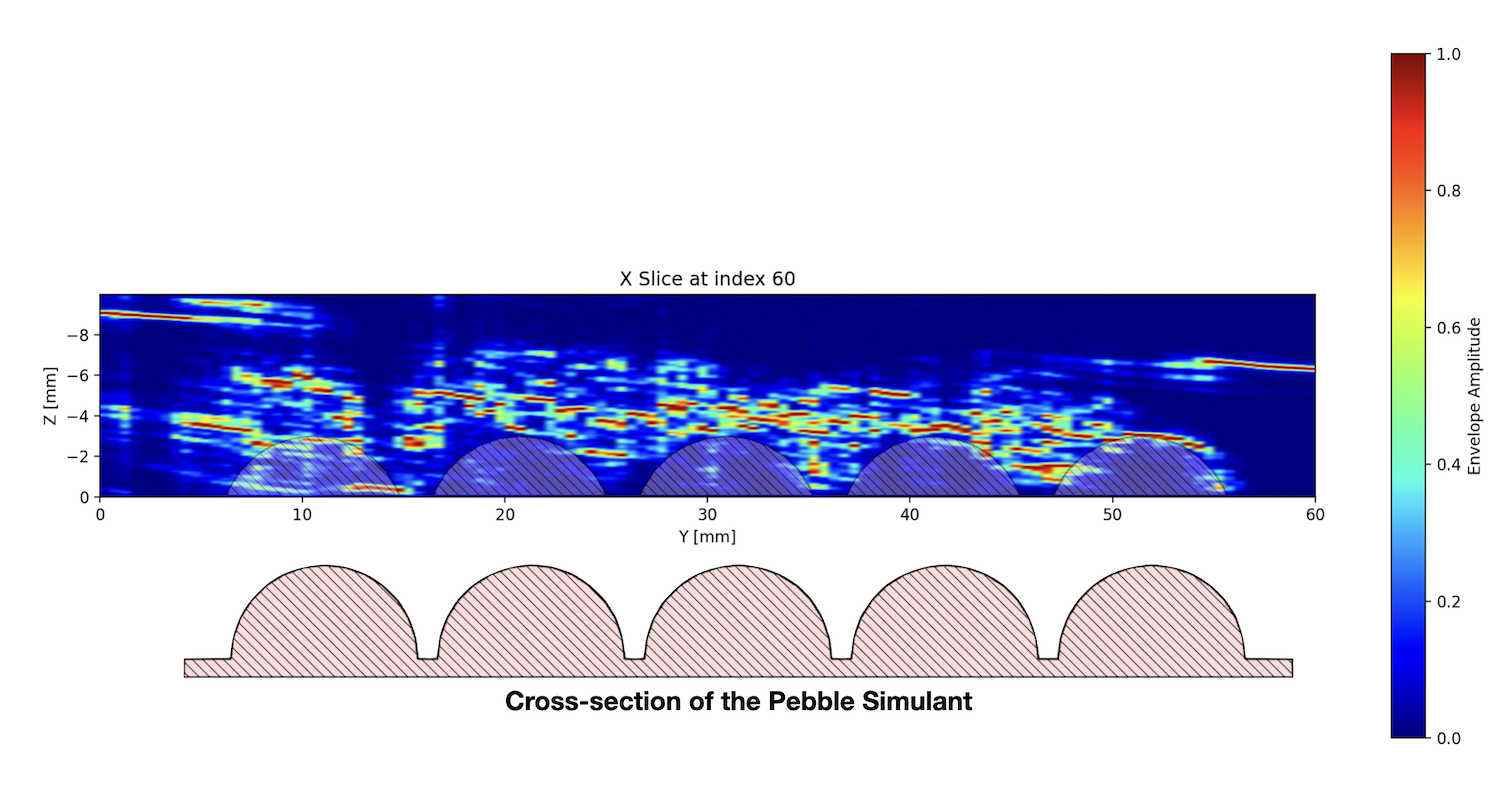
Figure 2: A slice of the cometary simulant scan. The cross section of the pebble simulant is shown below and also overlayed. The sample holder top surface is visible on the sides of the scan as a straight line. The pebbles are clearly visible as voids in the scan.
Initial measurements of ice-analogues and SiO2/charcoal dust shows that we can reconstruct pebbles located underneath the dust layer as shown in Figures 1 and 2.
We will present measurements with porous ice and ice pebbles along with olivine dust analogues.
References:
[1] Linus Leo Stöckli, Mathias Brändli, Daniele Piazza, Rafael Ottersberg, Antoine Pommerol, Axel Murk, Nicolas Thomas; Design and commissioning of a THz time-domain spectro-goniometer in a cryogenic comet simulation chamber. Rev. Sci. Instrum. 1 March 2025; 96 (3): 034502. https://doi.org/10.1063/5.0252742
[2] Pommerol, A., Jost, B., Poch, O. et al. Experimenting with Mixtures of Water Ice and Dust as Analogues for Icy Planetary Material. Space Sci Rev 215, 37 (2019). https://doi.org/10.1007/s11214-019-0603-0
How to cite: Stoeckli, L., Demion, A., Belousov, D., Meier, V., Nicollerat, M., Girard, H., Ottersberg, R., Pommerol, A., Moerschell, J., Murk, A., and Thomas, N.: The potential of in-situ THz-spectroscopy to resolve the subsurface structure of Comets, EPSC-DPS Joint Meeting 2025, Helsinki, Finland, 7–13 Sep 2025, EPSC-DPS2025-1297, https://doi.org/10.5194/epsc-dps2025-1297, 2025.
Introduction: The surfaces of airless bodies, such as asteroid (101955) Bennu, are typically composed of a regolith mixture containing both coarse and fine particulates. Observations from NASA’s Origins, Spectral Interpretation, Resource Identification, Security, Regolith Explorer (OSIRIS-REx) mission demonstrated a discontinuity between the remote sensing derived thermophysical properties and thermal spectroscopy results, indicating that a fine layer of dust may be coating the large boulders and coarse regolith surface [1]. To better understand the impact of such a coating on the thermal infrared spectra measured at Bennu, this work developed experimental methods for simulating dust coverings using Space Resource Technology’s CI simulant, based on the bulk composition of the Orgueil meteorite [2].
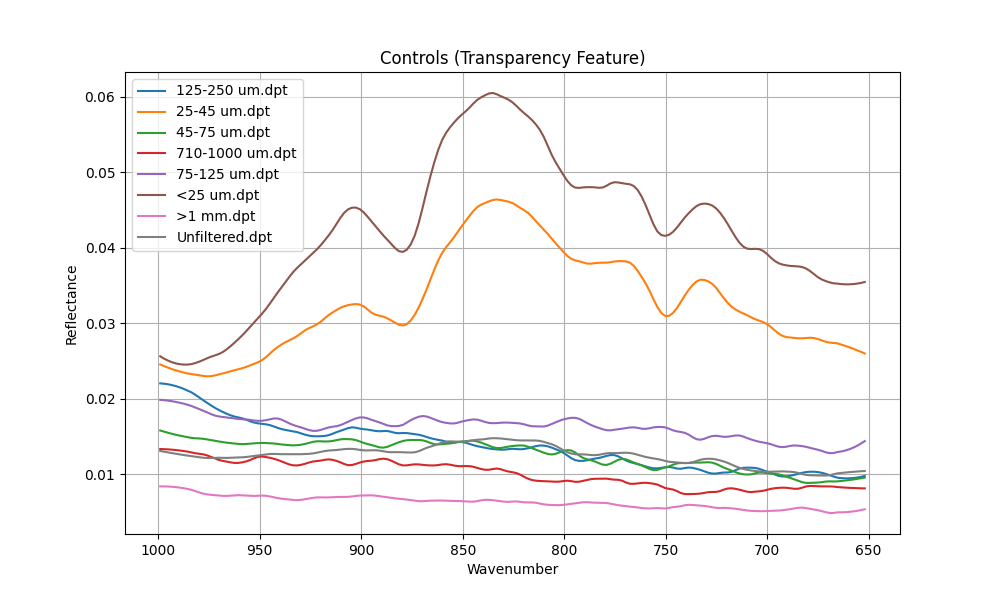
Figure 1: FTIR Reflectance Spectra of Control Samples of CI simulant.
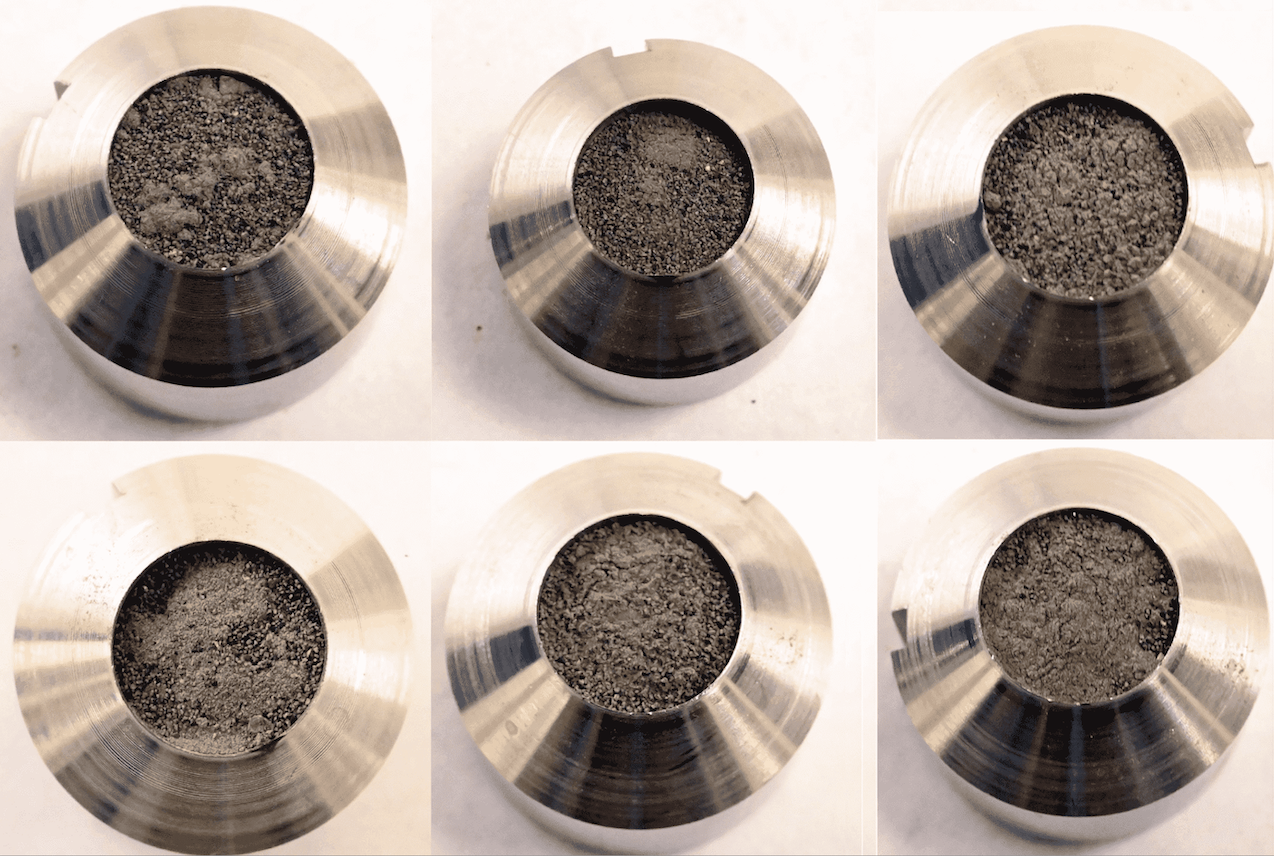
Figure 2: Figure 2: Microscope Camera Images of Sample Surfaces (7%, 10%, 15%, 20%, 25%, 50% Fines wt) of CI simulant
Methods: The CI simulant was first sieved into seven size fractions: <25, 25-45, 45-75, 75-125, 125-250, 710-1000, and >1000 mm. An unsieved sample was used as a control. The spectra of the eight samples were measured using a Bruker Vertex 70v Fourier Transform Infrared Reflectance (FTIR) spectrometer, normalized using a gold standard prior to and after measurements, in the range of 1000-650 cm-1 (Figure 1). The dust coating was simulated by placing increasing mass fractions of fine particulates (<25 mm) onto coarse particulates (125-250 mm) using tweezers. Images were collected using a mirrorless Nikon Z6III microscope to capture surface roughness features (Figure 2). The dust layers were measured at approximately 5%, 7%, 10%, 15%, 20%, 25%, and 50% fines by total mass in the FTIR spectrometer (Figure 3).
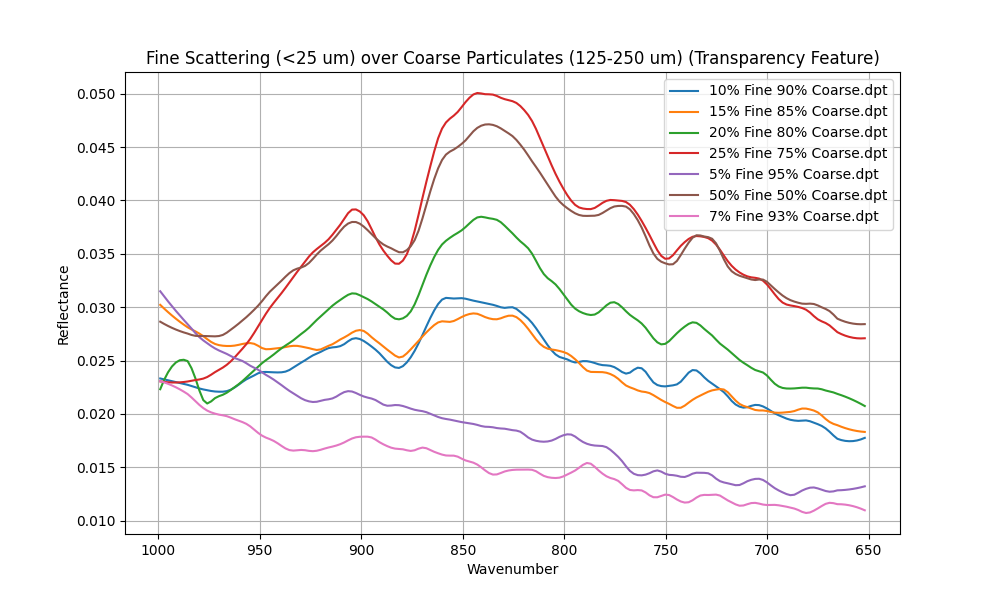
Figure 3: FTIR Reflectance Spectra of Fine-Dusted Samples of CI simulant.
Results: Clumping of Fines: The fine particles of the CI simulant used are particularly susceptible to clumping, likely owing to elevated electrostatics interparticle forces. The result is an uneven covering of dust across the surface of the samples (Figure 2), causing heterogeneity across the top layer of the sample. Future work aims to reduce this clumping effect by using alternative dust deposition mechanisms, including sieves, electrically charged tubes, and air circulation chambers.
Controls: As shown in Figure 1, the spectra fell within two categories: spectra with evidence of a Transparency Feature (TF) ( <45 mm) and those without (>45 mm). This switch is indicated by the appearance of broad transparency features, such as the minimum around 875 and the broad peak around 835 cm-1. Furthermore, the Reststrahlen bands, associated with the vibrational modes of silicates, around 750 cm-1, become more apparent with decreasing particle size.
Fine Coatings ( <45 mm): The simulated dust coatings provided insight into the amount of fines, by mass, required to see fine-dominated spectral features in the overall spectra of the regolith samples. We discovered that very little (>7% wt) fine coverage was required to begin dominating the spectra (Figure 3), indicating that even small amounts of dust coverings could have visible effects on the spectra (e.g. the emergence of TFs and >10% change in the spectral slope).
Implications for OSIRIS-Rex Findings: From the data returned by the OSIRIS-Rex Thermal Emission Spectrometer (OTES) [3], thermal inertia modelling imply that the surface is porous;, however, the spectral findings indicate that the surface is composed of non-porous? rocks with thin dust coatings [4]. Our experiments find that as little as ~7 wt % of <25 µm fines can impose a fine-dominated spectral signature on a 125–250 µm substrate, meaning that spectrally visible coatings on Bennu can be achieved by dust layers only a few microns thick. Therefore, a thin, laterally discontinuous coating could reconcile the difference between Bennu’s rock-controlled thermal inertia and the fine-grained spectral observations measured by OTES. Incorporating wavelength-dependent transmissivity for 10-50 µm coatings could therefore refine surface property constraints for Bennu.
Conclusion: We found that a negligible mass fraction (>7% wt) was sufficient to overwhelm and dominate mid-infrared emissivity spectra. The results indicate that the discontinuity in OTES data could be linked back to dust coating on the larger rocks and boulders.
References: [1] Tinker C. et al. (2023) RAS Techniques and Instruments (Vol. 2, Issue 1). [2] Landsman Z. et al. (2020) EPSC 2020. [3] Christensen P. R. et al. (2018) Space Science Reviews (Vol. 214, Issue 5). [4] Rozitis B. et al. (2022) JGR: Planets (Vol. 127, Issue 6). [5] Rivera-Hernandez F. et al. (2015) Icarus (Vol. 262).
How to cite: Belhadfa, E., Bowles, N., and Shirley, K.: Quantifying Thin Dust Layer Effects on Thermal-IR Spectra of Bennu-Like Regolith: FTIR Experiments with CI Asteroid Simulant , EPSC-DPS Joint Meeting 2025, Helsinki, Finland, 7–13 Sep 2025, EPSC-DPS2025-531, https://doi.org/10.5194/epsc-dps2025-531, 2025.
1 - Introduction
Understanding the geological processes is a key objective for future lunar exploration. The ESA Màni mission aims to advance this understanding by characterizing the lunar regolith with high resolution imagery, Digital Elevation Model and photometry. This study focuses on the photometric behavior of lunar areas across multiple regions, leveraging an advanced model to estimate the best satellite mission scenario to predict the microphysical properties. At the core of this investigation is the use of the Hapke radiative transfer model [1], a widely used semi-empirical approach for light interaction.
Similar photometric studies on other planetary bodies, such as Europa Mars [2][3] and Europa [4], have demonstrated the effectiveness of multi-angle reflectance observations combined using inversion techniques for retrieving surface microtexture.
Through the application of the Bayesian Monte-Carlo inversion framework [5], we used the mc3 inversion tool [6] and quantified the surface properties that govern the scattering and absorption of light. Particular attention is paid to the efficiency and biases associated with the photometric sampling, following the findings of [7], and to the light-scattering behavior of surfaces as previously explored in experimental study [8].
2 - Method
2.1 - Mission orbit design
The Màni mission will employ a multiple-pass polar orbit strategy, at an altitude of 50 km. The repeated high-resolution data collected will contribute to a deeper understanding of lunar geology and support the broader goals of lunar exploration, including future manned missions and resource utilization.
We assume here the Moon as a perfect sphere. The left side of the Figure 1 represents a global view of the Moon and the mission. Here, the yellow star symbol (L, for light source) represents the subsolar point of the Sun on the surface, the green circle symbol (O, for observer) represents the observer point, which is the location of the satellite and the red circle symbol (T, for target) shows the target position. This configuration reveal crucial angles such as incidence (θ), emergence (θ0), phase (α) and azimuth (ψ) used to calculate and inverse the reflectance.
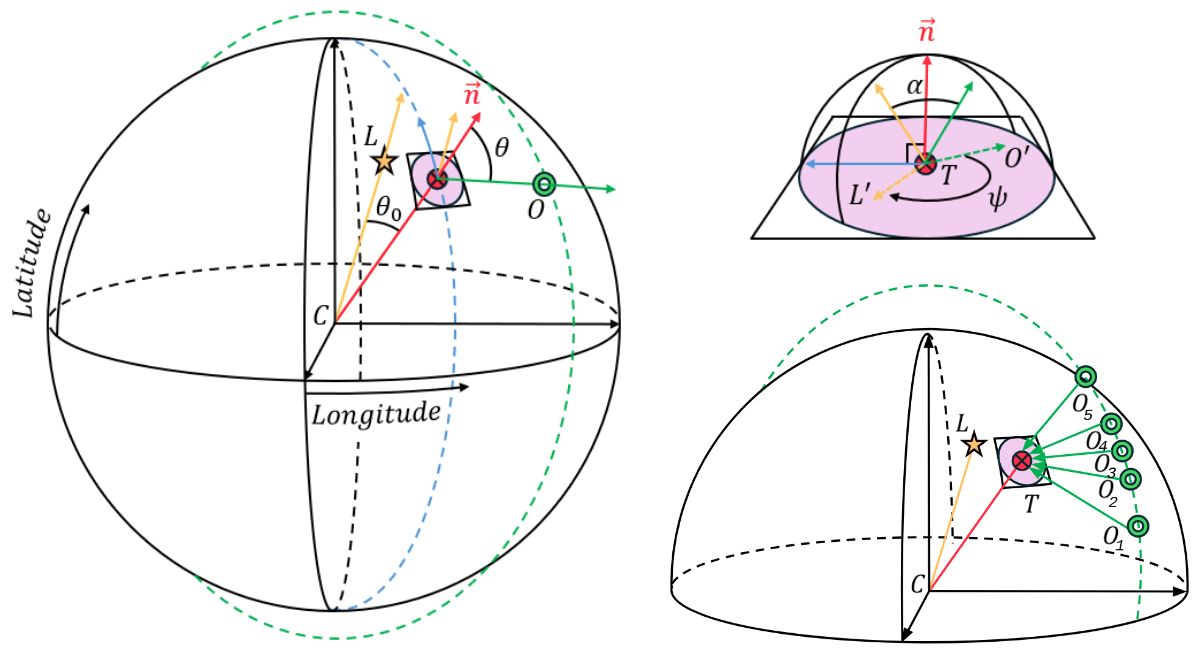
Figure 1 : System coordinates and geometries used for a given scenario. The right figure represents a zoom on the normal plan from the target normal vector (n).
A total of 93 plausible mission geometry were created, with a target at nadir, medium and high latitudes (0o,45o,70o) with different orbits longitudes (−10o,0o,10o).
2.2 - Surface photometry
For the target surface, a variety of 12 photometric microstructure surfaces using different single scattering albedo (ω), Hapke mean slope roughness (ζ), opposition effect amplitude (B0), asymmetry parameter (b), back scatter fraction (c) and opposition effect width (h) are set. To simulate the mission, we combined all the geometries and photometries to make a single dataset of 1116 different scenarios. By evaluating these scenarios, we aim to better understand how photometric behavior varies under different microphysical conditions, informing the optimal choice of parameters for the mission’s orbital configurations.
2.3 - Efficiency
To simulate the mission, we combined all the geometries and photometries to make a single dataset of 1116 different scenarios. We evaluate each scenarios by using the efficiency (E) using the strategy defined in [8]. The main steps are described here after. (i) The reflectance corresponding to each of the 1116 different scenarios (all combinations of possible 93 geometry and 12 photometry) are computed. (ii) For each one of them, the Bayesian inversion is performed, incorporating noise level of 10% and 2%. (iii) The quality of the knowledge on the photometric parameters is estimated by the efficiency "E". The closer the solution to the true parameter set is, the better the estimate. We measure the quality of the tested geometry by considering, for every parameter (for example ω′), the part of the distribution σ(ω′) which lies inside the interval [σ(ω′) − ϵ, σ(ω′) + ϵ], where ϵ is set to 1% of the total parameter space.
3 - Results and Simulations
Figure 2 shows an example of the knowledge on the photometric parameter in one example out of the 1116 scenarios. Given the noise level, a significant fraction of the solutions are outside the ϵ =1% acceptable domain but the maximum likelihood is close to the true solution. The proxy is respectively 2.65 and 6.41 for this example.
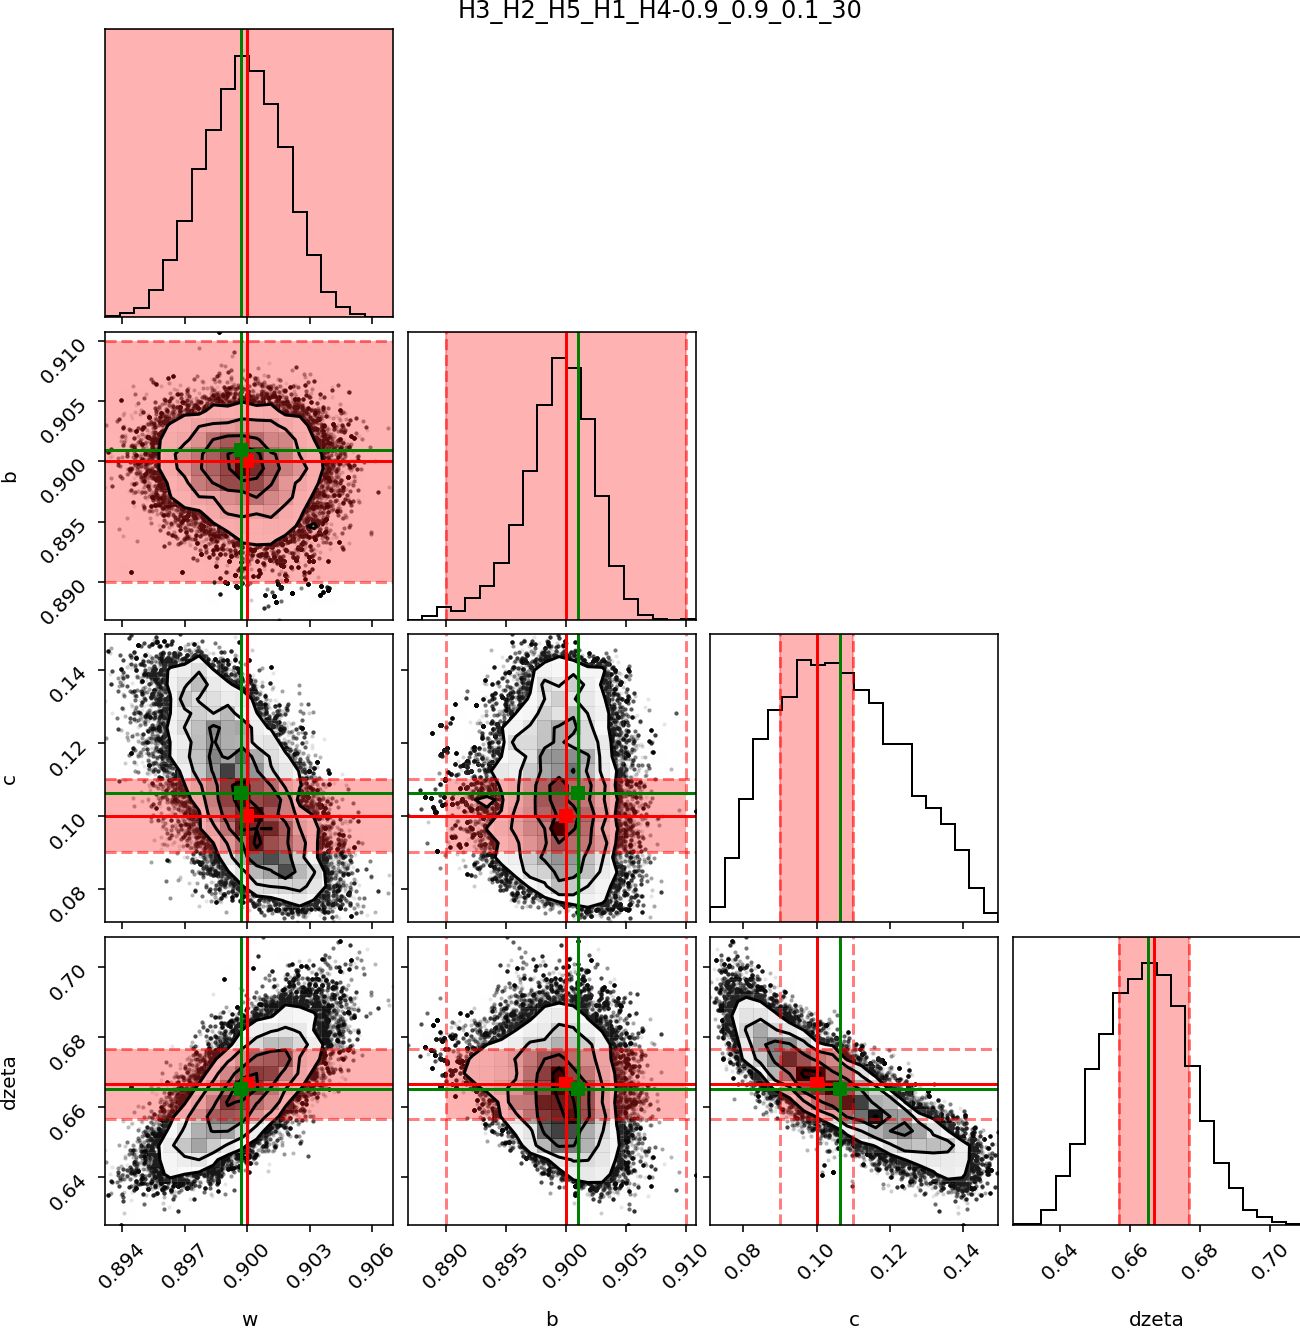
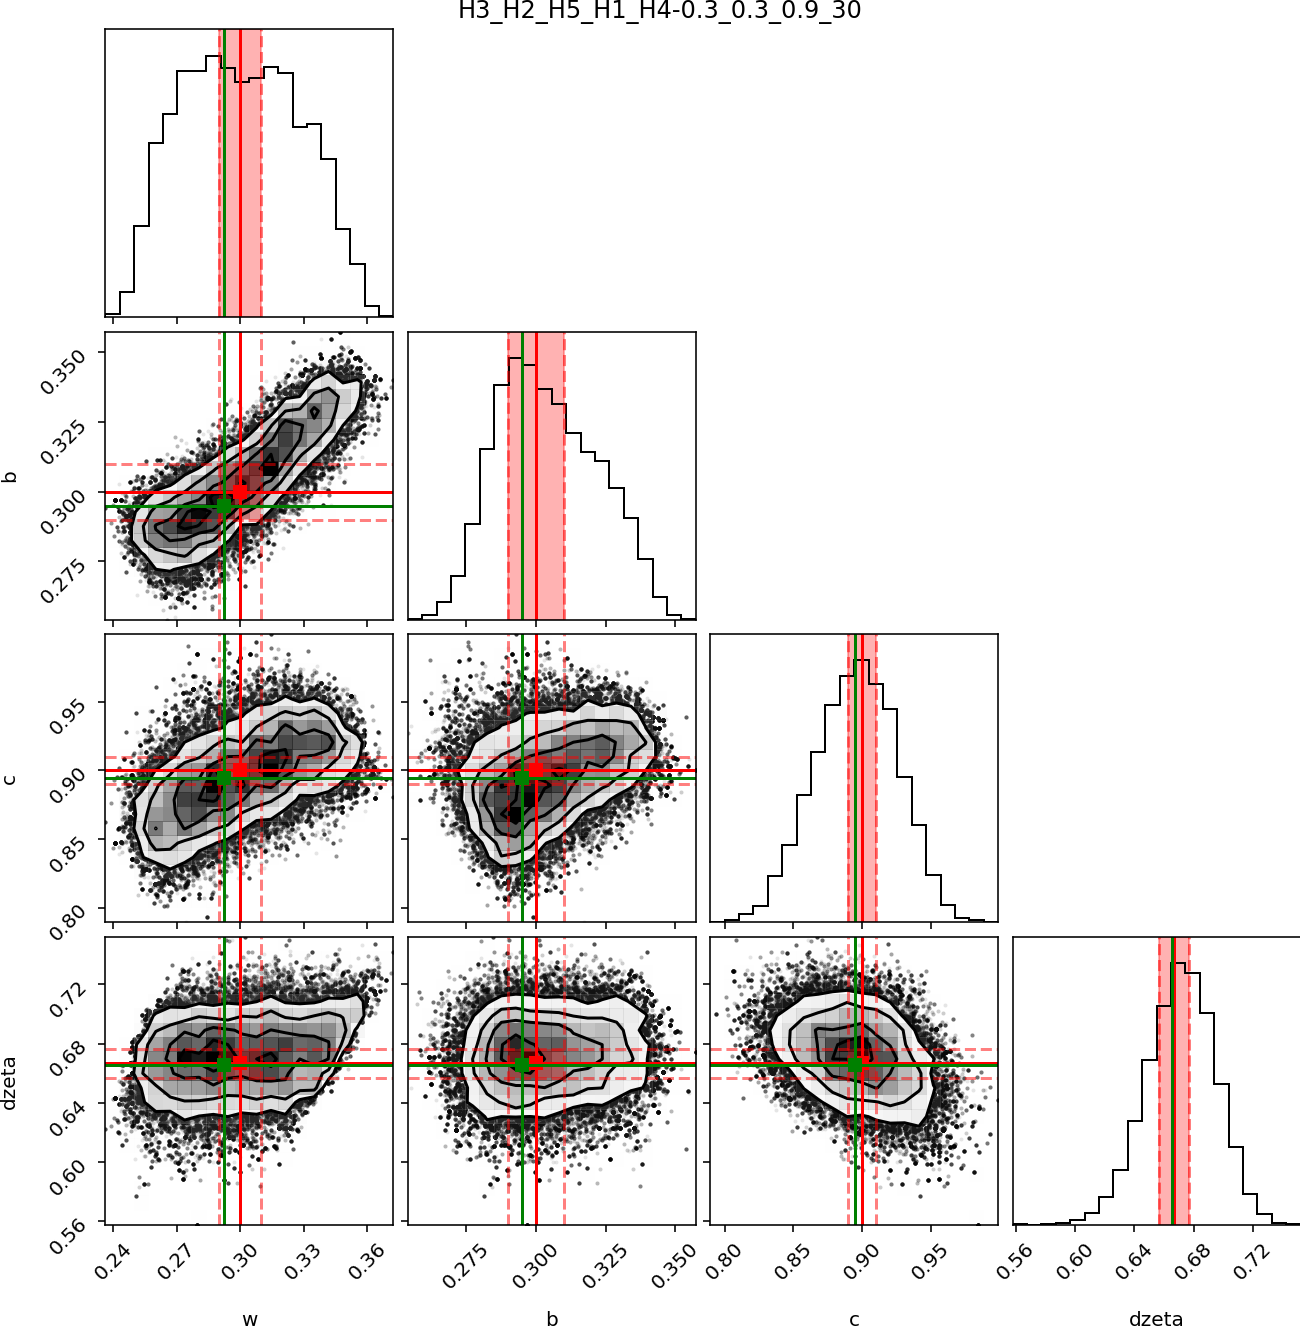
Figure 2 : Results of the mc3 tool for the inversion of the synthetic reflectance at an SNR of 10% for a combination of 5 orbits with a target at 70o latitude for a surface photometric property of (ω=0.9, b=0.9, c=0.1 and ζ=30) and (ω=0.3, b=0.3, c=0.9 and ζ=30).
This approach enables the explicit identification of the incidence, emergence and phase angle combinations that are most effective in predicting the physical parameters of a given type of microtexture. By comparing the proxy value, we demonstrate that 25 observations (5 observations for each of 5 orbit) at 10% noise level contains less information that 15 observations (5 observations for each of 3 orbit) at 2% noise level.
4 - Conclusions
This results provide critical insights into the optimal orbital geometries and observation strategies needed to robustly retrieve lunar surface properties. By identifying the most effective measurements configurations, this work lays the foundation for enhancing the scientific return of future photometric missions, contributing to a deeper understanding of the Moon’s regolith evolution and aiding the preparation for upcoming exploration activities.
References
[1] H. Sato et al. Journal of Geophysical Research: Planets, 2014.
[2] J. Fernando. Thesis, Université Paris Sud - Paris XI, 2014.
[3] J. Fernando et al. Planetary and Space Science, 2016.
[4] I. Belgacem et al. Icarus, 2020.
[5] K. Mosegaard et al. Journal of Geophysical Research, 1995.
[6] P. Cubillos et al. The Astronomical Journal, 2016.
[7] F. Schmidt et al. Icarus, 2019.
[8] A. F. McGuire et al. Icarus, 1995.
[A] J. Frydenvang et al., this meeting, https://meetingorganizer.copernicus.org/EPSC-DPS2025/EPSC-DPS2025-318.html
How to cite: Lancery, H., Schmidt, F., Andrieu, F., Frydenvag, J., Mosegaard, K., and Fernandes, I.: Optimal Photometric geometries for a space mission, EPSC-DPS Joint Meeting 2025, Helsinki, Finland, 7–13 Sep 2025, EPSC-DPS2025-267, https://doi.org/10.5194/epsc-dps2025-267, 2025.
Light scattering by cosmic dust particles is central to interpreting photometric and polarimetric observations in planetary science. The scattering properties of particles are described by the 4×4 scattering Mueller matrix (F). For ensembles of randomly oriented particles and their mirror counterparts, the Mueller matrix reduces to a block-diagonal form with six non-zero angular functions: a₁, b₁, a₂, a₃, b2, and a₄,

These functions encode the angular behavior of scattering and are often derived from theoretical computations or laboratory measurements. However, existing models may violate required symmetry relations or lack flexibility for inverse modeling tasks.
We provide a concept of an explicit parametric model of complex angular dependencies of scattering matrix elements by empirical parameterization of the Mueller matrix based on analytical functions [1]. The model incorporates physical insights, such as forward- and backward-scattering behaviors and backscattering surges, while enforcing symmetry constraints derived from scattering theory [2]. It enables compact representations of the Mueller matrix: measured matrices can be described with as few as 28 free parameters averaging fewer than five per function. The full model supports up to 44 parameters in its most general form for increased flexibility. The model further allows for an efficient transport and utilization of scattering matrices in multiple scattering applications.
The parameter estimation process consists of three stages: initialization, nonlinear least-squares optimization, and uncertainty quantification using Markov chain Monte Carlo (MCMC) methods. The MCMC approach allows us to derive statistical distributions for all model parameters, producing confidence intervals and uncertainty envelopes for the modeled scattering matrix elements.
We applied our model to a range of experimental scattering matrices from the updated Granada-Amsterdam Light Scattering Database [3], which includes measurements for cosmic dust analogs such as meteorites, regolith simulants, minerals (e.g., feldspar, hematite, rutile), as well as water ice [4]. Across these samples and wavelengths, the model achieves relative root-mean-square deviations on the order of 1%, demonstrating its robustness and accuracy. The model also enables the extraction of physically meaningful descriptors—such as asymmetry parameters, polarization minima and maxima, and inversion angles—which support interpretation of phase curve dependencies.
In particular, we show that the parameterization accurately reproduces the angular trends in both intensity and polarization, including features like negative polarization branches and forward-scattering peaks. The model handles noisy or incomplete data gracefully, and symmetry enforcement helps reduce overfitting and improve physical plausibility.
Our empirical model serves as a valuable tool for radiative transfer applications, including the modeling of disk-integrated photometric and polarimetric phase curves of atmosphereless Solar System objects (e.g., satellites, asteroids, comets) [5]. The compact parameterization facilitates both forward simulations and inverse retrievals of dust properties. Moreover, it opens possibilities for applying machine learning methods to scattering data analysis, due to its consistent structure and small parameter set.
In conclusion, the presented parameterized Mueller matrix approach enables efficient, physically grounded modeling of light scattering by cosmic dust. It bridges the gap between complex experimental data and practical radiative transfer applications [6,7].
Ongoing work focuses on applying the model to the full Granada-Amsterdam database, developing global trends across materials, and integrating the parameterization into inverse modeling of remote sensing observations.
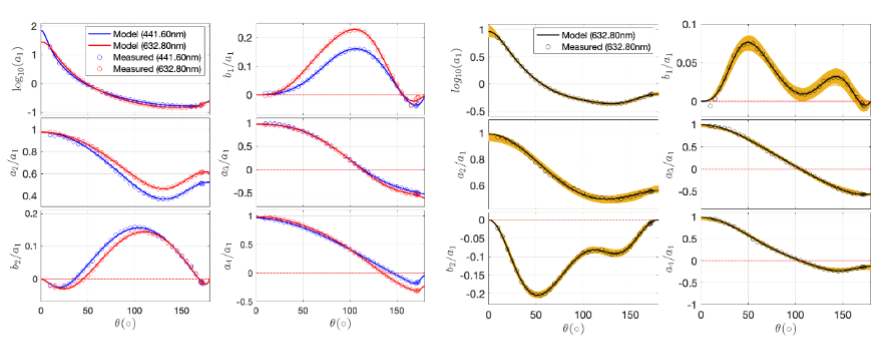
Figure 1: Measured data and model for feldspar (left) and hematite measured data and model with uncertainty envelope (right).
[1] Muinonen, K. & Leppälä, A, in preparation, (2025)
[2] Hovenier, J.W., van der Mee, C.V.M. (1983). Fundamental relationships relevant to the transfer of polarized light in a scattering atmosphere. Astronomy & Astrophysics 128, 1-16.
[3] Muñoz O., Frattin E., Martikainen J. et al. (2025). Updated Granada-Amsterdam Light Scattering Database. JQSRT 331, 109252.
[4] Muinonen, K. & Markkanen, J. 2023, in Light, Plasmonics and Particles, ed. M. P. Mengüç & M. Francoeur, Nanophotonics (Elsevier), 149–165
[5] N. Kiselev et al., New Polarimetric Data for the Galilean Satellites: Io and Ganymede Observations and Modeling, Planet. Sci. J. 5, 10 (2024)
[6] K. Muinonen, A. Penttilä, Scattering matrices of particle ensembles analytically decomposed into pure Mueller matrices, JQSRT 324, (2024)
[7] K. Muinonen et al., Coherent backscattering in discrete random media of particle ensembles, JQSRT 330, (2025)
How to cite: Leppälä, A., Muinonen, K., Penttilä, A., Muñoz, O., and Videen, G.: Empirical Parameterization of Mueller Matrices for Light Scattering by Cosmic Dust, EPSC-DPS Joint Meeting 2025, Helsinki, Finland, 7–13 Sep 2025, EPSC-DPS2025-632, https://doi.org/10.5194/epsc-dps2025-632, 2025.
Modeling the brightness of a surface consisting of particulate material is a problem we often face in planetary science, but it is also present in many other fields from Earth remote sensing to material science and industrial applications. The forward problem depends on particle sizes, shapes, packing, and the optical properties of the materials. In the inverse problem, we want to estimate some of the mentioned properties from the scattering characteristics of the material.
In general, the forward problem can be difficult if the particulate material has rough structure in many size scales including the scale of the wavelength considered, in which case the Maxwell equations need to be solved for the wavelength scale. However, if the particles are large compared to the wavelength, we can employ a geometric optics approximation to calculate average single-scattering properties of the grains in the material, and a radiative transfer approximation to consider the response of the particulate material.
We have employed the abovementioned modeling to study the effect of particle size and complex refractive index m=n+ik on the reflected intensity of particulate surfaces. The direct application of this method is the inversion of m, and especially the extinction coefficient k, from reflectance measurements with known particle shapes and sizes.
We simulate the forward problem in a grid of input parameters (size, n, and k) and create a library of reflectance values that are integrated over the backward scattering hemisphere of a particulate surface when illuminated directly from above. Particle shape is fixed to a random convex polyhedral shape. Single-particle scattering properties are simulated using the SIRIS[1] geometric optics code, and multiple scattering and the backward hemispherical reflectance with RT-CB[2] code employing only the radiative-transfer part as the coherent backscattering effects are not important here.
We present the results of these simulations and show how the received reflectance can be approximated with a simple, logistic-type function with the size parameter of the particles (size in relation to the wavelength) and the extinction coefficient combined into a single parameter, and the real part not having any significant role in this approximation. The analytical approximation can be used for quick inversion of reflectance measurements for the extinction coefficient with known size or to the size with known extinction coefficient [3]. Finally, we present the predictions using this model for mixtures of Mercury-related endmembers created in the ISSI project “Wide-Ranging Characterization of Explosive Volcanism on Mercury: Origin, Properties, and Modifications of Pyroclastic Deposits” led by A. Galliano, and compare to measurements of the mixtures.
[1] Muinonen et al. (2009). Light scattering by Gaussian particles with internal inclusions and roughened surfaces using ray optics. JQSRT 110, 1628–1639.
[2] Muinonen K, 2004. Coherent backscattering of light by complex random media of spherical scatterers: Numerical solution. Waves in Random Media 14(3), 365-388.
[3] Penttilä et al. (2024). Modeling linear polarization of the Didymos-Dimorphos system before and after the DART impact. The Planetary Science Journal, 5(1), 27.
How to cite: Penttilä, A., Martikainen, J., Vuori, M., and Muinonen, K.: Simple empirical approximation for surface reflectance of particulate materials in geometric optics regime, EPSC-DPS Joint Meeting 2025, Helsinki, Finland, 7–13 Sep 2025, EPSC-DPS2025-752, https://doi.org/10.5194/epsc-dps2025-752, 2025.
Background
For decades, remote sensing has been the most important window to study the surfaces of planetary bodies. Inferring the physical properties like the composition, microstructure and topography of such surfaces based on photometric and spectroscopic observations remains a challenging problem to date.
Laboratory experiments, as well as analytical and numerical models, are used to enable this inversion. Analytical models based on the two-stream approximation in semi-infinite media (e.g. Hapke model) are widely used in the community to fit spectroscopic datasets and infer properties like grain sizes. This approach is at least partially empirical, and the applicability of such models to highly multiple-scattering media like icy regolith is debated.
Numerical models can be grouped into those that calculate the interactions of the light and the scattering media in the geometric optics (GO) regime and those that numerically solve the electromagnetic field equations to reproduce wave effects like diffraction and interference. While both numerical approaches are limited by computational performance, implementations in the GO limit for small systems of hundreds of particles can be solved with tens of CPU hours, while the latter requires high-performance parallel computing with a computational cost in the order of CPU years.
Methods
For simulations in the GO regime, the intersection of the photon path with complicated meshes is the most expensive computational problem. The demand for real-time ray-tracing-based rendering in computer vision and in the gaming industry led manufacturers of graphical processing units (GPU) to develop specialised hardware on the chips to accelerate this step.
We developed a ray-tracing simulation that uses this hardware acceleration and runs purely on the GPU. This allows us to push the boundaries of numerical simulations in the GO regime to laboratory-sized samples consisting of millions of particles and highly multiple scattering systems.
A triangular mesh represents the geometry of the scattering medium. Arbitrary grain shapes and surfaces can be modelled. The geometric optics limit gives the highest meaningful resolution of details at a few times the wavelength. The sample can consist of different materials. The optical properties of each material are given by its real and imaginary index of refraction. This allows the simulation of the interaction of light with regolith samples composed of millions of particles with arbitrary grain shapes, complex microstructures or layered systems without any further assumptions.
The ray-tracing algorithm launches tens of millions of parallel rays into the scene, with all of them having a Stokes vector that tracks the polarisation state. Absorption and scattering are handled probabilistically, the latter by solving the Fresnel equations and Snell’s law at every particle intersection. One ray can scatter many ten thousand times between or inside of particles until it is absorbed or escapes the sample.
The simulation outputs the position of the last intersection, the direction and the Stokes vector of all scattered rays. The location of absorption is saved for all rays that don’t escape the sample. This allows the calculation of the bidirectional reflectance function, the deposition depth of the absorbed energy and the polarisation state of the reflected light. If the simulation is run for a large grid of wavelengths, the reflectance spectrum of the sample can be calculated.
The simulation duration for 10’000’000 rays in a particulate medium consisting of millions of particles with hundreds of scattering interactions per ray is in the order of minutes on a high-end consumer GPU.
Results
As a first test, we modelled a particulate ice sample composed of spherical grains with a diameter of 70±30 µm. The grains were packed to a volume fraction ρ=0.5 (see Figure 1). This closely resembles the laboratory analogue sample produced by flash-freezing droplets in liquid nitrogen as described by the SPIPA-B protocol. We present results including the energy deposition depth in function of the incidence angle, the bidirectional reflectance distribution function and the reflectance spectra of this and other modelled samples.
Conclusions
We developed a GPU-accelerated ray-tracing code that simulates the interaction of light with planetary regolith. The efficiency of the code allows the simulation of laboratory-sized samples for a large group of conditions. Within the GO regime, it enables the study of a wide range of observables and effects, including the simulation of bidirectional reflectance function and reflectance spectra, the hemispherical albedo in function of incidence angle, the energy deposition depth in function of incidence angle, the effect of grain size, shape and bonds, the impact of surface roughness on different size scales and the mixing of different compositions.
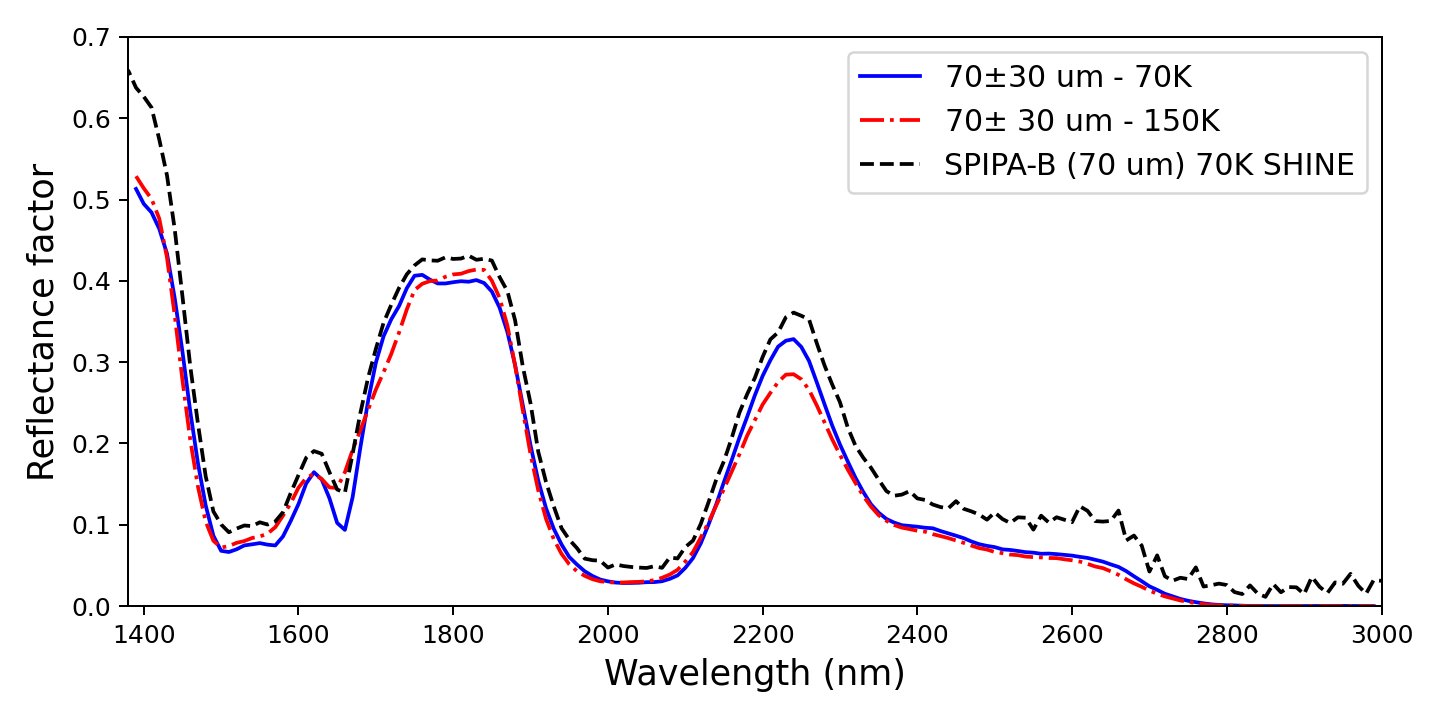
Figure 1: Two simulated reflectance spectra with 1’000’000 rays per wavelength. The incidence angle is 0°, the emission angle between 10-40°. The real and imaginary indices of refraction are from Mastrapa et al. 2008 (10.1016/j.icarus.2008.04.008). The sample consists of millions of spherical ice particles with a gaussian size distribution around 70 um that are packed to a volume fraction ρ=0.5. The simulation for the whole wavelengths range takes less than an hour on a single GPU. A laboratory reflectance spectrum of a SPIPA-B granular ice sample is shown in comparison.
Data reference for the laboratory spectrum:
Stephan, Katrin; Ciarniello, Mauro; Poch, Olivier; Haack, David; Raponi, Andrea (2019): Vis-NIR reflectance spectra of H2O ice with varying grain sizes (70-1060µm), shapes (spherical or irregular) and three mixtures, from 70 to 220 K. SSHADE/CSS (OSUG Data Center). Dataset/Spectral Data. https://doi.org/10.26302/SSHADE/EXPERIMENT_OP_20201223_001
How to cite: Ottersberg, R., Pommerol, A., and Thomas, N.: Modelling light scattering in icy planetary regolith using GPU accelerated ray-tracing, EPSC-DPS Joint Meeting 2025, Helsinki, Finland, 7–13 Sep 2025, EPSC-DPS2025-1688, https://doi.org/10.5194/epsc-dps2025-1688, 2025.
Introduction
The next generation of lidar instruments will encompass the full waveform recording, allowing travel-time measurement of each emitted photon packet. This new information will allow finer characterization of planetary surface medium, either spaceborne, in-situ or in lab; for instance, the BepiColombo laser altimeter (BELA) (Thomas et al., 2021) will explore Mercury. We propose here a tool to simulate in-silico the travel-time inside the planetary medium and reconstruct the full waveform. It is a Monte-Carlo ray tracing algorithm called WARPE, for Waveform Analysis and Ray Profiling for Exploration (Barron et al, 2025).
Methods
We propose a Monte Carlo ray tracing approach based on the work from Farrell et al., 1992, Wang et al., 1995 and Gastellu-Etchegorry et al., 2016. Our model computes the position of the ray during its travel through the medium, including interactions at the interfaces. The main parameters are incidence (θ) and azimuthal angle (φ), the optical thickness (τ), the single scattering albedo (ω) the optical index (n,k) of the medium and the phase function (Henyey-Greenstein or isotropic). The efficient computation time of the model is guaranteed by ray batchs parallelization.
Validation
The validation of the model is a mandatory step to compute a consistent and physically correct simulation of the travel-time within a planetary surface. In the model, media can be either described as a semi-infinite granular layer or a homogeneous slab above a bedrock or regolith of albedo (A). The purpose here is to replicate the results from previous works such as Stamnes et al., 1988, Gautheron et al., 2024 and Kienle & Patterson 1997. We first computed the reflectance for a turbid medium with (figure 1) and without (figure 2) interfaces. We use the DISORT algorithm (Stamnes et al., 1988) and the model presented in Gautheron et al., 2024. Our simulations show a very good agreement, confirming the validity of WARPE for angular distribution. The Relative Root Mean Square Error (RRMSE) is ∼ 0.01 in most of cases, which is excellent and expected due to the stochastic nature of WARPE.
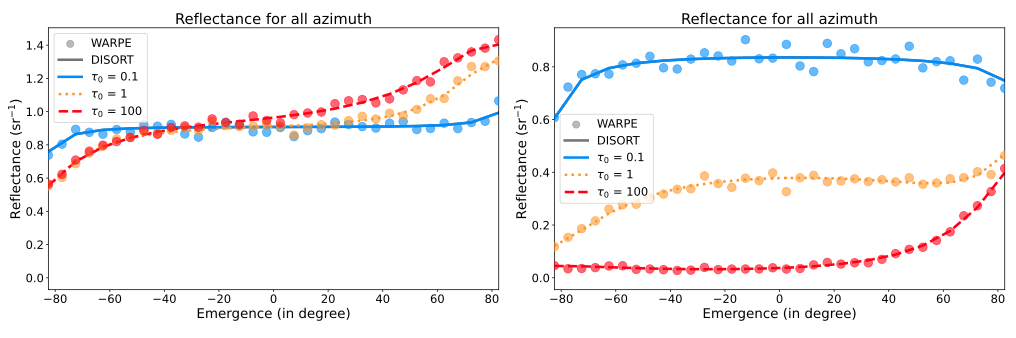
Figure 1: Reflectance of a turbid medium with WARPE (point) and DISORT (line) for θ = 50°. ω = 1, A = 0.9 (left), ω = 0.7, A = 0.9 (right). The diffusion is anisotropic following a 1-parameter Henyey-Greenstein phase function with g = 0.8.
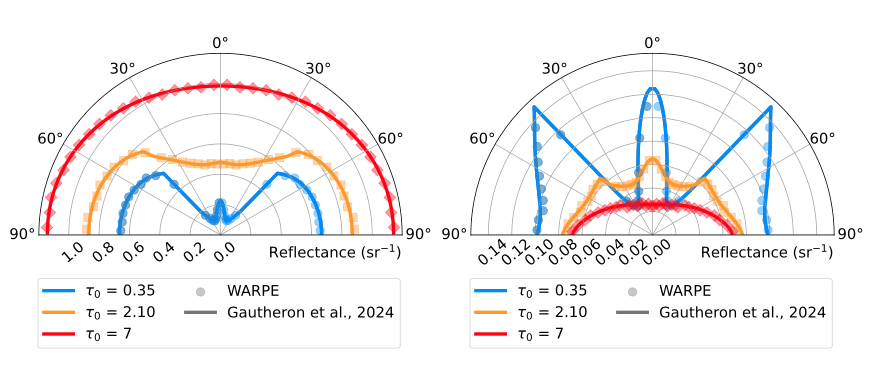
Figure 2: Reflectance from WARPE (points) and from the Gautheron et al., 2024 model (lines) within the medium at the top interface, as a function of emergence for with ω = 1 on the left and ω = 0.7 on the right, n = 1.5. The diffusion is anisotropic and follows a 1-parameter Henyey-Greenstein phase function (with g = 0.8).
We propose then a method to compute the trajectory and travel-time of rays in the medium, to simulate the response of a waveform lidar. Knowing the speed of light in the medium and assuming its constancy following medium’s optical properties, we then evaluate the time travel in comparison with the analytical solution from Kienle & Patterson, 1997. Results in Figure 3 shows a very good agreement that validates our algorithm.
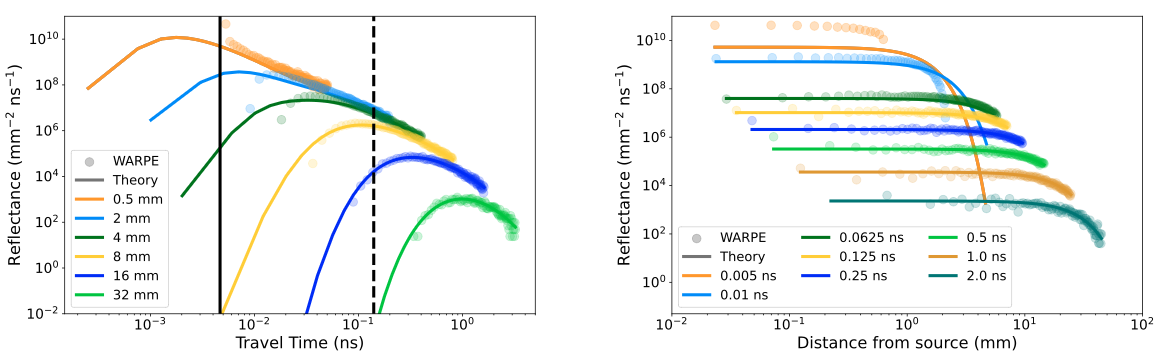
Figure 3: Reflectance in a compact medium from WARPE (point) and analytical model from Kienle & Patterson (1997) model (line); (left) as a function of travel-time at distance from the source; (right) as a function of distance from the source at different time. Parameters are τ = 60, n = 1.4 and k = 0, z0 = 0.995 mm and t0 = 4.67 ps. The diffusion is isotropic (g = 0), the approximation for the anisotropic diffusion being too imprecise in the Kienle analytical model. The full vertical line represents the travel-time at t0 = z0 /n to leave the medium in a straight path without interaction, when the source is at depth z0 . It is thus not physically possible that a travel-time shorter than this exists. Our model fulfills this condition, but the analytical solution does not. The dash vertical line represents the time from which WARPE and reference model reasonably agree (after ∼ 30t0 ).
Result
To illustrate the capabilities of WARPE, we simulate waveforms for different sets of parameters. We identified 4 main features: the top reflection corresponding to specular reflection, the back and forth direct represents rays unscattered in the medium but reflected 1/2/3… times in the bottom and top interfaces, the back and forth diffused represents the “pseudo-wave” of all scattered rays and finally the background scattering. Figure 4 shows the effect of the optical thickness and how the features are affected. We are now able to identify how the media properties will affect the response of a full waveform lidar.
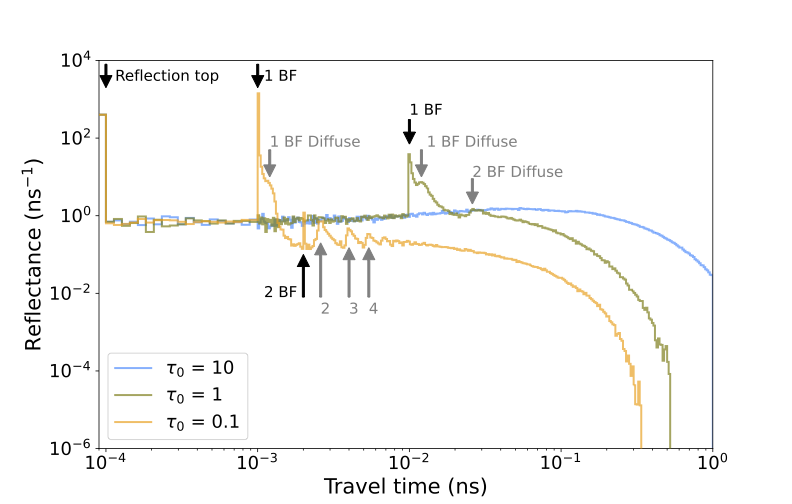
Figure 4: effect of the optical depth on the travel-time. Parameters θ = 0°, ω = 1, A = 0., n = 1.5, rand a Henyey-Greenstein phase function with a scattering anisotropy of g = 0.8, scattering coefficient is 1, absorption coefficient is 0. The physical thickness is 0.1 (orange) 1 (green) 10 (blue) mm. The back and forth direct (BF) and the back and forth diffuse (BF Diffuse) features are more visible when the medium is optically thin. For thicker medium the main feature tends to be the background scattering.
Conclusion and perspectives
We propose a new approach to efficiently simulate the travel-time of photons inside a planetary surface with both granular and compact texture. We conducted several tests to validate the approach and one simulation in realistic conditions. In the future, we will adapt this tool to peculiar planetary science cases, such as the mercury regolith for BELA, or the icy surface for GALA.
References
Barron et al. (2025) under review Journal of Quantitative Spectropy and Radiative Transfer
Farrell et al. (1992) Medical Physics
Gastellu-Etchegorry et al. (2016) Remote Sensing of Environment
Gautheron et al. (2024) Optics Express
Kienle et al. (1997) Journal of the Optical Society of America
Stamnes et al. (1988) Applied Optics
Thomas et al. (2021) Space Science Reviews
Wang et al. (1995) Computer Methods and Programs in Biomedicine
How to cite: Barron, J., Schmidt, F., and Andrieu, F.: WARPE: A new tool to simulate radiative transfer and travel-time to characterize planetary surfaces , EPSC-DPS Joint Meeting 2025, Helsinki, Finland, 7–13 Sep 2025, EPSC-DPS2025-307, https://doi.org/10.5194/epsc-dps2025-307, 2025.
Please decide on your access
Please use the buttons below to download the supplementary material or to visit the external website where the presentation is linked. Regarding the external link, please note that Copernicus Meetings cannot accept any liability for the content and the website you will visit.
Forward to presentation link
You are going to open an external link to the presentation as indicated by the authors. Copernicus Meetings cannot accept any liability for the content and the website you will visit.
We are sorry, but presentations are only available for users who registered for the conference. Thank you.
Introduction: Thermal emission appears in lunar reflectance spectra beyond ~2500 nm, where surface-emitted radiation becomes comparable to sunlight reflection [e.g., 1,2]. This thermal component distorts diagnostic absorption bands of minerals such as pyroxenes and spinel [e.g., 3] and can obscure spectral signatures of volatiles like hydroxyl and water (OH/H₂O). Several methods have been proposed to retrieve this component [e.g., 1,4–6]. Among them, the iterative procedure proposed by Clark et al. [4] is widely used and has been implemented in the Chandrayaan-1 M³ calibration pipeline [7]. The method assumes the lunar surface behaves as a gray body, with emissivity defined as 1 – R₀(λ), where R₀(λ) is the reflected solar fraction. However, R₀(λ) is geometry-dependent and not directly observed beyond 2500 nm, requiring a complex iterative approach to assess it with approximations before separating the thermal emission from the reflectance [4].
Method: Here, we explore an alternative approach for thermal emission removal from M³ data using a single-step subtraction of the thermal component [1,2]. Like previous methods, it is based on the graybody concept. However, it avoids empirical estimations of the reflected solar fraction by treating thermal emissivity in a different way. The first step is to define the forward model. The apparent albedo, obtained by dividing the measured radiance by the incident solar flux, can be expressed as follows:
Here, α, i, and e denote the phase, incidence, and emergence angles, with i and e depending on the local surface normal. Ar+e(λ) includes both reflected and emitted components; An(λ) is the reflectance at normal geometry, and F(α, i, e, λ) is the photometric function. Constants are LSun = 1.696×10¹¹ m, RSun = 6.96×10⁸ m, and C₂ = 1.44×10⁴ µm·K. Emissivity is defined as 1 − ε·An(λ), where ε·An(λ) is the hemispherical-directional albedo. The general expression for ε is (see Eq. 6.14 in [2])
where φ is the azimuthal angle. Finally, one can invert Eq. 1 with respect to An(λ) and obtain an expression for the normal albedo:


Data: To demonstrate the method, we applied it to M3 data from the Aristarchus crater (Frame ID: M3G20090612T060502) and the Reiner Gamma swirl (Frame ID: M3G20090613T032520), as shown in Fig. 1a. Due to the iterative nature of the original thermal correction [7], we began with level-1 data and performed solar normalization, thermal correction, and photometric correction to bring the data into the RELAB photometric system (30°, 0°, 30°). Whenever possible, we used original M3 calibration inputs, including the solar spectrum, digital terrain models, geometric angles, and the photometric function [7]. To isolate the effect of thermal correction, we retained the original surface temperature maps (Fig. 1b), although alternative temperature-estimation approaches also exist [e.g., 2,5]. For simplicity, we assume emissivity as 1 − An(λ), consistent with the original approach [4]. The factor ε = 1 follows from Eq. 2 if a Lambertian-like photometric function F(α, i, e, λ) = cos(e)cos(i) is used. This approximation neglects the subpixel-scale structure of the lunar surface, which will be addressed in future work. Lastly, we did not apply the thermal-polishing step from the original pipeline [7], as this correction multiplies the spectra by a coefficient close to one and generally has a negligible effect.
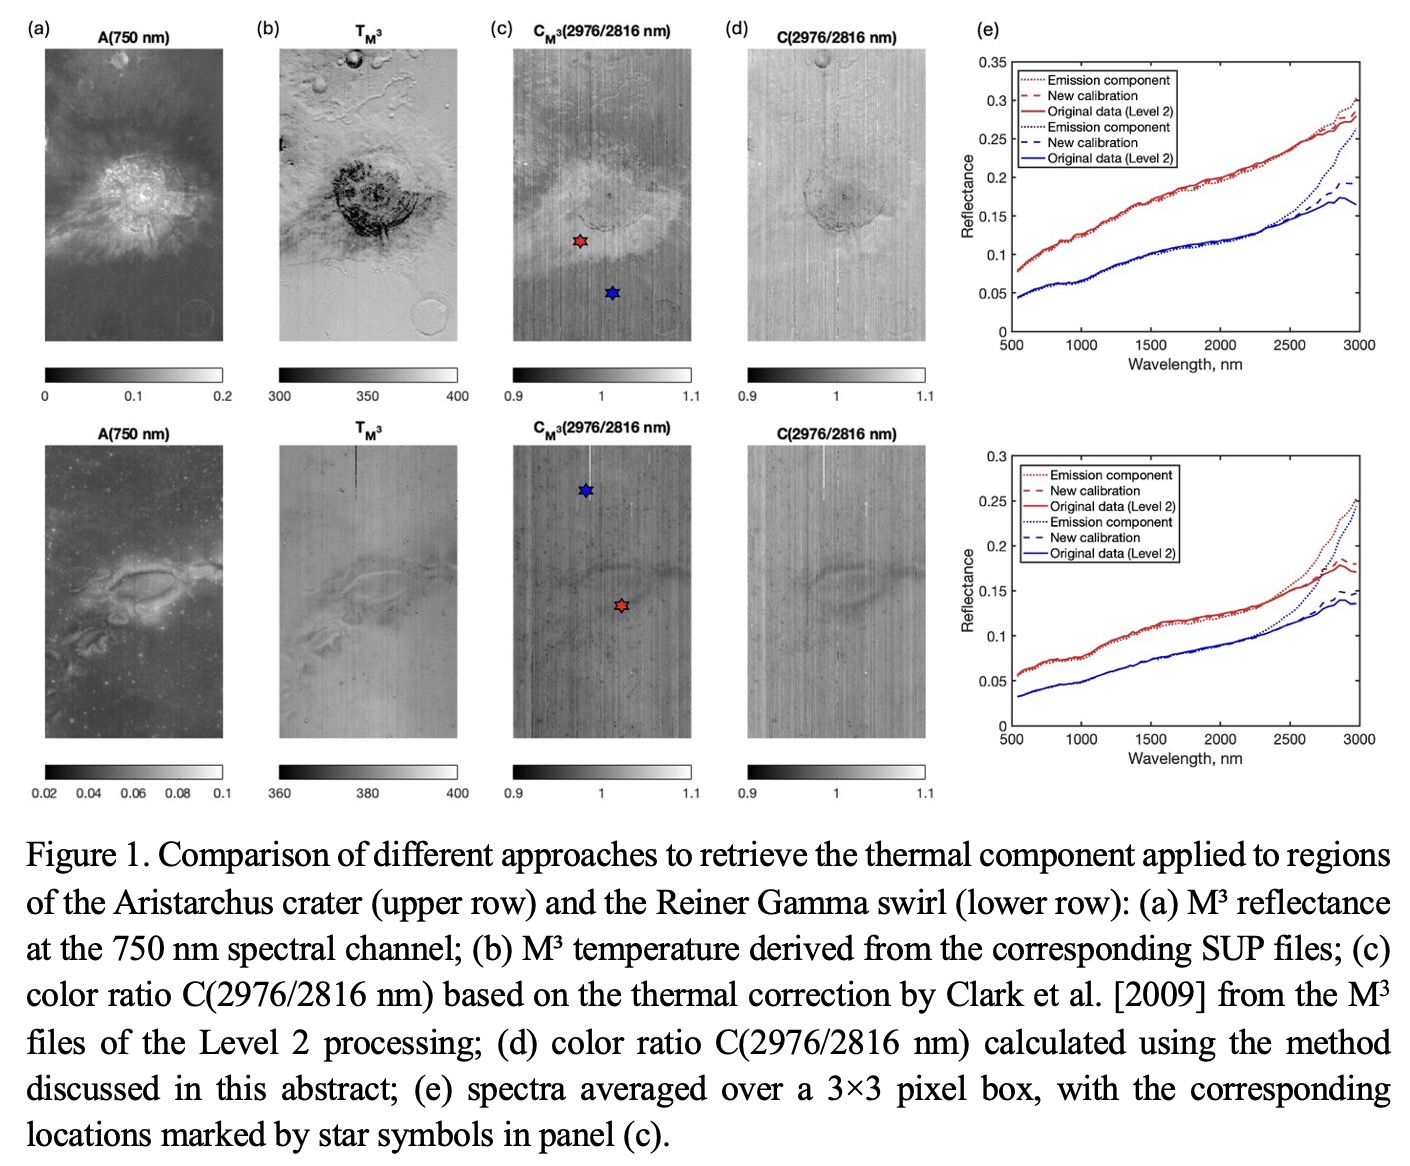
Results: Both frames were acquired at relatively small phase angles: 21.3° for the Aristarchus crater and 8° for Reiner Gamma, resulting in a notable thermal-emission component between 2700 and 2950 nm. The selected sites show significant reflectance differences, and the Aristarchus region also features strong temperature variations due to complex topography. This makes them suitable for testing the method by (1) mapping the color ratio C(2976/2816 nm) using both the original M3 reflectance data (Fig. 1c) and the proposed approach (Fig. 1d), and (2) comparing the spectra from selected locations (Fig. 1e).
As shown, the color ratio derived from the original M3 reflectance data generally correlates with albedo, except for several sites on the southern slope and the crater peak. In contrast, the ratio calculated using the proposed method appears smoother and nearly featureless. It shows similar values across bright ejecta, the moderately bright southern Aristarchus Plateau, and the darker surrounding mare basalts. The lower values observed at the crater walls, central peak, and nearby areas are more likely linked to surface immaturity than to compositional differences. Similar behavior is seen at various mare-highland boundaries across latitudes, although these cases are beyond the scope of this abstract.
Lunar swirls, high-albedo diffuse formations, are among the few features that consistently exhibit lower color-ratio values. In Fig. 1, the Reiner Gamma swirl serves as an example. Notably, the swirl’s reflectance remains significantly lower than that of the bright Aristarchus ejecta. Thus, while their higher albedo may account for slightly cooler surface temperatures, it does not fully explain the reduced color ratios. This effect may instead point to the swirls’ unique photometric or compositional properties, as suggested by previous studies [e.g., 8].
Conclusions and future work: A simplified single-step method for thermal emission removal from Chandrayaan-1 M³ data has been considered. The method avoids complex iterative calibration. Applied to the Aristarchus and Reiner Gamma regions, it produces smoother spectral color ratios that do not reveal clear correlation with the surface reflectance. Future work will refine emissivity modeling and temperature estimation using more sophisticated photometry. The method could also be applied to other hyperspectral datasets of airless Solar System bodies, such as the High-Resolution Volatiles and Minerals Moon Mapper (HVM3) onboard Lunar Trailblazer [9].
References:
[1] Y. Shkuratov, et al. PSS 59, 1326-1371 (2011). https://doi.org/10.1016/j.pss.2011.06.011
[2] Y. Shkuratov, G. Videen, V. Kaydash, Optics of the Moon. Elsevier (2025). https://doi.org/10.1016/C2018-0-03000-5
[3] Y. Surkov, et al. PSS 240, 105831 (2024). https://doi.org/10.1016/j.pss.2023.105831
[4] R. Clark, et al. JGR 116, E00G16. (2011) https://doi.org/10.1029/2010JE003751
[5] S. Li, R. Milliken. JGR Planets 121(10), 2081-2107 (2016). https://doi.org/10.1002/2016JE005035
[6] J. Banfield, et al. 47th LPSC, LPI, Houston, USA, 1594 (2016).
[7] S. Lundeen, et al (2011) http://pds-imaging.jpl.nasa.gov/data/m3/CH1M3_0004 /DOCUMENT/DPSIS.PDF.
[8] D. Domingue, et al. PSJ 5, 161 (2024). https://doi.org/10.3847/PSJ/ad2179
[9] D. Thompson, et al. 51st LPSC, LPI, Houston, USA, 2052 (2020).
How to cite: Surkov, Y., Shkuratov, Y., Penttilä, A., Muinonen, K., Björn, V., and Videen, G.: Untangling Heat: Retrieving the thermal component from Chandrayaan-1 M³ spectra, EPSC-DPS Joint Meeting 2025, Helsinki, Finland, 7–13 Sep 2025, EPSC-DPS2025-1000, https://doi.org/10.5194/epsc-dps2025-1000, 2025.
Motion-induced blur resulting from the high relative ground velocity between spacecraft and planetary bodies significantly deteriorates image quality, complicating detailed analyses of planetary surface features. Notable examples include Mars Express SRC images of Phobos, Viking Orbiter 2 VIS images of Deimos, and Rosetta OSIRIS images of comet 67P/Churyumov–Gerasimenko. To mitigate this issue, we implemented an image restoration method based on modeling the motion-induced point-spread function (PSF) and employing Wiener deconvolution to reverse the blur effects.
Our method was applied specifically to Super Resolution Channel (SRC) images acquired by the Mars Express High-Resolution Stereo Camera (HRSC) [1], which achieved unprecedented resolutions (<1.0 m/pixel) of the Phobos surface during orbit 5851 (23 July 2008) and orbit 8974 (9 January 2011) [2]. Despite their superior ground-sampling distance, these images had previously not been extensively utilized due to significant noise artifacts ("pepper" pixels) and severe motion blur [3], hindering geological interpretations and high-precision photogrammetric product generation (e.g., Ernst et al., 2023 [4]).
Our processing pipeline begins with Level 3 SRC images in PDS format. Noise artifacts are conventionally reduced using a boxcar filter implemented through the powerful USGS ISIS "noisefilter" function. Metadata (StartTime, StopTime, ImageTime, exposure, pixel size, focal length, CCD center coordinates) are extracted from ISIS cubes using the USGS Ale software. Given the very short exposure times (approximately 14 ms for orbit 5851 images and 16 ms for orbit 8974 images), the target's apparent motion on the focal plane during exposure can be accurately approximated as linear, differentiating this case from longer-duration sinusoidal jitter motions. We generated a linear PSF by computing spacecraft boresight intersections with the Phobos surface from SPK, CK, and DSK kernels (Ernst et al. 2023 Phobos shape model v02 NoOffset, ~9 m precision) via SpiceyPy [5]'s subpnt function. Wiener deconvolution was subsequently applied, utilizing an empirically determined optimal signal-to-noise ratio (SNR) of 16 dB, aligning closely with previous findings for SRC images (Oberst et al., 2006).
We successfully restored SRC images from orbit 5851 (h5851_0002_src3 to h5851_0004_src3; Figure 1) and orbit 8974 (h8974_0002_src3 to h8974_0008_src3; Figure 2), significantly reducing blur and enhancing geological feature visibility. Our pipeline establishes a robust and objective framework for future restoration and analysis of motion-blurred planetary imagery.
References
1. Neukum, G.; Jaumann, R. HRSC: The High Resolution Stereo Camera of Mars Express. In Mars Express: The Scientific Payload; ESA: 2004; Volume SP-1240, pp. 17-35.
2. Witasse, O.; Duxbury, T.; Chicarro, A.; Altobelli, N.; Andert, T.; Aronica, A.; Barabash, S.; Bertaux, J.L.; Bibring, J.P.; Cardesin-Moinelo, A.; et al. Mars Express investigations of Phobos and Deimos. Planetary and Space Science 2014, 102, 18-34, doi:10.1016/j.pss.2013.08.002.
3. Oberst, J.; Schwarz, G.; Behnke, T.; Hoffmann, H.; Matz, K.D.; Flohrer, J.; Hirsch, H.; Roatsch, T.; Scholten, F.; Hauber, E.; et al. The imaging performance of the SRC on Mars Express. Planetary and Space Science 2008, 56, 473-491, doi:10.1016/j.pss.2007.09.009.
4. Ernst, C.M.; Daly, R.T.; Gaskell, R.W.; Barnouin, O.S.; Nair, H.; Hyatt, B.A.; Al Asad, M.M.; Hoch, K.K.W. High-resolution shape models of Phobos and Deimos from stereophotoclinometry. Earth, Planets and Space 2023, 75, 103, doi:10.1186/s40623-023-01814-7.
5. Annex, A.M.; Pearson, B.; Seignovert, B.; Carcich, B.T.; Eichhorn, H.; Mapel, J.A.; Von Forstner, J.L.F.; McAuliffe, J.; Del Rio, J.D.; Berry, K.L. SpiceyPy: a Pythonic Wrapper for the SPICE Toolkit. Journal of Open Source Software 2020, 5, 2050, doi:10.21105/joss.02050.
Figures

Figure 1 SRC images of orbit 5851 before (top) and after (bottom) restoration

Figure 2 SRC images of orbit 8974 before (top) and after (bottom) restoration
How to cite: Hemmi, R. and Kikuchi, H.: Restoring high-speed motion blur in spacecraft imagery: Enhanced views of Mars' moon Phobos, EPSC-DPS Joint Meeting 2025, Helsinki, Finland, 7–13 Sep 2025, EPSC-DPS2025-193, https://doi.org/10.5194/epsc-dps2025-193, 2025.
Introduction
This study aims to improve the recognizability of objects (e.g., craters) in imaging data of the surfaces of celestial bodies acquired by JANUS (Jovis, Amorum ac Natorum Undique Scrutator), a two-dimensional spectral imaging camera on the JUpiter ICy moons Explorer (JUICE)1,2), a joint mission of the European Space Agency (ESA) and the Japan Aerospace Exploration Agency (JAXA).
JUICE was launched on April 14, 2023, and is scheduled to reach the Jupiter system in 2031. After multiple flybys of Jupiter, Ganymede, Europa, and Callisto until November 2034, it will perform an orbital observation of Ganymede. The mission is planned to conclude with a collision into Ganymede in 2035. The main scientific targets of JANUS are the geological and topographical features of these icy satellites, as well as phenomena such as lightning occurring in Jupiter’s upper atmosphere. Thus, the imaging data from JANUS covers a wide range of topics. And of course, its higher resolution data offers more advantages in planetary science studies. For example, in crater chronology, higher resolution allows for the identification of more craters, which ultimately enables more accurate model age determinations. Detailed crater morphology also contributes to understanding the impact process, timing, and the physical constraints of the impacted celestial body’s surface. However, due to constraints such as the spacecraft's altitude, the total amount of internal data storage, and the transmission data rate to the Earth, the resolution of the data acquired by JANUS will be strictly limited. This study, therefore, explores the possibility of improving the object recognizability by increasing the resolution in a pseudo manner for JANUS imaging data using frame overlap. The data from the August 2024 Moon and Earth flybys, which included overlapping frames obtained by JANUS, will be used for this experiment. The lunar imaging data, obtained by Japan’s SELENE e.g. 3) and the U.S. LRO e.g. 4) missions at high resolutions, will be compared to evaluate the potential for enhancing the JANUS data.
Methodology
JANUS is a two-dimensional imaging camera with 2000 x 1504 pixels (along track x across track) and a field of view of 1.72° x 1.29°1,2). The instantaneous field of view (IFOV) of each pixel is 15 μrad, which corresponds to 7.5 m/pixel when observed from an altitude of 500 km (e.g. during the Ganymede flyby). Depending on the operation, JANUS images can be captured in succession to create frame overlap. For this study, we used the overlapping frame data acquired during the JUICE Moon flyby in August 20241,2).
The image enhancement process follows the steps outlined below (see Fig. 1):
1) Sub-Pixel Interpolation: The first step is sub-pixel interpolation to enhance image resolution in a pseudo manner.
2) Image Registration: Image registration is performed using template matching at a sub-pixel level, where the difference in brightness values is minimized.
3) Stacking and Normalization: The aligned overlapping images are stacked, and the radiance values are averaged to normalize the result.
The resulting "processed image" will be compared with high-resolution images from SELENE and LRO to assess the degree of enhancement achieved.

Sub-pixel interpolation will be performed using the Awesome Sindones (AS) processing. This method aims to reduce or remove mosaic artifacts that occur during image enlargement, and is expected to improve the recognizability of features such as shape and texture that are difficult to identify in the original image.
The key features of the AS processing are as follows:
- It is a quick and easy processing.
- It is reversible, meaning the original image can be reconstructed.
- It can significantly reduce mosaic artifacts with repeated applications.
- It enhances edges such as object contours.
Among these features, the reversibility of AS processing is particularly important because it allows other researchers to convert the AS processed data back to the original images and apply different preprocessing methods separately. This is not possible with traditional interpolation methods such as bilinear or cubic convolution.
Results
We present the results of our attempt to process panchromatic data (footprints #50-#60; see Fig. 2) obtained during the JANUS lunar flyby and improve the recognizability of lunar craters. These data were taken on the lunar surface at approximately 9°S and 66°E. Sample images (footprints #61-#63, see Fig. 3) are shown in the figure (filter: FPAN, pixel scale: 18.7-18.9 m/pixel). Comparing the original data with the processed images, we can see that the edges of some craters are enhanced in the processed images, making the details more clearly visible (Fig. 4). Furthermore, comparing the results of the AS method with other interpolation methods (bilinear and cubic convolution methods), we can see that the AS processing enhances edges more effectively, making craters easier to identify (Fig. 5).


Conclusion
Higher resolution image data of celestial surfaces obtained by spacecraft is desirable to obtain more scientific information. However, it is limited by various constraints. We have demonstrated that applying image processing techniques such as subpixel matching to panchromatic overlapping frame data obtained by JANUS during the JUICE Moon flyby in August 2024 can improve the resolution in a pseudo manner, and for example, significantly improve the recognizability of craters. In particular, Awesome Sindones (AS) processing was effective as a pre-processing step for subpixelization. Unlike conventional interpolation methods (e.g. bilinear and cubic convolution), AS processing is reversible, which is an important advantage. Future research will also explore the possibility of improving the recognizability of observed objects with other types of data, such as JANUS non-panchromatic filtered and compressed image data.
References
1) Palumbo, P. et al. Space Sci. Rev. 221(32), 2025. 2), Lucchettii, A. et al. EPSC, 2025, 3) Haruyama, J. et al. Earth Planets Space 60 (4), 243-256, 2008, 4) Robinson, M. S. et al. Space Sci Rev. 15, 81–124, 2010.
How to cite: Haruyama, J., Nagasaka, S., Takahashi, Y., Sato, M., Shoji, D., Nozawa, H., Aboudan, A., Agostini, L., Kersten, E., Matz, K. D., Penasa, L., Politi, R., Trauthan, F., Tubiana, C., Zinzi, A., Palumbo, P., Portyankina, G., Roatsch, T., Lala, L. M., and Patel, M. P. and the JANUS team: Improving the Recognizability of Objects on Celestial Surfaces Using Overlap between Imaging Frames from JANUS onboard JUICE, EPSC-DPS Joint Meeting 2025, Helsinki, Finland, 7–13 Sep 2025, EPSC-DPS2025-241, https://doi.org/10.5194/epsc-dps2025-241, 2025.
Ceres, the largest object in the Main Asteroid Belt, is a crucial target for astrobiological research due to its complex surface composition, characterized by dark, carbon-rich materials, phyllosilicates, carbonates, and localized organics [1] [2] [3]. Previous discoveries of aliphatic organics in the Ernutet region [4] motivated a search for new organic-rich areas. Recent Framing Camera analyses identified bright areas within the Yalode crater (BS1, BS2 and BS3 in Fig. 1) characterized by a red spectral slope, typical of organic-rich regions [5]. This study focuses on detailed spectroscopic characterization of these areas using Dawn’s VIR spectrometer data covering VIS and IR wavelengths from 0.25-1 µm to 1-5 µm [6].
Pixels of the hyperspectral VIR cubes were selected based on specific spectral criteria that can highlight the organic content. Three indicators were computed: 1) Band Depth (BD) around 3.4 µm, associated with C-H stretching absorptions characteristic of organic compounds; 2) Band Area (BA) around 3.4 µm, integrated to provide a robust measure of absorption strength [7]; 3) Spectral Slope (SL) between 1.0 and 1.4 µm, as a proxy for the red slope typically observed in organic-rich spectra [8]. Pixels exceeding a threshold value for these parameters were selected for further analysis. In Fig. 2 we show the distribution of these parameters for the BS1 spot. Spectral analysis revealed that all three bright spots exhibit strong absorption features around 3.4 µm, consistent with the presence of organic compounds. Additionally, a strong absorption near 3.9 µm, typical of carbonates, was also detected (Fig. 3). Carbonates exhibit an absorption feature near 3.4 µm, which overlaps with the characteristic absorption of organic materials in the same spectral region. This spectral overlap complicates the interpretation of the 3.4 µm band, making it challenging to discern whether the observed feature is attributable to carbonates, or if it also indicates the presence of organics.
Since the two VIR channels do not operate simultaneously [6], in the lasts orbital phases, to reconstruct a continuous spectral profile across the VIS and IR ranges, we applied a bridging procedure, excluding spectral regions heavily affected by noise around 1 µm. Thermal emission, significant beyond ~3.2 µm, was removed by modeling a Planck function based on an effective surface temperature and emissivity parameterization [9].
Spectral modeling of the reflectance data was performed using Hapke’s radiative transfer theory [10]. We assumed an intimate mixture model, where the single scattering albedo (SSA) of the surface was represented as a weighted sum of the SSAs of different endmembers. The selected endmembers were: Magnetite as a darkening agent [11], Carbonaceous Chondrite MAC 87300 as a primitive exogenous material, NH4-Montmorillonite and heated Antigorite as phyllosilicates, Dolomite and Siderite as carbonates, all taken from RELAB dataset, and Semianthracite as a spectral analog for complex aromatic organic matter [12] [13]. The model included free parameters: Abundances and grain sizes of each component, a multiplicative scaling factor to account for photometric uncertainties, an artificial spectral slope term to correct residual instrumental effects [14], the surface temperature and emissivity factor to refine the thermal correction [15]. The best fit was determined by minimizing the reduced chi-square value using a Levenberg-Marquardt optimization algorithm [7].
Spectral modeling consistently required the inclusion of siderite (Fe-carbonate) and an aromatic organic component analogous to semianthracite to satisfactorily reproduce the observed features (Fig. 4). The bright areas in Yalode crater are characterized by a notable presence of both siderite and complex, likely aromatic, organic material. These signatures distinguish them from previously analyzed regions on Ceres, like Ernutet, where predominantly aliphatic organics were detected [4]. The identification of siderite supports the hypothesis of pervasive aqueous alteration on Ceres [16], under specific chemical conditions favoring Fe-carbonate formation. The detection of semianthracite-like organic material indicates a more evolved or differently processed organic component compared to earlier discoveries of aliphatic compounds. This could reflect longer exposure to space weathering, different thermal histories, or distinct sources of organic matter.
These results highlight the chemical and mineralogical complexity of Ceres' surface. Future studies integrating laboratory measurements of organic spectral analogs, improved modeling, and global mapping of organics across Ceres’ surface could be the key to understanding the origin and evolution of organic material on Ceres.
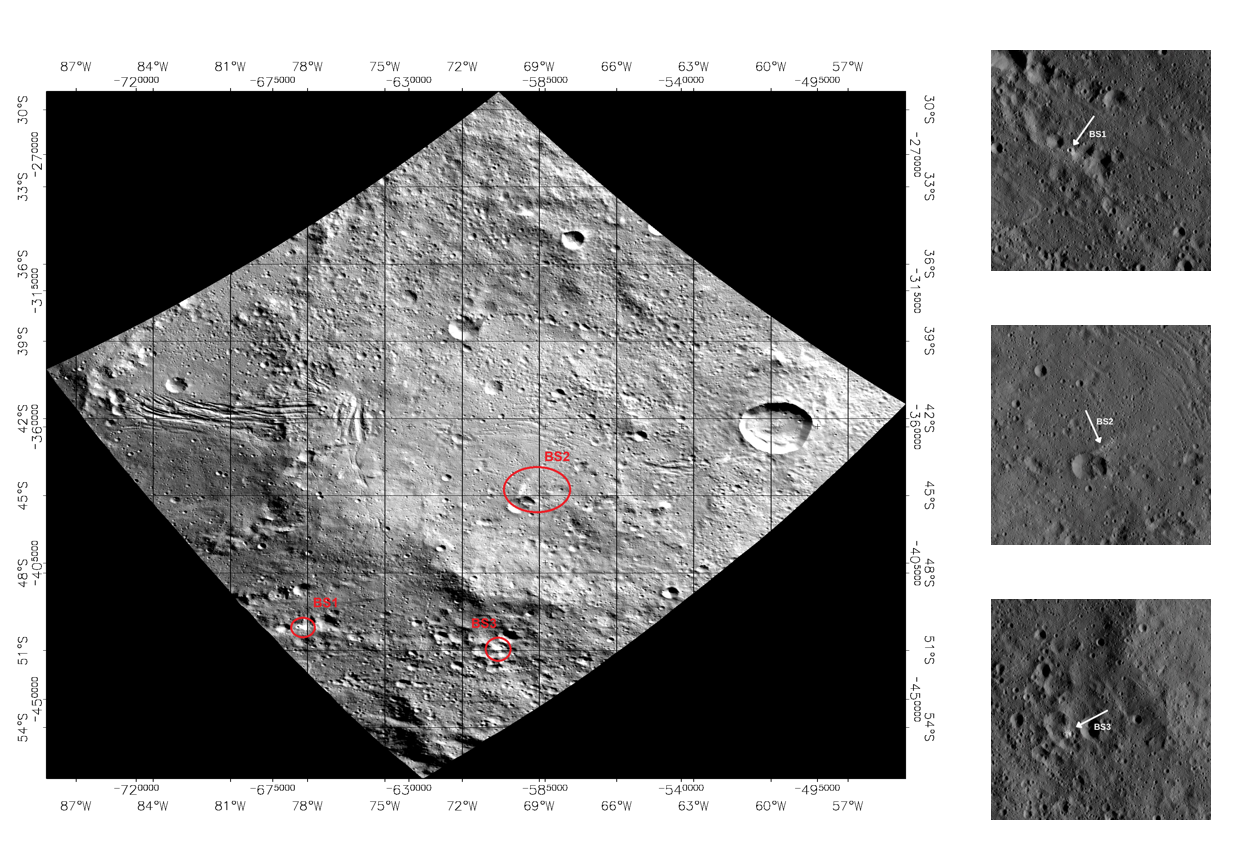
Figure 1. Projected FC image of bright spots located in Yalode crater and indicated by [5] as potentially hosting organics: BS1 (50 °S-78.35 °W), BS2 (44.7 °S-69.7 °W), BS3 (50.9 °S-70.7 °W).
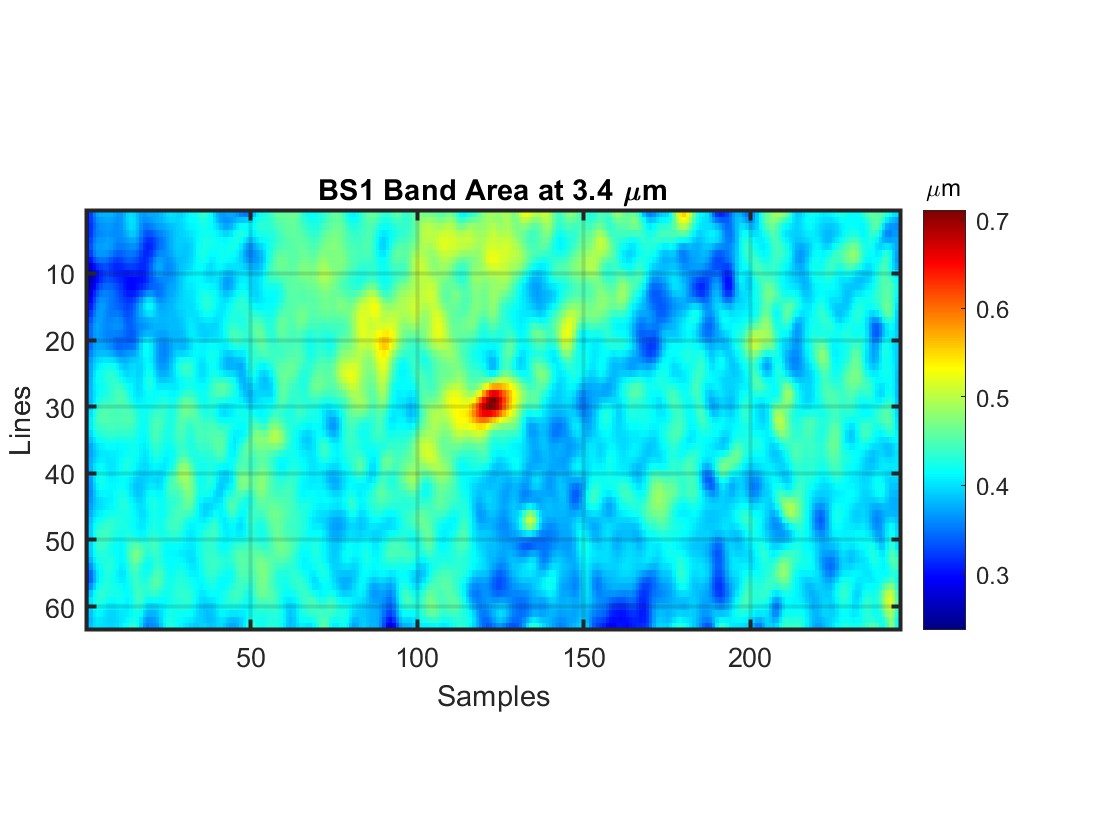
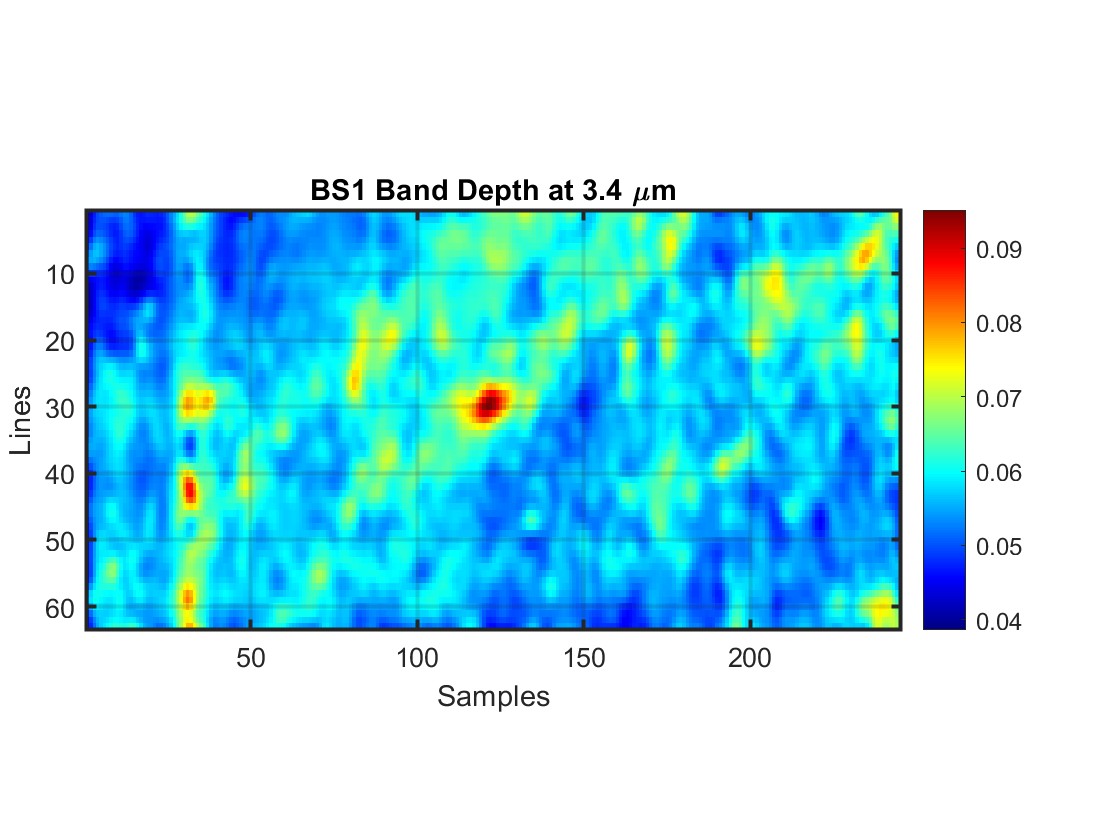
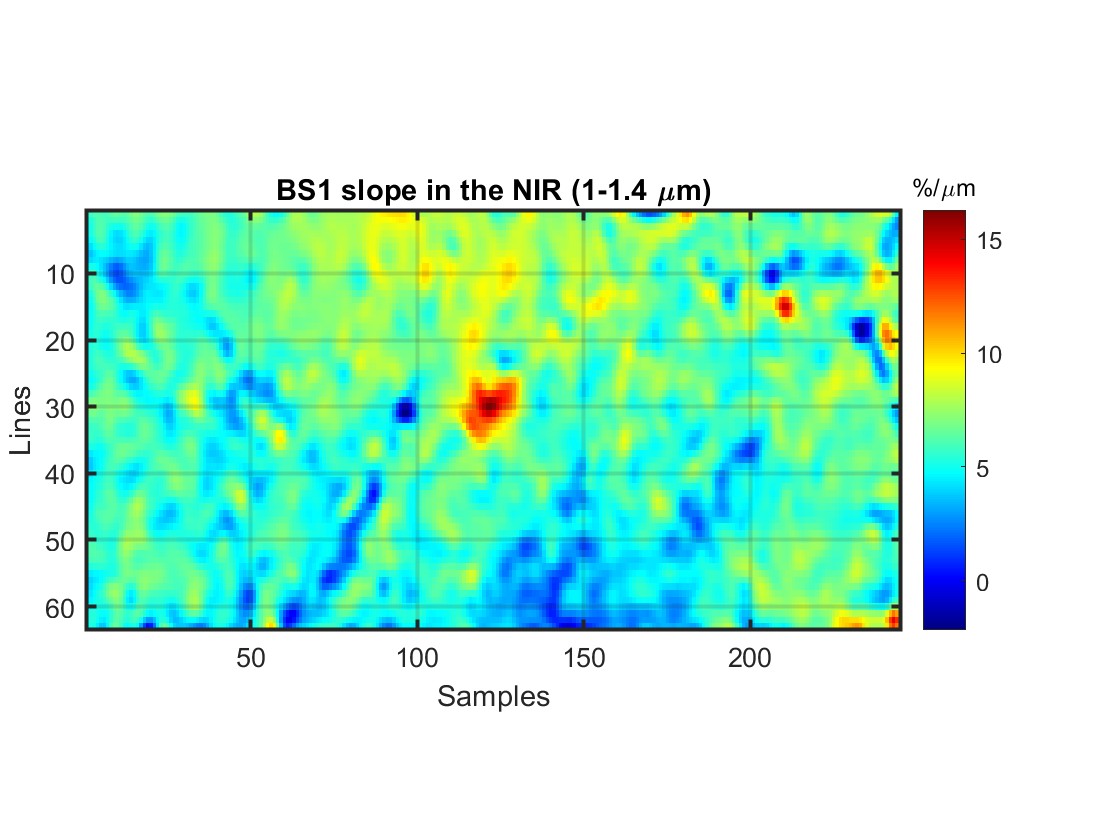
Figure 2. For BS1 from left to right: Band Area and Band Depth distribution calculated at around 3.4 𝜇m. Slope calculated from 1 to 1.4 𝜇m. The points colored in red have the highest values of the three spectral indicators and are the pixels chosen for the analysis.
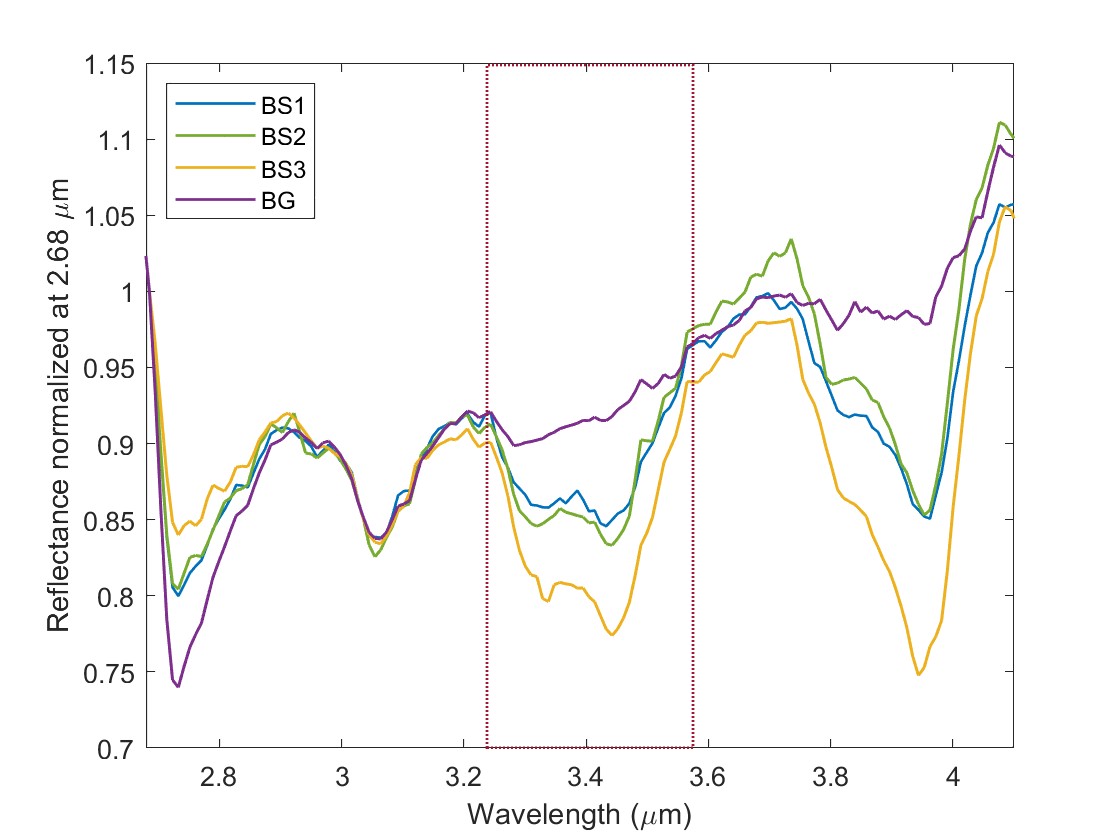
Figure 3. Comparison between background (BG), BS1, BS2 and BS3 spectra in the IR range. Mean spectra of the areas are normalized at 2.68 𝜇m.
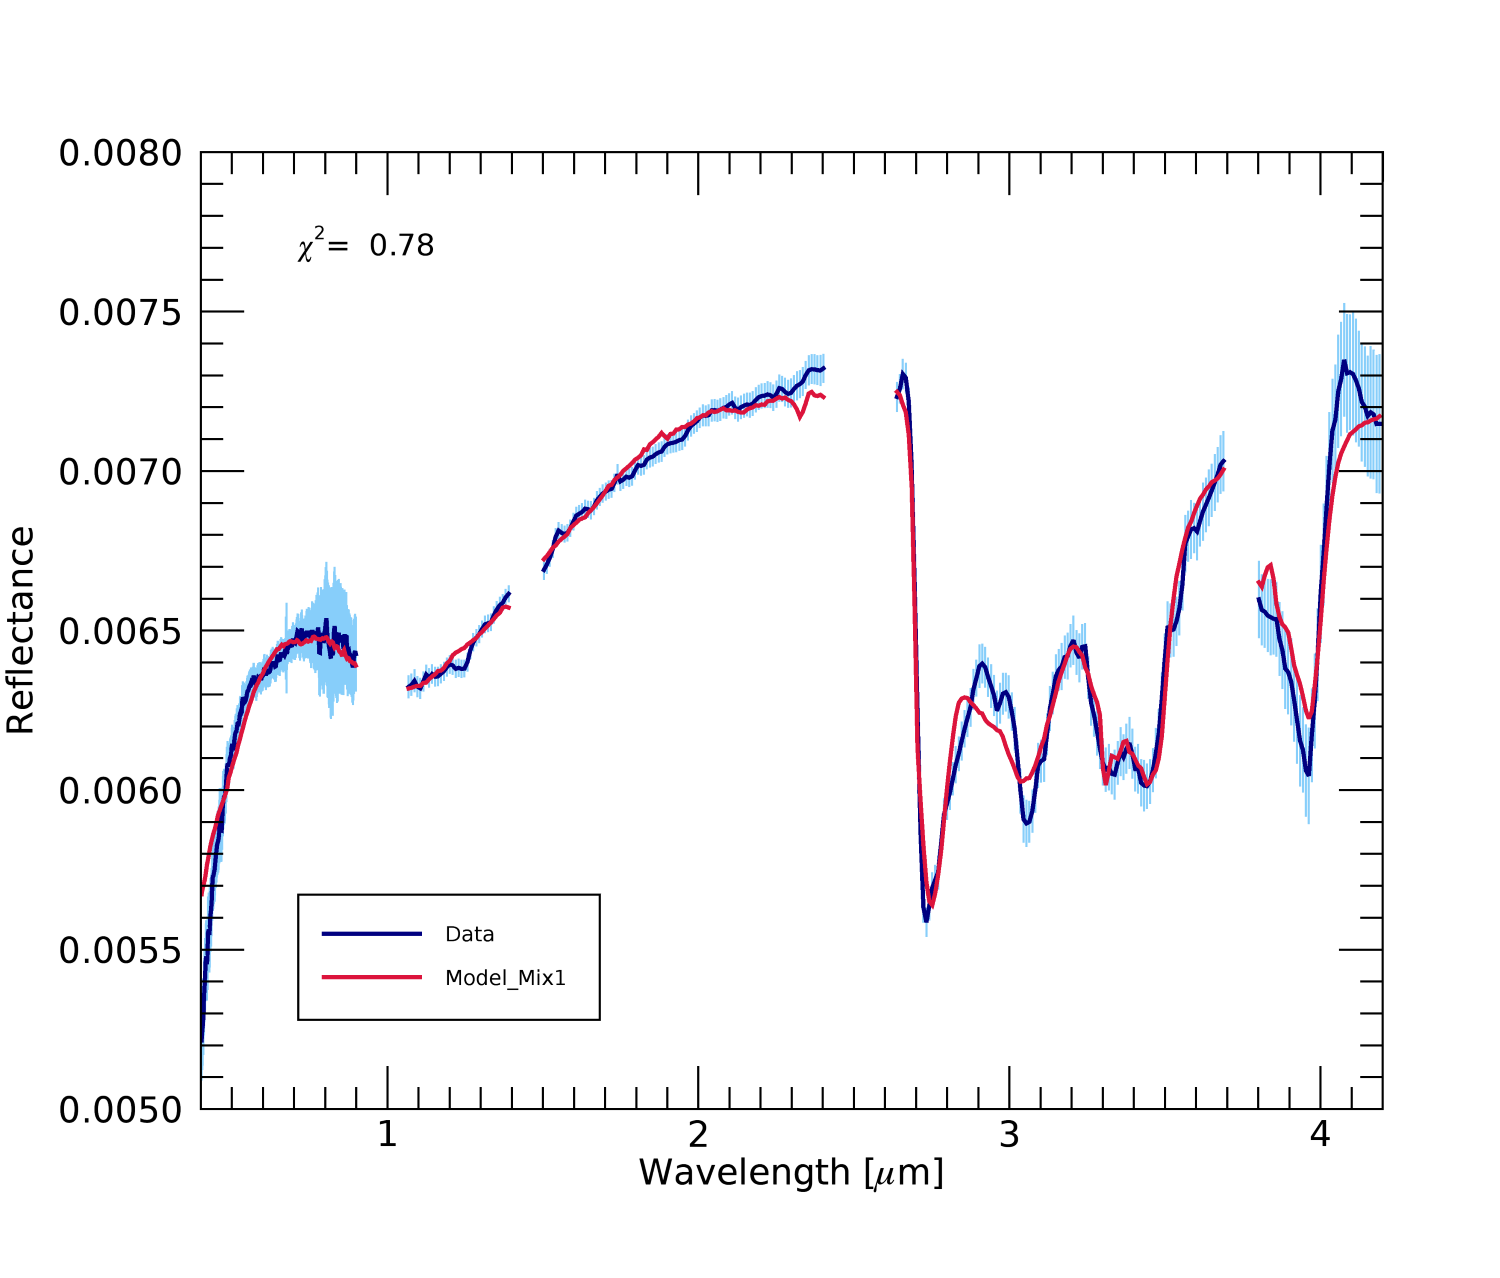
Figure 4. Best fit result for BS1. Data in blue, simulated spectrum in red.
References
[1] Marchi et al. Nature Astonomy 3, 140-145 (2019).
[2] Ammanito et al. Science 353 (2016).
[3] Russell et al. Science 353, 1008-1010 (2016).
[4] De Sanctis et al. Science 355, 719-722 (2017).
[5] Rizos et al. LPI Contributions 2851, 2056 (2023).
[6] De Sanctis et al. Space Science Reviews 163, 329–369 (2011).
[7] Raponi et al. Monthly Notices of the Royal Astronomical Society (2016).
[8] Rousseau et al. Astronomy & Astrophysics 642 (2020).
[9] Raponi et al. Icarus 320, 83-96 (2019).
[10] Hapke B. Cambridge University Press (2012).
[11] Querry Contractor Report (1985).
[12] Moroz et al. Icarus 134, 253–268 (1998).
[13] de Bergh et al. The Solar System Beyond Neptune, 483-506 (2008).
[14] Filacchione G. Institute of Space Astrophysics and Cosmic Physics (2006).
[15] Davidsson et al. Icarus 201, 335-357 (2009).
[16] De Sanctis et al. Nature 528, 241-244 (2015).
Acknowledgements: This work is supported by the INAF Large Grant "Nature and Evolution of the Organic Material on Ceres" (TERRAE).
How to cite: D'Urzo, S., Raponi, A., and De Sanctis, M. C.: Possible Detection of Fe-Carbonates and Complex Organics in Bright Areas of the Yalode Crater on Ceres, EPSC-DPS Joint Meeting 2025, Helsinki, Finland, 7–13 Sep 2025, EPSC-DPS2025-352, https://doi.org/10.5194/epsc-dps2025-352, 2025.
Introduction
Exposed to the harsh space environment, the surface of dwarf planet Ceres is gradually altered due to space weathering. Dawn mission’s investigation reveals that the geologically young impact craters on Ceres exhibit spectrally blue-sloped materials, while the old terrains are spectrally red-sloped, suggesting a possible reddening effect by space weathering [1, 2]. However, the mechanism for the slope variation remains a subject of discussions [3, 4]. Here, we present the evidence of optical effects of space weathering on Ceres based on the spectral observations from Dawn mission.
Data and Methods
The Dawn spacecraft mapped the surface composition of Ceres with its Framing Camera (FC), Visual and Infrared Spectrometer (VIR), and Gamma Ray and Neutron Detector (GRaND) [5]. Here, we calculated the 965/438 nm value to characterize the visible/near-infrared (VNIR) slope variation with the FC data. To identify the weak spectral variations of the widespread ~2.7 μm absorption feature in the VIR data, we performed Gaussian fit to improve the sensitivity.
Results and discussion
The 2.7 μm absorption center shift due to space weathering: the narrow ~2.7 μm absorption band is attributed to the stretching vibration of O-H [6], centered at 2.728-2.730 μm for most of Ceres’ surfaces. However, some regions have the band center at 2.723-725 μm, shifted shortward by ~5 nm compared to the nearby regions (Fig 1b and 1e). The spectral ratio confirms the variation in the 2.7 μm absorption center (Fig 1c and 1f). These “blue shifted” regions are mainly distributed on the walls of some young and/or small craters, some of which were interpreted as being associated with slumping materials, such as in Haulani crater [2].
The observed 2.7 μm band center variations could be linked to the differences in phase angle [7], surface composition [8], and space weathering [9, 10]. The observational geometry variations were eliminated with photometric correction for VIR data. Previous studies show that the OH stretching band center varies with the Mg/(Mg+Fe): the substitution of Mg by Fe in phyllosilicates causes the band center to shift towards longer wavelengths [8]. If the observed band center variations are attributed to the heterogeneous composition between surface and subsurface materials, the similar wavelength shift should also occur in the crater floor and ejecta regions, which is not noticed. Therefore, the most likely explanation for the observed wavelength shift is space weathering. Several laboratory studies showed that space weathering could induce the 2.7 μm band center shift towards longer wavelengths [9, 10], and such a shift is compatible with what we observed on Ceres. In addition, the “blue shifted” regions always correlate with the relatively steep regions, which favors mass wasting to expose the less weathered materials underneath.
Implication for the spectral slope variation: for those regions with 2.7 μm absorption centered at relatively short wavelengths, presumably representing relatively fresh materials, the band center shows a correlation with the spectral slope (Fig 2). This suggests that the freshest Ceres’ materials may exhibit a relatively red slope in VINR, and initially, gradually become bluer due to space weathering. Afterwards, the shift of 2.7 μm band center stops at ~2.728-2.730 μm, while the VNIR slope continues to evolve from blue to red with surface exposure age, consistent with previous observations [1, 2]. These observations suggest that the effect of space weathering on the spectral slope of Ceres’ surface materials may be not monotonically from blue to red. Instead, freshly exposed surfaces initially become bluer at a short time scale, then the bluish materials are weathered into reddish materials. Further investigations will constrain other potential factors that may affect the VNIR slope, and make comparisons with laboratory and/or orbital observations of other objects to reveal the mechanisms of space weathering on Ceres.
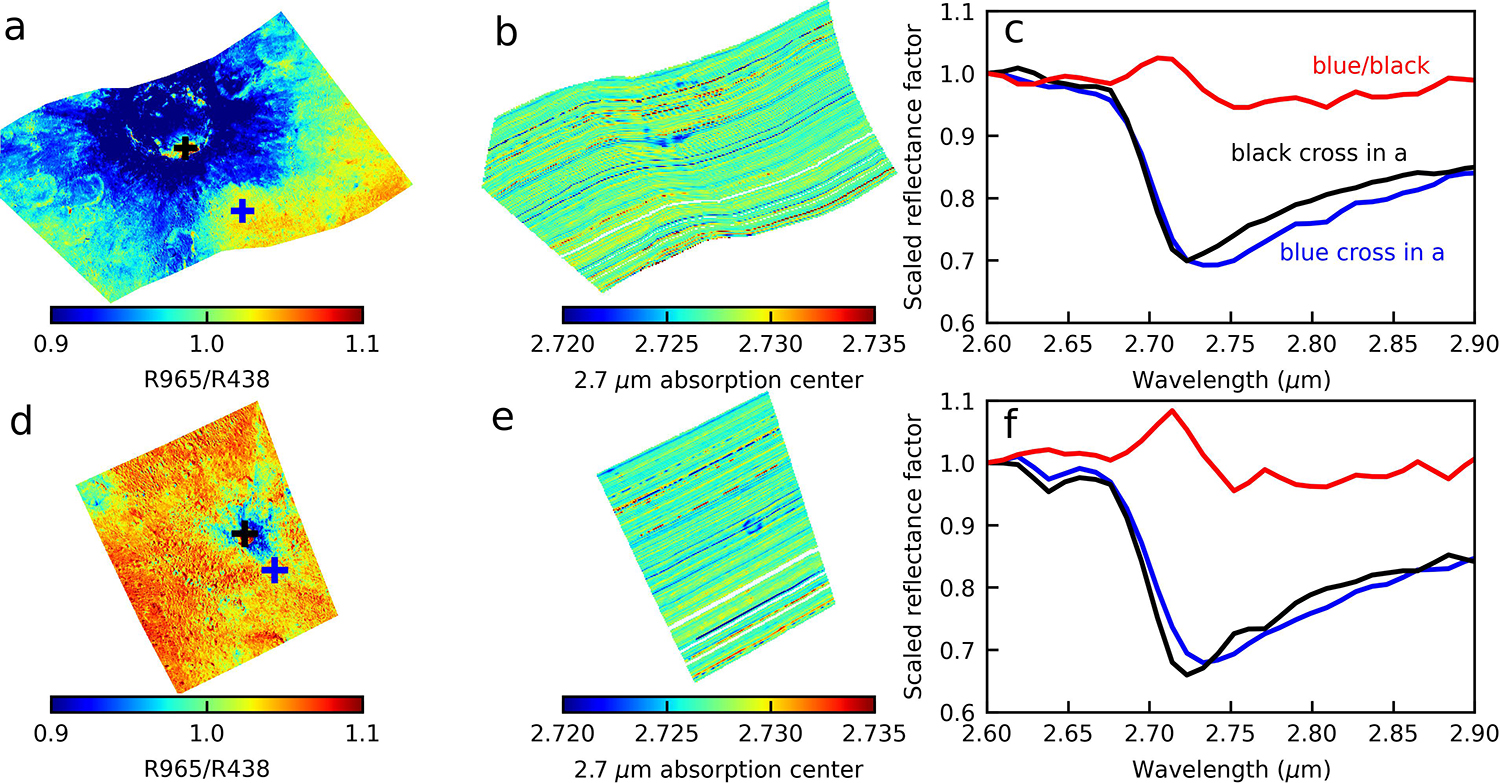
Fig.1 (a) and (b) are visible/near-infrared slope and 2.7 μm absorption center maps of Haulani crater, respectively. (c) Example spectra of absorption center at a shorter wavelength (black) and at a longer wavelength (blue) and their ratio (red). (d), (e) and (f) are another example in Braciaca crater region.
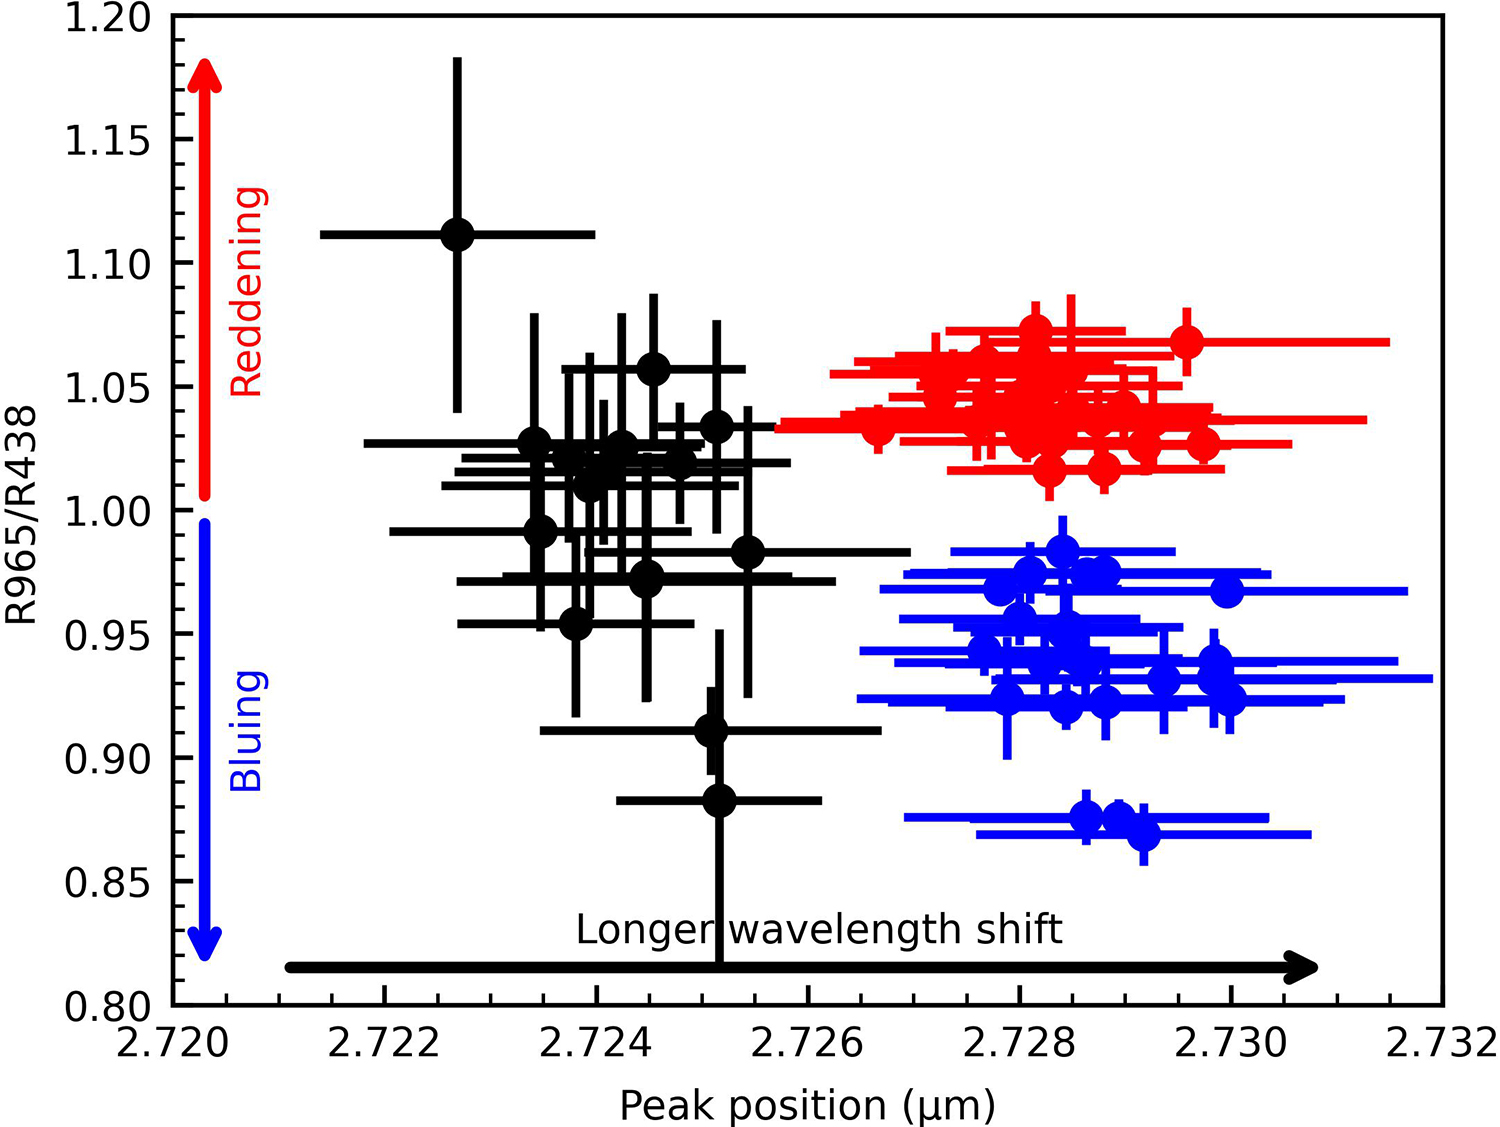
Fig.2 Measured absorption center of 2.7 μm band versus VNIR slope. The black scattered symbols mark the regions with 2.7 μm absorption center at shorter wavelengths. The blue symbols mark those with the 2.7 μm absorption centered at longer wavelengths and the 965/438 nm ratio less than 1. The red symbols mark those with the 2.7 μm absorption centered at longer wavelengths and the 965/438 nm ratio greater than 1.
References. [1] Nathues, A., et al. (2016). PSS, 134, 122-127. [2] Schmedemann, et al. (2016). GRL, 43(23), 11-987. [3] Stephan, K., et al. (2017). GRL, 44(4), 1660-1668. [4] Schröder, S. E., et al. (2021). Nature Communications, 12(1), 274. [5] Russell, C.T., and Raymond, C.A. (2011). Space Sci Rev, 163, 3–23. [6] Ammannito, E., et al. (2016). Science, 353(6303), aaf4279. [7] Rubino, S., et al. (2022). Icarus, 376, 114887. [8] Bishop, J. L., et al. (2008). Clay minerals, 43(1), 35-54. [9] Lantz, C., et al. (2015). Astronomy & Astrophysics, 577, A41. [10] Le Pivert-Jolivet, et al. (2023). Nature Astronomy, 7(12), 1445-1453.
How to cite: Zhang, Q. and Li, J.-Y.: Space weathering on Ceres: insight from Dawn’s spectral analysis, EPSC-DPS Joint Meeting 2025, Helsinki, Finland, 7–13 Sep 2025, EPSC-DPS2025-570, https://doi.org/10.5194/epsc-dps2025-570, 2025.
- Background and Data
Spectroscopy provides key insights into planetary surfaces. The differences observed among remote sensing, in situ, and sample-based measurements highlight the need to integrate multiple approaches for accurate understanding of airless body surfaces.
The Visible and Near-Infrared Imaging Spectrometer (VNIS) onboard the CE-3 and CE-4 rovers. Mounted 0.69 m above the surface at a 45° angle, it captures high-resolution spectra over a trapezoidal field of view.
The CE-5 mission collected two types of samples, namely, surficial and subsurface samples through scooping and drilling, respectively. Two samples of 200 mg each were allocated to us by the China National Space Administration. Sample 0600 represents the scooped surficial soils, while sample 0906 represents the drilled subsurface soils from a depth of approximately 10 cm.
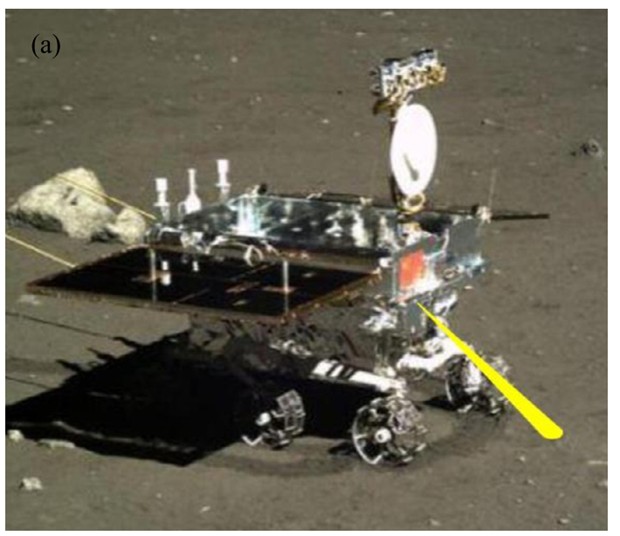
Fig.1 Schematic of detection by VNIS. Looking at the ground.
- Results
Figure 2 shows that the brightness of the CE-3 landing site increased after the spacecraft landed. The brightness increase of the disturbed regolith was found for all the landing sites (e.g., Clegg et al. 2014). Smoothing of surface roughness has been suggested as the main cause of the observed increase in reflectance (Kaydash et al. 2011; Shkuratov et al. 2013; Clegg et al. 2014). Exposure of less mature soil was rejected in these studies. However, as shown in Fig.3, the reflectance, OMAT and band depth of Site 8 are the lowest; while the reflectance, band depth, and OMAT of Site 5 are the largest. Site 5 has been disturbed by rocket exhaust while Site 8 is undisturbed pristine (Fig. 2). It indicates that the topmost surface is more weathered, and rocket exhaust blows away the finest and most weathered dust. Brightness changes are related to the reduction in maturity due to the removal of the fine and weathered particles by the lander’s rocket exhaust, not the smoothing of the surface.
The VNIS instrument, despite its relatively short wavelength coverage, detects thermal emission. Spectral upturns show no correlation with regolith maturity but correlated with solar incidence angle (Fig. 3). The CE-4 in situ spectra also show similar character (Wu et al., 2021). We developed a Monte Carlo method to derive emissivity and temperature, and found that temperatures derived from VNIS data are higher than temperatures predicted by a radiative equilibrium model. This indicates that the uppermost surface layer has low thermal inertia and the effects of micro-scale roughness (Wu and Hapke, 2018; Wu et al., 2021).
Canonical opinion believed that space weathering increases the spectral slope in the VIS and NIR (Lucey et al. 1998; Hapke 2001; Noble et al. 2001), such that the 415/750 nm ratio of becomes smaller with increasing maturity. The in situ spectra show the effects on the spectral slope caused by space weathering are wavelength dependent: increasing the visible and near infrared slope while decreasing the visible slope (Wu et al., 2019). The optical effects of space weathering and TiO2 are identical: both reduce albedo and blue the spectra. This suggests that a new TiO2 abundance algorithm is needed.

Fig.2. Locations of the four spectral measurements (numbered 5 to 8) of CE-3 rover.

Fig.3 Comparison of the reflectance from VNIS sites 5, 6, 7, and 8 normalized to (30◦, 0◦, 30◦).
Figure 4 shows that both the reflectance and absorption depth of CE-5 soil is significantly higher than that of the orbital remote sensing spectra (Wu et al., 2024). The Is/FeO values of CE-5 0600 and 0906 samples are 62 and 46, respectively, much lower than the value of 102 derived from remote sensing data. This indicates that samples are fresher and couldn’t represent pristine/true lunar surface.
The greatest uncertainties in TiO2 prediction are young basalts because Apollo missions only sampled old basalts. The CE-5 samples provide a ground truth for establishing the correlation between UV-vis color and TiO2 content in young basalts, enhancing the accuracy of TiO2 content mapping. The CE-5 samples provide an anchor on the sigmoidal trend for late-stage basalts, which have the largest uncertainties in TiO2 estimation.

Fig.4 Laboratory reflectance spectra and remote sensing data.

Fig.5 TiO2 versus 415/750 ratio for CE-5 soils and LSCC mare bulk soils.
- Conclusions
This study compares in situ spectral data, lunar sample spectra, and remote sensing spectra. Remote sensing spectra are significantly darker with shallower absorptions, indicating highly weathered nature of the undisturbed lunar surface. A spectral upturn beyond 2 μm is attributed to thermal emission, revealing low thermal inertia and micro-scale temperature variations. CE-5 samples exhibit higher reflectance and absorption depths, suggesting they are fresher and not fully representative of the pristine surface. These samples serve as a new benchmark for estimating TiO₂ in young basalts. Notably, CE-3 in situ data reveal that space weathering reduces the visible slope, contradicting the traditional view that it increases. Since both space weathering and TiO₂ lower albedo and blue the spectra, a revised TiO₂ abundance algorithm is required.
- References
Clegg, R. N., Jolliff, B. L., Robinson, M. S., Hapke, B. W., & Plescia, J. B. (2014). Effects of rocket exhaust on lunar soil reflectance properties. Icarus.
Gillis, J. J., Jolliff, B. L., & Elphic, R. C. (2003). A revised algorithm for calculating TiO₂ from Clementine UVVIS data. J. Geophys. Res. Planets.
Hapke, B. (2001). Space weathering from Mercury to the asteroid belt. J. Geophys. Res. Planets.
Kaydash, V., Shkuratov, Y., Korokhin, V., & Videen, G. (2011). Photometric anomalies at Apollo sites seen by LRO. Icarus.
Lucey, P. G., Blewett, D. T., & Hawke, B. R. (1998). Mapping FeO and TiO₂ with multispectral imagery. J. Geophys. Res. Planets.
Pieters, C. M. et al. (2000). Space weathering on airless bodies. Meteorit. Planet. Sci.
Shkuratov, Y., Kaydash, V., Sysolyatina, X., Razim, A., & Videen, G. (2013). Engine jet traces from Soviet probes. Planet. Space Sci.
Wu, Y., & Hapke, B. (2018). Spectroscopic observations at the lunar surface. Earth Planet. Sci. Lett.
Wu, Y., Wang, Z., & Lu, Y. (2019). Space weathering from in situ detection. Res. Astron. Astrophys.
Wu, Y. et al. (2021). CE-4 spectra reveal surface thermophysical properties. Geophys. Res. Lett.
Wu, Y. Z. et al. (2024). Spectral results of CE-5 soils. Astron. Astrophys.
How to cite: Wu, Y., Chai, Y., and Jiao, H.: High-resolution spectroscopy of airless bodies:remote sensing, In situ and laboratory measurements, EPSC-DPS Joint Meeting 2025, Helsinki, Finland, 7–13 Sep 2025, EPSC-DPS2025-1449, https://doi.org/10.5194/epsc-dps2025-1449, 2025.
We present the ongoing effort to construct the catalog of Solar System Object (SSO) spectra obtained by the Spectro-Photometer for the History of the Universe, Epoch of Reionization, and Ices Explorer (SPHEREx). NASA's SPHEREx mission was successfully launched on March 11, 2025, and has begun conducting the first all-sky spectral survey in the 0.75–5.0 µm range, with R = 41 to 135 (see e.g., Crill, B. P., et al. 2024, arXiv:2404.11017). The mission achieves sensitivity levels comparable to WISE/NEOWISE W1–W2 and operates from space, unaffected by telluric atmospheric H₂O and CO₂ absorption, using a single, stable, well-characterized, and calibrated platform. SPHEREx is expected to deliver high-quality spectra for ~100,000 SSOs (Ivezic, Z., et al. 2022, Icarus, 371, 114696). Its spectral range is highly diagnostic for identifying surface compositions of small bodies, including hydrated minerals, water ice, and organic compounds. For example, SPHEREx will significantly expand the available data on the 2.7 µm absorption band, a feature indicative of past liquid water activity on SSOs, which cannot be observed from the ground due to atmospheric absorption (Lisse C., et al., 2024, arXiv:2402.08705)
However, additional calibration is required to obtain science-ready reflectance spectra of Small Solar System Objects. SPHEREx takes several days to obtain a full spectrum for individual targets, and during that time, the SSOs’ position and brightness change due to the changing target-spacecraft geometry and the SSO's rotation. Furthermore, the SSO's thermal emission will be imprinted on the observed spectrum. We thus need to account for multiple geometrical (spacecraft-target distance, phase curve) and physical effects (lightcurve, thermal emission) that depend on the dynamical and physical properties of a given SSO.
To address this, a collaborative SSO team has been formed to develop the calibration pipeline for SSOs and, eventually, construct a catalog of SSO spectra. The team consists of researchers from diverse institutions, including the Korea Astronomy and Space Science Institute (KASI), Johns Hopkins University Applied Physics Laboratory (APL), and Seoul National University (SNU). Ongoing work includes the collection of existing photometric data to obtain light curves for as many asteroids as possible and the preparation to operate an 11-inch telescope at Yosemite, dedicated to obtaining light curves specifically for SPHEREx calibration. In addition, efforts are underway to acquire ground-based spectra to validate SPHEREx spectral data. In this presentation, we report on the activities of the SSO collaborative team, the current status, and the future plans of the calibration pipeline and the SPHEREx asteroid spectral catalog.
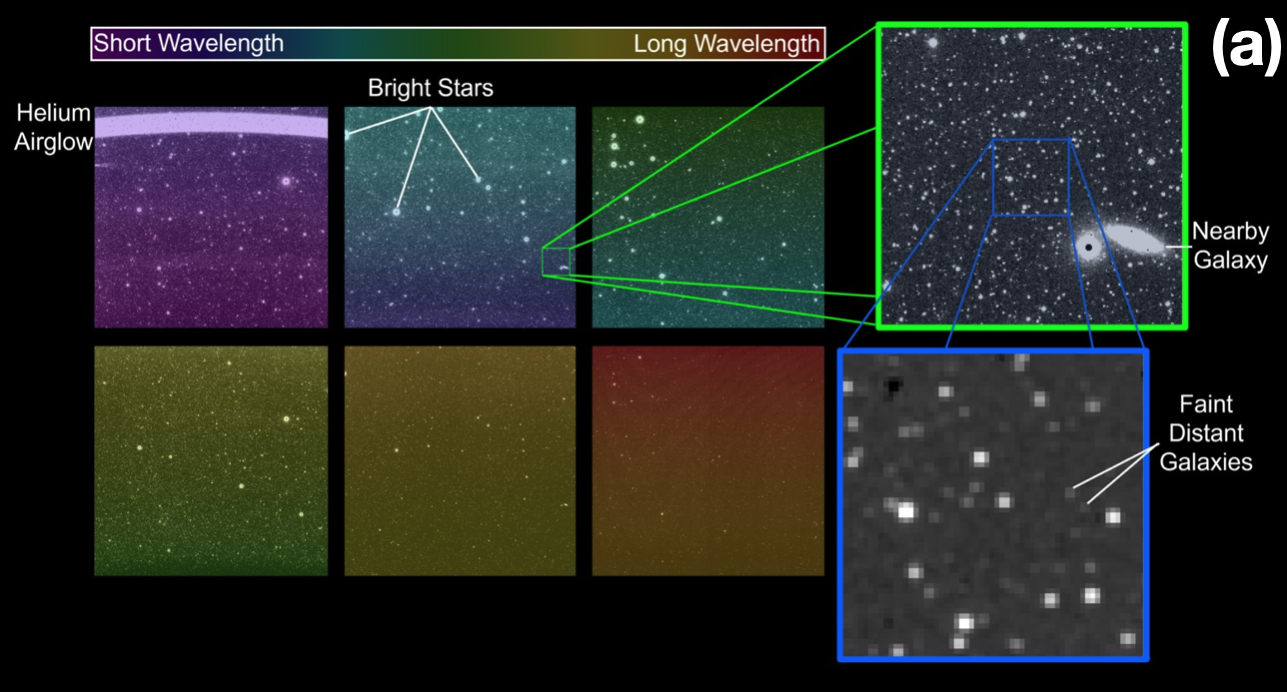
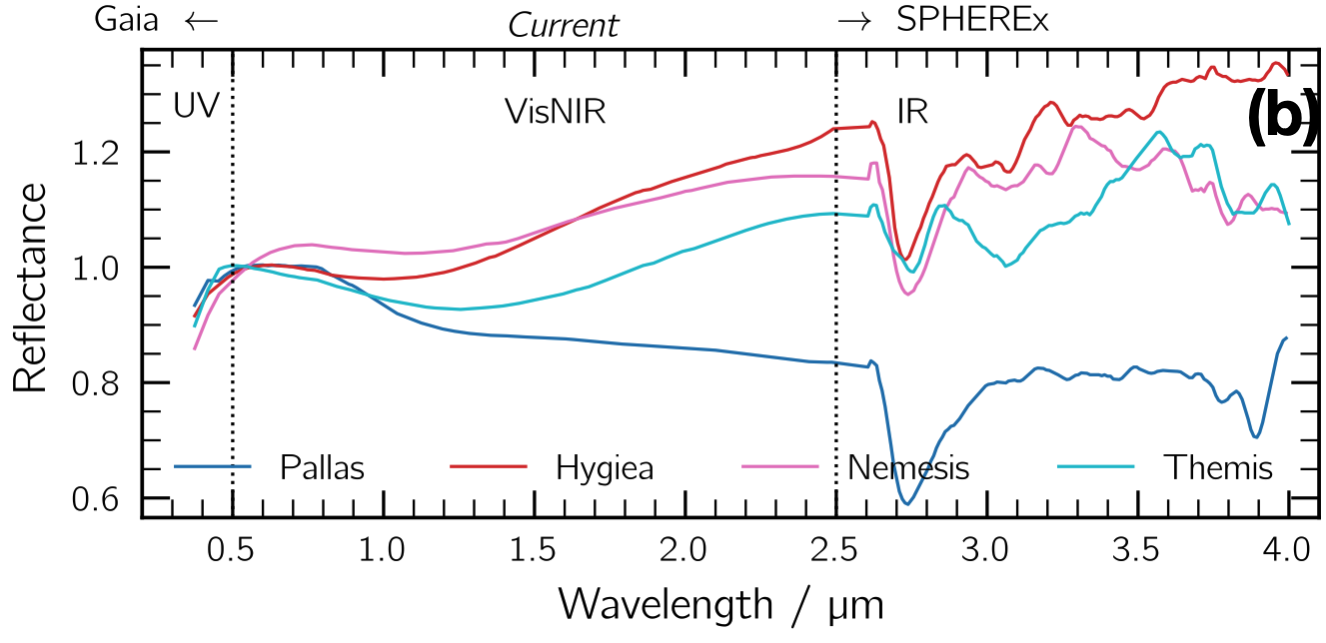
Figure (a). First light images from SPHEREx, taken on March 27, 2025, each contain over 100,000 detected sources. Every exposure includes six images — one per detector — covering a 3.5° × 11.5° field of view. The top and bottom image sets show the same sky area. When routine science begins in April, SPHEREx will take ~600 exposures daily (credit: NASA),
Figure (b). Spectra of large asteroids, produced using data from GAIA DR3, SMASS, MITHNEOS, and AKARI. SPHEREx will capture spectra in the 0.9 to 5 µm.
How to cite: Geem, J., Lisse, C. M., Bach, Y. P., Ishiguro, M., Mahlke, M., Lim, B., Jin, S., and Jo, H.: Calibration of SPHEREx Spectral Data for Small Solar System Objects, EPSC-DPS Joint Meeting 2025, Helsinki, Finland, 7–13 Sep 2025, EPSC-DPS2025-1337, https://doi.org/10.5194/epsc-dps2025-1337, 2025.
Research into compositions of small bodies and planetary surfaces, such as asteroids, is key to understanding the origin of water and organics on Earth [1], as well as placing constraints on planetary dynamics and migration models [2] that can help understand how planetary systems around other stars may form and evolve. Compositional estimates can be found with thermal infrared (TIR; 5-25μm) spectroscopy, as the TIR region is rich in diagnostic information and can be used in remote sensing observations and laboratory measurements. However, TIR spectra of the same material may appear differently depending on several factors, such as particle size, surface roughness, porosity etc. This work quantifies the changes in spectral morphology (i.e., shapes and depths of spectral features) as particle size transitions from fine (<60μm) to coarse (≥60μm).
The motivation for this work stems from TIR spectral modelling. The linear mixing model is most commonly used, and describes a mixture spectrum as being the linear sum of its individual component spectra, weighted by their abundances [3,4]. This works under the assumption that a single photon reaching the detector has interacted with a single particle. Whilst this is accurate for whole rock and coarse particulate samples, the assumption begins to break down as the particle size of the material decreases, approaching the photon wavelength, leading to an increase in multiple/volume scattering. This switch in scattering regime as particle size decreases has well-known effects on the morphology of TIR spectra, and is shown in Figure 1. Feature positions remain largely the same with changing particle size, making the effects seen attributable to the non-linear scattering behaviour. The main differences observed are in the Christiansen Feature (CF) “roll-off” region, on the shorter wavelength side of the CF, and the presence of the Transparency Feature (TF), also illustrated in Figure 1.
Previous work into particle size effects in TIR spectra have largely been qualitative, or quantified different aspects, without a focus on improving spectral mixing models [5-8]. The work presented here will quantify the observed changes in the CF roll-off and TF, with the overarching aim to model these changes, using this to parameterise the linear mixing model, or derive an alternative method altogether.
Presented will be the results for a serpentinite sample consisting primarily of lizardite (>90%), at several size fractions, aimed to be <5μm, 5-10μm, 10-15μm, 15-20μm, 20-25μm, 25-30μm, 30-35μm, 35-40μm, 40-45μm, 46-51μm, 51-55μm, 55-62μm, 62-73μm, 73-120μm, 120-200μm, 200-250μm, 250-350μm, and 350-500μm. These size fractions were separated out from the same bulk material, with those <45μm being separated via centrifugation and filtration, and those >46μm being separated via manual sieving, followed by rinsing. Each size fraction will also have detailed particle size distributions obtained through scanning electron microscopy (SEM), where the particles in the SEM images have been traced manually using the ImageJ software. The thermal infrared emission spectra were collected using the PASCALE instrument at the University of Oxford’s Planetary Spectroscopy Laboratory.
With a clearer understanding of how TIR spectra evolve with changing particle size, the hope is that it will be possible to derive a model that more accurately estimates compositions of coarse and fine particulate materials (e.g., planetary regolith) from their TIR spectra. Having more accurate estimations of planetary surface compositions is vital for future planetary exploration and understanding the history of our solar system.
References:
[1] Morbidelli, A., et al. (2000). Meteoritics & Planetary Science 35.6, pp. 1309–1320.
[2] Walsh, K. J., et al. (2012). Meteoritics & Planetary Science 47.12, pp. 1941–1947.
[3] Lyon, R. J. P. (1964). NASA Contractor Report CR-100.
[4] Ramsey, M. S. and Christensen, P. R. (1998). Journal of Geophysical Research: Solid Earth 103.B1, pp. 577–596.
[5] Salisbury, J. W., Walter, L. S., and Vergo, N. (1987). Mid-Infrared (2.1-25 μm) Spectra of Minerals: First Edition.
[6] Mustard, J. F. and Hays, J. E. (1997). Icarus 125.1, pp. 145–163
[7] Ito, G., Arnold, J. A., and Glotch, T. D. (2017). Journal of Geophysical Research: Planets 122.5, pp. 822–838.
[8] Shirley, K. and Glotch, T. (2019). Journal of Geophysical Research: Planets 124.4, pp. 970–988.
How to cite: Brown, E., Shirley, K., Bowles, N., Ota, T., Yamanaka, M., Tanaka, R., and Potiszil, C.: A Thermal Infrared Emission Spectral Morphology Study of Lizardite , EPSC-DPS Joint Meeting 2025, Helsinki, Finland, 7–13 Sep 2025, EPSC-DPS2025-273, https://doi.org/10.5194/epsc-dps2025-273, 2025.
Regolith porosity on airless Solar System bodies affects mid-infrared (MIR; 5–35 μm) spectra, which can, in turn, affect spectral interpretation. Phyllosilicates are a major mineral component of some groups of carbonaceous chondrites and, presumably, their analog asteroid spectral groups (e.g., B-, C-, D-, and P-type asteroids) (e.g., McSween 1979; Gaffey et al., 1992; Hiroi et al., 2001). These asteroids are typically featureless in the visible and near-infrared (VNIR; 0.5 – 2.5 µm), making it difficult to determine mineralogy from spectral observations at those wavelengths. As such, identifying phyllosilicates with MIR spectra is important for understanding the complex mineralogy on asteroid surfaces. We will present systematic laboratory experiments designed to quantify the effect of regolith porosity on the MIR spectra of the phyllosilicate, serpentine.
The serpentine was ground and sieved in a controlled environment in to three particle size fractions (0-20 μm, 20-45 μm, and 45-63 μm). We then mixed the powders with different percentages of potassium bromide (KBr; a MIR transparent salt that is used as a proxy for regolith porosity). Samples were mixed with KBr in ratios from 0% to 90% by weight, in 10 wt.% intervals. We made reflectance measurements of all samples using a Thermo-Nicolet iS50 Fourier Transform infrared (FTIR) spectrometer, under ambient conditions, with the PIKE Technologies EasiDiff diffuse reflectance accessory. Previous work showed that with increasing the regolith porosity of anhydrous silicate-rich sample (e.g., olivine), spectra transition from surface scattering dominant (at low regolith porosities) to volume scattering dominant (at high regolith porosities) (Martin et al., 2022; 2023; Dausend et al., 2025). We observe the same trend in the phyllosilicate spectral suite. Indicators of the scattering regime transition include decreasing spectral contrast of the Christiansen Feature (CF) and growth of the 10-μm plateau with increasing regolith porosity.
While phyllosilicates, olivine, and pyroxene are common minerals found on many extraterrestrial surfaces, it is unlikely for a surface to be comprised entirely of these three silicate constituents. Thus, in future studies, we plan to explore how the porosity affects the MIR spectra of sample mixtures.
References: Dausend L. et al. (2025) PSJ, 6, 54. Gaffey M. J. et al. (1992) Meteoritics, 28. Hiroi T. et al. (2001) Science, 293. Martin A. C. et al. (2022) Icarus, 378. Martin A. C. et al. (2023) Icarus, 397. McSween H. Y. (1979) Meteoritics, 14(4).
How to cite: Martin, A., Dausend, L., and Emery, J.: Mid-Infrared Spectral Effects of Regolith Porosity: Phyllosilicates, EPSC-DPS Joint Meeting 2025, Helsinki, Finland, 7–13 Sep 2025, EPSC-DPS2025-876, https://doi.org/10.5194/epsc-dps2025-876, 2025.
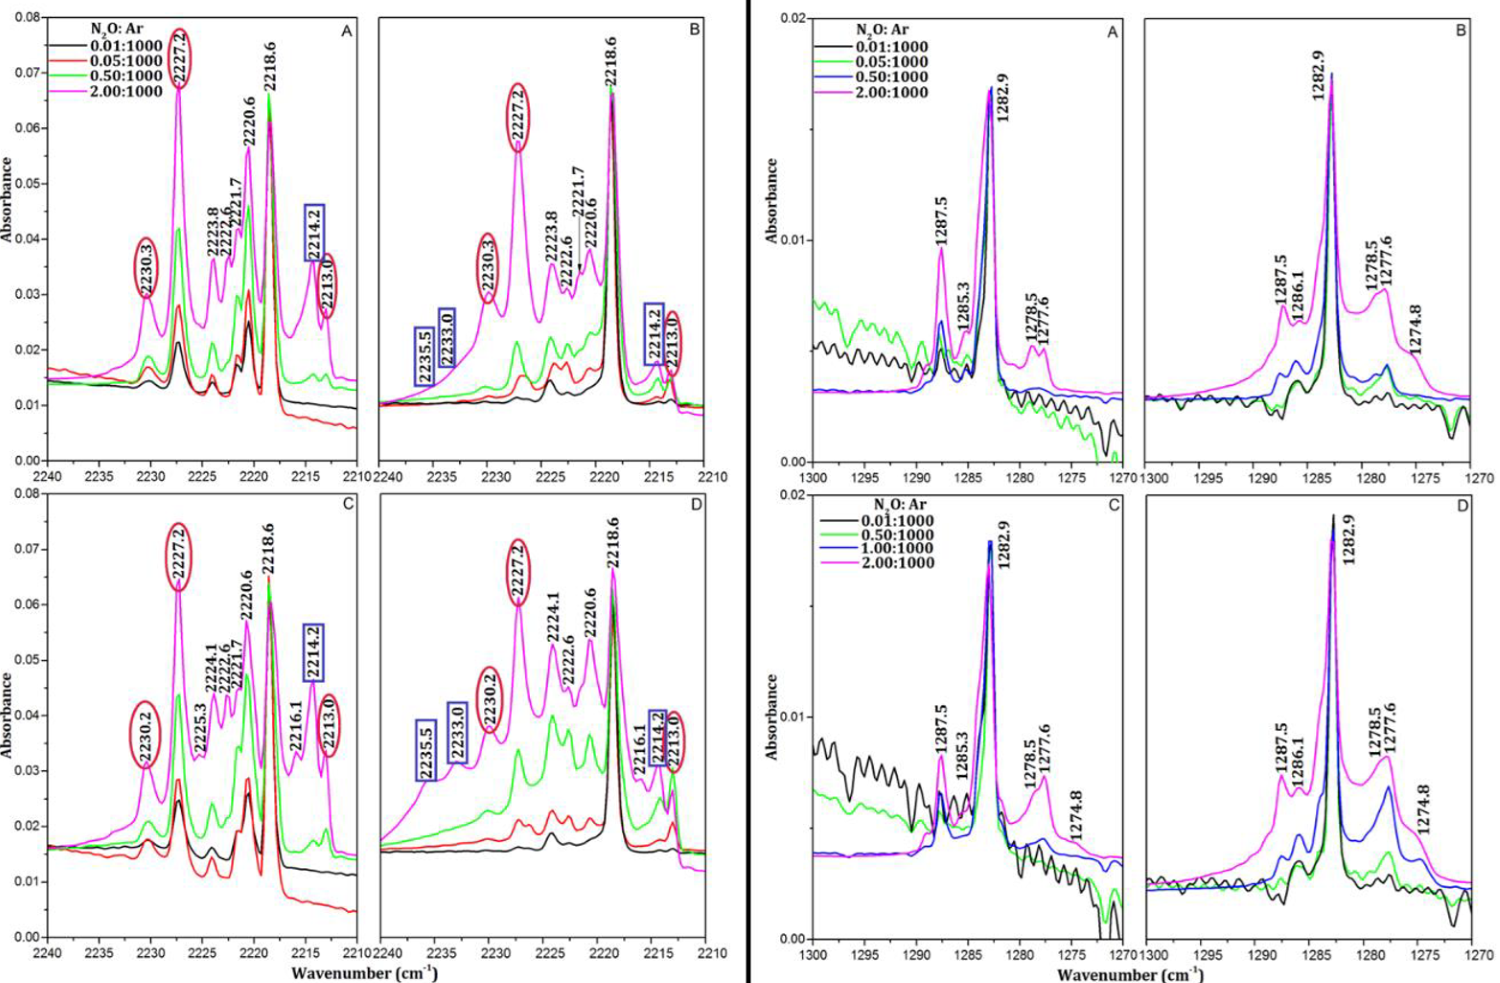
1. Sivaraman, B., Ptasinska, S., Jheeta, S. & Mason, N. J. Electron irradiation of solid nitrous oxide. Chem Phys Lett 460, 108–111 (2008).
2. Grenfell, J. L., Gebauer, S., V. Paris, P., Godolt, M. & Rauer, H. Sensitivity of biosignatures on Earth-like planets orbiting in the habitable zone of cool M-dwarf Stars to varying stellar UV radiation and surface biomass emissions. Planet Space Sci 98, 66–76 (2014).
3. Schwieterman, E. W. et al. Evaluating the Plausible Range of N2O Biosignatures on Exo-Earths: An Integrated Biogeochemical, Photochemical, and Spectral Modeling Approach . Astrophys J 937, 109 (2022).
4. Chandra, S., Suryaprasad, B., Ramanathan, N. & Sundararajan, K. Nitrogen as a pnicogen?: evidence for π-hole driven novel pnicogen bonding interactions in nitromethane–ammonia aggregates using matrix isolation infrared spectroscopy and ab initio computations. Physical Chemistry Chemical Physics 23, 6286–6297 (2021).
5. Sagan, C., Thompson, W. R., Carlson, R., Gurnett, D. & Hord, C. A search for life on Earth from the Galileo spacecraft. Nature 365, 715–721 (1993).
6. Gordon, I. E. et al. The HITRAN2020 molecular spectroscopic database. J Quant Spectrosc Radiat Transf 277, 107949 (2022).
7. Hudson, R. L. & Moore, M. H. The N 3 Radical as a Discriminator between Ion‐ irradiated And UV‐photolyzed Astronomical Ices . Astrophys J 568, 1095–1099 (2002).
8. Hudson, R. L. N 2 Chemistry in Interstellar and Planetary Ices: Radiation-driven Oxidation. Astrophys J 867, 160 (2018).
9. Almeida, G. C. et al. Processing of N2O ice by fast ions: Implications on nitrogen chemistry in cold astrophysical environments. Mon Not R Astron Soc 471, 1330– 1340 (2017).
10. Cruikshank, D. P. et al. The surface compositions of Pluto and Charon. Icarus 246, 82–92 (2015).
11. Jamieson, C. S., Bennett, C. J., Mebel, A. M. & Kaiser, R. I. Investigating the Mechanism for the Formation of Nitrous Oxide [N 2 O( X 1 Σ + )] in Extraterrestrial Ices . Astrophys J 624, 436–447 (2005).
12. Nxumalo, L. M. & Ford, T. A. IR spectra of the dimers of carbon dioxide and nitrous oxide in cryogenic matrices. J Mol Struct 327, 145–159 (1994).
13. Kudoh, S., Onoda, K., Takayanagi, M. & Nakata, M. N2O clusters in a supersonic jet studied by matrix-isolation infrared spectroscopy and density functional theory calculation. J Mol Struct 524, 61–68 (2000).
14. Lawrence, W. G. & Apkarian, V. A. Infrared studies in free standing crystals: N2O-doped Xe and Ar. J Chem Phys 97, 2224–2228 (1992).
15. Krueger, H. & Weitz, E. O(3P) atom lifetimes and mobilities in xenon matrices. J Chem Phys 96, 2846–2855 (1992).
16. Wan, L., Xu, G., Wu, L., Chen, Y. & Hu, S. M. Vibrational spectroscopy of N2O in solid neon matrices. J Mol Spectrosc 249, 65–67 (2008).
How to cite: Mahapatra, N., Chandra, S., Ramanathan, M. N., and Sundararajan, M. K.: Structural Elucidation of N2O Clusters at Low Temperatures: A Matrix Isolation IR Spectroscopic and Computational study, EPSC-DPS Joint Meeting 2025, Helsinki, Finland, 7–13 Sep 2025, EPSC-DPS2025-2073, https://doi.org/10.5194/epsc-dps2025-2073, 2025.
Please decide on your access
Please use the buttons below to download the supplementary material or to visit the external website where the presentation is linked. Regarding the external link, please note that Copernicus Meetings cannot accept any liability for the content and the website you will visit.
Forward to presentation link
You are going to open an external link to the presentation as indicated by the authors. Copernicus Meetings cannot accept any liability for the content and the website you will visit.
We are sorry, but presentations are only available for users who registered for the conference. Thank you.
The Europa Thermal Emission Imaging System (E-THEMIS) on the Europa Clipper spacecraft will investigate the temperature and physical properties of Europa using thermal infrared images in three wavelength bands at 7-14 µm, 14-28 µm and 28-70 μm [Christensen et al., 2024]. The specific objectives of the investigation are to 1) understand the formation of surface features, including sites of recent or current activity, in order to understand regional and global processes and evolution and 2) to identify safe sites for future landed missions. The E-THEMIS radiometric calibration includes removing the thermal emission from the instrument housing, optical elements, and filters using observations of space and an internal calibration flag [Christensen et al., 2024]. On February 28, 2025, the Clipper spacecraft performed a close flyby of Mars for a trajectory gravity assist. Twenty four hours prior to closest approach the spacecraft pointed the E-THEMIS instrument at Mars and performed a sequence that scanned E-THEMIS across the planet at a slew rate of 100 micro-radians per second. This rate is the same as what be used to image Europa during each flyby [Pappalardo et al., 2024]. This activity accomplished two primary objectives: 1) collect images of a well-characterized target (Mars) to validate the E-THEMIS calibration methodology and software prior to the first observations of Europa; and 2) rehearse the data collection procedure that will be used to obtain global observations of Europa.
Mars makes an excellent thermal calibration target because it has been extensively studied and characterized by numerous thermal infrared instruments. The E-THEMIS observations were simulated using modeled surface temperatures generated using global maps of thermal inertia albedo made from the MGS TES data [Christensen et al., 2001], together with the krc thermal model [Kieffer, 2013]. The wavelength-dependent atmospheric absorption and emission was modeled using data from the UAE Emirates Mars Mission EMIRS thermal infrared spectrometer [Amiri et al., 2022; Edwards et al., 2021]. EMIRS collects global scans of hyperspectral data from 6-100 µm at 5 and 10 cm-1 spectral sampling at ~200 km spatial resolution [Edwards et al., 2021]. These spectra were resampled from wavenumber to wavelength and weighted by the three E-THEMIS spectral bandpasses to produce 3-band simulated E-THEMIS global images. EMIRS data were not collected simultaneously with the E-THEMIS imaging, but global observations were acquired at the same season and within 5° of latitude, 10° of longitude, and 0.3 H local time of the E-THEMIS data. Fig. 1 shows an example of the nearest EMIRS observation to the E-THEMIS observing conditions of sub-spacecraft latitude=20.3° N, longitude=163.0° E, local time=11.48 H, and Ls=50.5°. A transfer function from the krc-generated surface temperatures and the bandpass-weighted EMIRS data was created by averaging the ratio of forty-five EMIRS observations to the krc-generated surface temperatures. Simulated E-THEMIS observations were produced using the average of these ratios and the krc surface temperatures. The results are given in Fig. 2. The E-THEMIS data could not be transmitted to Earth until Clipper was more than 2 AU from Sun due to spacecraft thermal constraints. As a result the data were received on Earth on May 7, 2025, and the results and an assessment of the E-THEMIS calibration will be discussed.
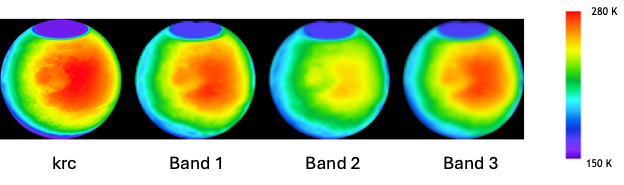
Fig. 1. Measured Mars temperatures. Comparison of temperature globes for surface temperature (krc model) and E-THEMIS-bandpass-weighted EMIRS data for Bands 1, 2, and 3. The EMIRS observations were acquired on Feb. 17, 2025, at a sub-spacecraft viewing geometry of 16.0° N latitude, 174.1° E longitude, 11.60 H local time, and 45.5° Ls.
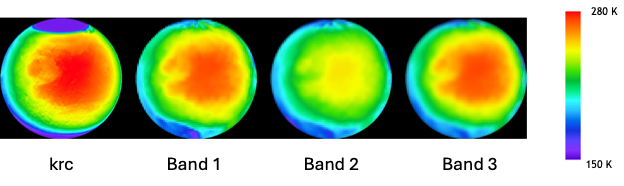
Fig. 2. Simulated E-THEMIS temperature images. The data for each E-THEMIS band were created using the krc model surface temperatures transferred to E-THEMIS wavelength bands using a transfer function derived from EMIRS observations.
References
Amiri, H., D. Brain, O. Sharaf, P. Withnell, M. McGrath, M. Alloghani, M. Al Awadhi, S. Al Dhafri, O. Al Hamadi, and H. Al Matroushi (2022), The emirates Mars mission, Space Science Reviews, 218(1), 4.
Christensen, P. R., et al. (2001), The Mars Global Surveyor Thermal Emission Spectrometer experiment: Investigation description and surface science results, J. Geophys. Res., 106, 23,823-823,871.
Christensen, P. R., J. R. Spencer, G. L. Mehall, M. Patel, S. Anwar, M. Brick, H. Bowles, Z. Farkas, T. Fisher, and D. Gjellum (2024), The Europa Thermal Emission Imaging System (E-THEMIS) Investigation for the Europa Clipper Mission, Space Science Reviews, 220(4), 1-65.
Edwards, C. S., P. R. Christensen, G. L. Mehall, S. Anwar, E. A. Tunaiji, K. Badri, H. Bowles, S. Chase, Z. Farkas, and T. Fisher (2021), The Emirates Mars Mission (EMM) Emirates Mars InfraRed Spectrometer (EMIRS) Instrument, Space science reviews, 217, 1-50.
Kieffer, H. H. (2013), Thermal model for analysis of Mars infrared mapping, J. Geophys. Res, 116, 451-470.
Pappalardo, R. T., B. J. Buratti, H. Korth, D. A. Senske, D. L. Blaney, D. D. Blankenship, J. L. Burch, P. R. Christensen, S. Kempf, and M. G. Kivelson (2024), Science Overview of the Europa Clipper Mission, Space Science Reviews, 220(4), 1-58.
How to cite: Christensen, P., Spencer, J., Piqueux, S., Mehall, G., Anwar, S., Abramov, O., Hayne, P., Howett, C., Mellon, M., Nimmo, F., Rathbun, J., Buratti, B., and Pappalardo, R.: Europa Thermal Emission Imaging System (E-THEMIS) cruise observations of Mars, EPSC-DPS Joint Meeting 2025, Helsinki, Finland, 7–13 Sep 2025, EPSC-DPS2025-1105, https://doi.org/10.5194/epsc-dps2025-1105, 2025.
Remotely sensed hyperspectral data provide essential information on the composition of rocks on planetary surfaces. On Mars, these data types are provided by the CRISM instrument (Compact Reconnaissance Imaging Spectrometer for Mars) [1], a hyperspectral camera that operated onboard the MRO (Mars Reconnaissance Orbiter) probe that collected more than 10 Tb of data. CRISM covers a spectral range going from ca. 400 to ca. 4000 nm, with a spectral resolution of 6.55 nm/channel and a spatial resolution of up to 18.4 m/px. The most advanced CRISM data products are the MTRDRs (Map-Projected Target Reduced Data Records) [2]. These data are re-projected onto the Martian surface and are cleaned from the so-called ”bad bands” (noisy stripes).
The two main CRISM MTRDR subproducts are the hyperspectral datacube and the spectral parameter datacube. The first contains the detected reflectance spectra, while the second is composed of 60 different spectral parameters, as defined in [3], usually to produce RGB maps emphasizing specific minerals within the scene. Usually, the creation of the RGB maps and the spectral analysis are conducted using commercial software like ENVI©, which are usually not specifically meant for these dataset, inherently implies some costs for the user, and does not always meet some of the fundamentals principles of Open Science [4].
Here we present a free open-source tool completely written in Python called pyFRESCO (Flexible RGB Extraction and Spectra Comparison for Observations), which allows the use of CRISM MTRDR data. The software can create RGB maps and select Regions Of Interest (ROI) from which the user can extract and further analyze the spectral data available from the chosen CRISM scene.
The possible types of analysis that pyFRESCO supports range from simple descriptive statistics (to obtain, for example, mean spectra of a ROI), and spectra-related pre-processing methods like continuum removal and/or smoothing, to analysis through more complex techniques. One of those techniques being a direct spectral comparison tool that, given a guess taken from the minerals that are present in the MICA files [5], infer the nearest absorption features to the tabulated ones. Another technique, applicable only to mafic minerals, is the calculation of band parameters given in [6] for mafic mineral discrimination (e.g. between pyroxenes and silicate glasses). The last one involves a machine learning driven Modified Gaussian Model [7] for spectral unmixing with either skewed or non-skewed normal distributions.
Moreover, with pyFRESCO it is possible to georeference the RGB maps to export them to ArcGIS©/QGIS software.
In support of the effectiveness of pyFRESCO, we present a case study conducted on the CRISM target FRT00009B5A that covers the northern portion of Kai crater, located in Meridiani Planum. The choice of this particular case study is motivated by the morphological and compositional complexity shown by this specific target [8], demonstrating that pyFRESCO can be useful especially in complex scenarios that require a detailed analysis of the geological context, evolution, and processes.
Bibliography:
[1] Murchie, S. 2007. doi:10.1029/2006JE002682.
[2] Seelos, F.P. 2016. URL: https://api.semanticscholar.org/CorpusID:217998642
[3] Viviano-Beck, C.E. 2014. doi:10.1002/2014JE004627.
[4] Barker, M. 2022. doi:10.1038/s41597-022-01710-x.
[5] Viviano-Beck, C. E., 2015. URL: https://crismtypespectra.rsl.wustl.edu/.
[6] Horgan, B.H. 2014. doi:https://doi.org/10.1016/j.icarus.2014.02.031.
[7] Sunshine, J.M. 1990. URL: https://agupubs.onlinelibrary.wiley.com/doi/abs/10.1029/JB095iB05p06955
[8] Baschetti, B. 2025. doi: https://doi.org/10.1029/2024JE008564
How to cite: Baroni, M., Baschetti, B., Pisello, A., Massironi, M., Porreca, M., and Petrelli, M.: pyFRESCO, a Python open source tool to democratize CRISM spectral data management, analysis and mapping, EPSC-DPS Joint Meeting 2025, Helsinki, Finland, 7–13 Sep 2025, EPSC-DPS2025-1843, https://doi.org/10.5194/epsc-dps2025-1843, 2025.
How to cite: Kuksenko, V., Jevčák, P., Sabolová, K., Šilha, J., and Lilly, E.: Verification of photometric transformations for small Solar System bodies on Main-Belt asteroid color data, EPSC-DPS Joint Meeting 2025, Helsinki, Finland, 7–13 Sep 2025, EPSC-DPS2025-126, https://doi.org/10.5194/epsc-dps2025-126, 2025.
Introduction
Visible and near infrared (VNIR) spectroscopy is a widely used and powerfull tool to investigate planetary surfaces. Most minerals or volatile elements making up surfaces have characteristic absorption bands in the range 0.5 μm < λ < 5 μm. In this spectral range, the ices present in the solar system all have in common a high reflectivity in the visible, and strong absorption bands in the near infrared. Usually, planetary ices form a layer covering an underlying substrate. This results in both the signals from ice and the surface underneath being present in the VNIR spectroscopic measures at most wavelenghts. Moreover, ice is volatile and interacts with planetary surfaces and atmospheres, and is therefore often intimately mixed with granular mineral materials (regolith, atmospheric aerosols, etc...). It is important to note that other type of stratified planetary surface can be studied with VNIR spectroscopy, such as a thin space-weathered ice layer covering a well preserved one such as expected on icy moons, or liquid films such as hydrocarbures on Titan. The purpose of this work is to develop a numerically efficient two-layer radiative transfer model that can encompass all these possibilities and allow for massive inversions, across entire hyperspectral cubes, such as CRISM [1], NIMS [2] or SIMBIO-SYS [3].
Model :
Figure 1 describes the problem. We consider the two-stream approximation, under collimated radiation inside layered media. The surface is constituted of two layers, medium 1 of optical thickness τ1 on top, and a semi infinite medium 2 under it. The reflection coefficients at the interfaces are Se1u, Si1u, Si1b and Si2u. The surface is illuminated by a collimated radiation of intensity J0 and incidence θ0. J1 is the part of this radiation transmitted to the medium 1, with an incidence θ1. All the other radiation inside the medium 1 is either a part of the upward stream I1 or the downward stream I2 . The same process happen at the second interface, and medium 2 is under collimated radiation J2, of incidence θ2; and all the other radiation inside the medium 2 is either a part of the upward stream I3 or the downward stream I4 . We define μ0 = cosθ0, μ1 = cosθ1 and μ2 = cosθ2 to simplify notations.
Medium 1 has a single scattering albedo ω1 and medium 2 has a single scattering albedo ω2. Radiative transfer is not considered inside medium 0 that can be considered as air for instance. The main goal of the work is to compute the intensity going out upward from medium 1 to medium 0. In this problem, J0, J1 and J2 are considered collimated radiation, and there are reflective interfaces between the different media. Then, the Snell's law of refraction applies and gives the inclinations ofJ1 from θ0 and the the inclinations of J2 from θ1.

Figure 1: Scheme of the fluxes and quantities involved inside the media.
The resolution of the radiative transfer is conducted the way as Bruce Hapke did [4], using isotropic scatterers, giving four differential equations to be solved, as two per surface strata:

Reflectance:
Integrating the differential equations considering continuity at the interfaces and finite energy for large τ gives the following expression for the reflectance, with A1, A2, B, C1 and C2 being the integrations constant, Rspec the specular reflectance at the top interface and γ1,22=1-ω1,22. This expression is then modified to take anisotropy into account, using similarity relations as detailed in section 8.6.4 of Hapke 2012 [4].

Singularities:
This expression of the reflectance contains 3 singularities that must be treated: one in 1/(1/μ-2γ1) is visible in the previous equation, and two others of the same form hidden in constants C1 and C2. These singularities have no physical basis and should be possible to simplify. They already existed in the granular monolayer version of the two-stream resolution from B. Hapke and the original expression could be reformulated into one without said singularities.
Figure 2 illustrates the singularity of the reflectance for the monolayer case. The blue plot represents the equivalent of the Eq. 2 implemented naively. The orange plot represents the same equation, after simplification. Without simplification, the errors are large in almost all the physical domain ω>0.3 which makes the naïve expression useless.

Figure 2: Illustration of the effect of a singularity in two mathematically identical formulations of the monolayer Hapke model [4]
Challenge:
Contrarily to the monolayer case, the two-layer case faces an analytical expression that is much more complex. For the moment, we did not find a reformulation that eliminates these singularities. The numerical treatment seems challenging but a solution may exist. We will discuss the strategies deployed attempting to solve this problem.
In the literature, numerous studies especially for photometry use a two granular layers resolution provided by Hapke that contains theses singularities. This is a problem because they can introduce significant numerical errors, such as illustrated in fig.2. It is crucial to note that, even if the two formulations are identical on the mathematical point of view, the singularity has a huge impact on the numerical implementation of it and the overall reflectance estimate.
Conclusion
We have developed a new spectrophotometric radiative transfer model under the two-stream approximation for layered planetary surfaces. This model addresses the limitations of existing models, such as the Hapke model, by considering both compact and granular layers with an unlimited number of components in intimate mix. It handles collimated radiation and reflective interfaces between media.
However, the validation process revealed significant challenges, particularly the presence of singularities in the reflectance expression. These singularities, which have no physical basis, can introduce substantial numerical errors and affect the accuracy of reflectance estimates. While we have not yet found a reformulation to eliminate these singularities, addressing them is crucial for improving the model's reliability and applicability in studying complex planetary surfaces.
References:
[1] Murchie et al., JGR: PLanets, 2007
[2] Brown et al., Space Science Reviews, 2004
[3] Cremonese et al., Space Science Reviews, 2020
[4] Habke, 2012, Cambridge University Press
How to cite: Andrieu, F. and Schmidt, F.: An analytical specro-photometric model for layered complex planetary surfaces: limitations of the Hapke model and new formulations, EPSC-DPS Joint Meeting 2025, Helsinki, Finland, 7–13 Sep 2025, EPSC-DPS2025-169, https://doi.org/10.5194/epsc-dps2025-169, 2025.
Thanks to the computational power of current graphic cards, photographic archives can be turned into three dimensions virtual worlds. The Structure from Motion photogrammetry technique simply requires a set of overlapping images, acquired from different viewing points, to reconstruct in 3D the observed landscape elements. This technique can also be applied on rock samples characterized in the laboratory. We have applied this technique to scanned photographs of the Moon acquired during the Apollo 17 mission [1, 2, 3]. In the case of the “Station 6” geological waypoint investigated by the astronauts at Taurus Littrow during their third EVA, we found that 154 images can be automatically aligned into a single photogrammetric project [4]. This allows to generate a textured polygonal mesh of the nearly complete Station 6 area and to retrieve the respective size and orientation of the large main boulders that bounced down the North Massif, coming to rest at a change in slope.
We have also shown in [4] that 3D reconstruction process also works for lunar rock samples that have been photographed during the 70s before being sawed for analysis. This allows for example to setup a Virtual Reality (VR) immersive simulation where the user can replace the samples at their exact location and orientation directly on their parent boulder. Satellite images such as Kaguya/TC or LRO/LROC can be used to provide the general context in the VR simulation. They can eventually be completed by other cartographic products, as would be done in a GIS system, to include for example false color composites from Clementine to give some compositional context to the in situ sites.
Following the work on Station 6, we have undergone new 3D reconstructions on the next geological waypoint, the Station 7. In this case, we were able to reconstruct three rock samples in 3D using 96 LPI laboratory archived photographs. Their parent boulder and the local lunar ground was reconstructed using 85 Apollo images. These new 3D elements have been added in the previous VR simulation (Figure 1).
The 3D analysis can be used for outreach, education or scientific investigation. For outreach, the use of an application designed for a standalone VR headset provides the most versatile and cost effective solution. More ambitious projects (with a wider high-resolution cartographic coverage and several highly detailed digital outcrop models) would benefit from a VR headset connected by a cable to a gaming computer. In addition to students, this kind of 3D reconstructions could also be used in astronaut training simulations to provide realistic cases. On the science side, it allows to investigate problematics linked for example to the effect of space weathering on lunar surface rocks. We could also envisage deriving the absolute position and orientation of specific lunar rock samples, which could give new insight and constrains to paleo-magnetic studies [5, 6]. Forthcoming robotic (and possibly manned) missions could take advantage of these new photogrammetric capabilities to optimize the image acquisition strategy during the in situ exploration phase.

Figure 1: Perspective view of a Virtual Reality scene of Station 7 reconstructed using photogrammetry on a set of Apollo photographs. The ground is mainly retrieved from the 360° panorama taken by G. Cernan. An LRO image provides the context. Astronaut’s footprints and rover tracks appear readily in the textured photogrammetric ground. The LRV is a 3D model added to give a better sense of scales. Sample 77115 has been also reconstructed in 3D from archived photographs and replaced at its original location on the parent boulder. Station 6, located at 475m and also included in the VR simulation, is seen in the upper left
References
[1] Wolfe, E.W. et al., Geologic investigation of the Taurus-Littrow Valley: Apollo 17 landing site. U.S. Geol. Surv. Prof. Pap. 1981, 1080, 225–280
[2] Schmitt, H.H. et al., Revisiting the field geology of Taurus-Littrow. Icarus, 298, 2–33, doi:10.1016/j.icarus.2016.11.042, 2017
[3] Le Mouélic, S. et al., Investigating Lunar Boulders at the Apollo 17 Landing Site Using Photogrammetry and Virtual Reality, Remote Sensing, vol 12, 11, DOI10.3390/rs12111900, 2020.
[4] Le Mouélic, S. et al., Photogrammetric 3D reconstruction of Apollo 17 Station 6: From boulders to lunar rock samples integrated into virtual reality, Planet. Space Sci., 240, doi:10.1016/j.pss.2023.105813, 2024.
[5] Weiss, B. P. & S. M. Tikoo, The lunar dynamo, Science 346 (6214), 1246753, 2014.
[6] Nichols, C.I. O. et al., The paleoinclination of the ancient lunar magnetic field from an Apollo 17 basalt. Nature Astonomy, 5, 1216-1223, 2021.
How to cite: Le Mouélic, S., Vaugeois, G., Schmitt, H. H., Mangold, N., and Caravaca, G.: From photographic record to virtual worlds: the case of Apollo and rover missions, EPSC-DPS Joint Meeting 2025, Helsinki, Finland, 7–13 Sep 2025, EPSC-DPS2025-261, https://doi.org/10.5194/epsc-dps2025-261, 2025.
Introduction
V-type asteroids are not as common as those found in the C- and S- complexes in both near-Earth space and the main belt. In near-Earth space, V-types make up ~5% of the distribution (by number) [1], and the same is true for the main belt [2]. The vast majority of V-type asteroids in the main belt consist of the (4) Vesta dynamical asteroid family [3]. One study of interest is near-Earth V-types’ connection to the (4) Vesta family, which primarily consists of V-types. Its members are referred to as Vestoids. These two groups have been connected through orbital dynamics, due to Vestoids’ location in the inner main belt close to the ν6 resonance [4]. Near-Earth V-types and Vestoids have also been connected due to their similar compositions to each other and to howardite, eucrite, and diogenite (HED) meteorites [5,6]. The dynamical and compositional connections between these two groups gives us the opportunity to compare their spectra and make inferences on how the location of these asteroids affects their surface properties.
Spectra of V-type asteroids are quantified by computing band parameters of the 0.9-μm (Band I) and 1.9-μm (Band II) pyroxene absorptions. Previous work has found that near-Earth V-type spectra and main belt V-types have differences in their band parameters [7]. There are differences between the absorption band centers, with near-Earth V-types having band centers at longer wavelengths (average Band I center = 0.935 ± 0.01 μm; average Band II center = 1.968 ± 0.032 μm) compared to main belt V-types (average Band I center = 0.926 ± 0.01 μm; average Band II center = 1.946 ± 0.038 μm) [7]. The greatest difference is the Band I slope, which is the slope of the continuum line across the Band I absorption feature. The Band I slope of main belt V-types has an average value of 0.66 ± 0.2 μm-1, while near-Earth V-types have a much lower average Band I slope of 0.23 ± 0.13 μm-1 [7]. The band parameters of the near-Earth V-types are much closer to those of eucrites (BI slope = 0.28 ± 0.09 μm-1), which are thought to have Vestoids as their parent bodies [8]. Both eucrites and near-Earth V-types have Band I slopes that are not as red as main belt V-types, which could be due to multiple factors, including space weathering [9] and regolith grain size [10].
Due to continuous collisions over time, smaller asteroids tend to have younger surfaces [11]. Near-Earth V-types are typically an order of magnitude smaller than most observed main belt V-types [1,12]. Therefore, we hypothesize that the cause of the band parameter discrepancy is the observational bias towards larger, older main belt V-types. If true, we would expect small main belt V-types to be spectrally similar to NEA V-types.
Methods
Several main belt Vestoids in the size range of 1-3 km were observed during the Fall 2024 and Spring 2025 semesters using the SpeX spectrograph on NASA’s Infrared Telescope Facility (IRTF), which is a 3-m infrared telescope to measure their near-infrared spectra (prism, 0.7-2.5 um) [13]. Before each observation, the slit was rotated to match the parallactic angle of the target. All observations were aimed to be taken at an air mass less than 1.5 and spectra of local solar standard stars were taken to correct the asteroid spectra of telluric features. These solar standards were also used to remove the spectral slope caused by the Sun. The extraction and reduction of the data were done using the IDL SpeXtool package [14]. A Python program was written to perform the band parameter analysis, and the method used is described in [15]. For each asteroid, the Band I and II centers, the Band I slope, and the separation between the two bands were determined. We performed the same analysis on previously published data of both near-Earth and main belt V-type asteroids [1, 15, 16]. This analysis was done not only to validate the algorithm, but to be able to compare the near-Earth V-types to both large and small main belt V-types to look for any correlations with asteroid size. Main belt Vestoids in the size range of 4-6 km were also observed in the same manner, to identify any trends between Band I slope and asteroid size for V-types.
Results
The results show that there is potential correlation between Band I slope and asteroid size, rather than the asteroid’s dynamical class. This potential correlation is especially apparent for the smaller main belt V-types, which have Band I slopes that seem to overlap with those of near-Earth V-types of similar sizes. Our next steps for this project include obtaining spectra for main belt Vestoids <2 km in diameter.
We will present the results of comparing the spectral parameters of near-Earth V-types to those of main belt Vestoids as a function of asteroid diameter and the implications of the results.
References
[1] Binzel et al. 2019, Icarus, 324, 41-47.
[2] Carvano et al., 2010. A&A 510, A43.
[3] DeMeo & Carry, 2013. Icarus, 226, 1, 723-741.
[4] Marzari et al. 1996, Astronomy and Astrophysics, 316, 248-262.
[5] Burbine et al. 2010. Meteoritics & Planetary Science, 44, 9, 1331-1341.
[6] McSween Jr., et al. 2013. Meteoritics & Planetary Science, 48, 11, 2090-2104.
[7] Fulvio et al. 2018, Planetary and Space Science, 164, 37-43.
[8] De Sanctis et al. 2012. Science, 336, 697-700.
[9] Fulvio et al. 2012, Astronomy and Astrophysics, 537, L11.
[10] Bowen et al. 2023. Planet. Sci. J., 4, 52.
[11] Price. 2004, Advances in Space Research, 33, 9, 1548-1557.
[12] Oszkiewicz et al. 2020, Astronomy and Astrophysics, 643, A117.
[13] Rayner et al. 2003. PASP, 115, 362.
[14] Cushing et al. 2004. PASP, 116, 818.
[15] Moskovitz et al. 2010. Icarus, 208, 2, 773-788.
[16] Marsset et al. 2022. The Astronomical Journal, 163, 4.
How to cite: Champagne, C., Thomas, C., and Emery, J.: A Spectral Comparison of Small Main Belt and Near-Earth V-types in the Near-Infrared, EPSC-DPS Joint Meeting 2025, Helsinki, Finland, 7–13 Sep 2025, EPSC-DPS2025-812, https://doi.org/10.5194/epsc-dps2025-812, 2025.
Introduction and Objectives
For ISRU and sustainable lunar habitats, characterizing the mineralogical heterogeneity of candidate landing sites is critical for identifying regions of high resource potential. This study investigates four geologically diverse lunar regions—Aristarchus, Malapert, Mare Tranquillitatis, and Leibnitz Crater—using data from the Moon Mineralogy Mapper (M³) onboard Chandrayaan-1. The objective is to map mineralogical compositions relevant to resource extraction, supporting future lunar exploration strategies.
Site Selection Criteria
The four regions were selected based on their geological diversity and potential ISRU value. Key mineralogical targets include ilmenite (for oxygen production), anorthosite and plagioclase (for construction materials), and regions enriched in FeO, TiO₂, or Helium-3. Polar regions like Malapert may contain water ice in shadowed areas and offer thermal stability.
Site accessibility and terrain complexity were also considered. Although precise landing constraints are mission-specific and still under active assessment, general factors such as surface roughness and illumination conditions can influence the operational feasibility of exploration. The near side supports direct Earth communication, while far side sites like Leibnitz offer long-term strategic value.
Availability of high-quality M³ imagery was also essential for ensuring robust mineralogical mapping.
M3 Instrument Overview
Moon Mineralogy Mapper (M³) is a high-resolution imaging spectrometer that measured reflectance in the 430-3000 nm range with 10 nm spectral resolution on 85 adjacent bands. Here, calibrated Level 2 products (NASA PDS) have been used that have gone through radiometric, photometric, and thermal corrections (Martinot et al., 2018; Mustard et al., 2011; Staid et al., 2011). Most M³ scenes were captured in global mode, with ~140 m/pixel resolution, adequate for regional-scale mineralogical analysis.
Data Preprocessing and Subsetting
To ensure optimal signal quality, two destriping procedures were used: a standard destriping routine and the THOR method to remove striping vertically. Spectral and spatial subsetting was then performed to remove noise bands, black edge effects, and non-relevant pixels. Preprocessing was critical in polar regions like Malapert, where signal degradation dominates. Final datasets typically retained 83 of the initial 85 spectral bands.
Hyperspectral Analysis Workflow
The analysis process used the Spectral Hourglass methodology to derive endmembers and mineral abundance map.
- Dimensionality Reduction: Minimum Noise Fraction (MNF) transformation was used to reduce data dimensionality without loss of variance. Most scenes had >90% of spectral variance in the first 3–6 MNF components.
- Endmember Extraction: Pixel Purity Index (PPI) found spectrally pure pixels spectrally, then plotted in the N-Dimensional Visualizer. PPI iterations and thresholds were tuned for each image (~10,000 iterations, threshold ~2.5) to identify stable endmember candidates.
- Spectral Classification: Linear Spectral Unmixing (LSU) and Spectral Angle Mapper (SAM) were applied. LSU provides sub-pixel abundance maps, and SAM offers angular similarity-based classification, illumination-variation resistance—critical for lunar landscapes.
- Spectral Library Comparison: Spectra were compared with laboratory reflectance standards of the RELAB database (NASA PDS, 2020) between 540–2990 nm. Target minerals: plagioclase, Ca-pyroxenes, ilmenite, and spinel
Mineral Identification Criteria
Diagnostic absorption features were identified by depth, asymmetry, and center wavelength. Continuum subtraction was used to detect key features, especially in space-weathered materials. After Suarez-Valencia et al. (2024), rigorous model selection was employed to minimize false positives.
- Pyroxenes show characteristic absorptions at 1000 and 2000 nm.
- Olivine exhibited a broad, asymmetric feature at 1000 nm.
- Spinel displays a prominent ~2000 nm band.
- Anorthosite and plagioclase exhibited low absorption near 1250 nm with high total reflectance.
- Troilite was characterized by flat, low-reflectance spectra with small features in the visible.
Results and Interpretation
The analysis confirms the geochemical diversity and ISRU interest in each of the four regions:
Aristarchus: Dominated by anorthositic highlands and central peak materials. Steep 1250 nm features in high-albedo spectra confirm plagioclase presence. Pyroxene-rich mare basalts (LCP and HCP) are present. Due to spectral overlap, the identification of spinel units remains inconclusive in this area. Detection of troilite attests to sulfur-bearing mafic lithologies.
Malapert: Near the South Lunar Pole, displays pairings of highland and mafic materials. High-Ca pyroxenes and pigeonite are present. A strong 2000 nm band confirms Mg-spinel. This region shows promise for oxygen extraction and construction resource use.
Mare Tranquillitatis: Includes high-Ti basalt and ilmenite-bearing units, close to the Dionysius crater. Spectral patterns suggest pyroclastic origins. Feldspathic breccias point to regolith mixing.
Leibnitz Crater (Far Side): Exposes diverse terrain including high-Ti basalts, pigeonite-bearing regolith, and highland anorthosites. The diversity is consistent with crustal excavation and impact mixing.
Conclusions and Outlook
This study demonstrates the capability of M3 hyperspectral data, laboratory spectra, and advanced spectral algorithms to detect and map key lunar minerals of potential interest for ISRU. Combining quantitative (LSU) and qualitative (SAM) methods enables robust mapping of mineralogical heterogeneity.The results confirm and augment the outcomes of previous missions (e.g., KAGUYA) and provide an extension of the investigation to less characterized and compositionally complex areas such as Leibnitz. Significant ISRU-related substances such as high-Ti basalts (for oxygen extraction), anorthosites (suitable for construction material), and sulfur-bearing mafic units (e.g., troilite) are found at multiple locations.
These findings provide a foundation for site selection for future crewed missions and infrastructure development on the Moon, supporting decision-making through validated remote sensing workflows and operational criteria.
REFERENCES
Martinot, M., Besse, S., Flahaut, J., Quantin-Nataf, C., Lozac’h, L., & van Westrenen, W. (2018). Mineralogical diversity and geology of Humboldt crater derived using Moon Mineralogy Mapper data. Journal of Geophysical Research: Planets, 123, 612–629. https://doi.org/10.1002/2017JE005435.
Mustard, J. F., et al. (2011), Compositional diversity and geologic insights of the Aristarchus crater from Moon Mineralogy Mapper data, J. Geophys. Res., 116, E00G12, doi:10.1029/2010JE003726.
NASA PDS (2020) – RELAB Spectral Library Bundle. NASA Planetary Data System, https://doi.org/10.17189/1519032.
Pieters C.M. et al. (2009) – The Moon Mineralogy Mapper (M³) on Chandrayaan-1. Curr. Sci., 96(4), 500–505.
Staid, M. I., et al. (2011), The mineralogy of late stage lunar volcanism as observed by the Moon Mineralogy Mapper on Chandrayaan‐1, J. Geophys. Res., 116, E00G10, doi:10.1029/2010JE003735.
Suárez‐Valencia, J. E., Rossi, A. P., Zambon, F., Carli, C., & Nodjoumi, G. (2024). MoonIndex, an open‐source tool to generate spectral indexes for the Moon from M3 data. Earth and Space Science, 11, e2023EA003464. https://doi.org/10. 1029/2023EA003464.
How to cite: Guth, C., Mancini, F., Allemand, P., Ori, G. G., and Salese, F.: Hyperspectral Mineral Mapping for Sustainable Lunar Exploration: Targeting ISRU Resources in Key Lunar Regions , EPSC-DPS Joint Meeting 2025, Helsinki, Finland, 7–13 Sep 2025, EPSC-DPS2025-945, https://doi.org/10.5194/epsc-dps2025-945, 2025.
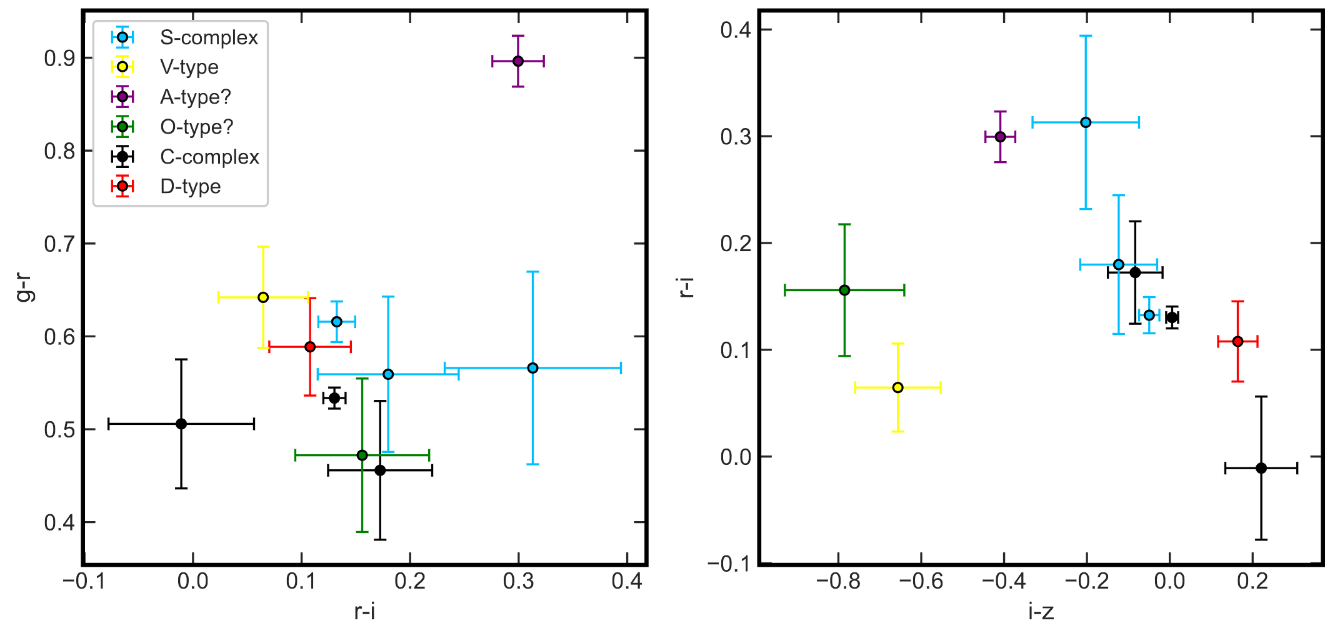
taxonomic class.
How to cite: Cantelas, R., Trilling, D., Chatelain, J., Erasmus, N., Lister, T., López-Oquendo, A., Moskovitz, N., and Thomas, C.: A Pilot Rapid-Response Project to Characterize Small Near Earth Objectswith LCO’s MuSCAT Instruments., EPSC-DPS Joint Meeting 2025, Helsinki, Finland, 7–13 Sep 2025, EPSC-DPS2025-997, https://doi.org/10.5194/epsc-dps2025-997, 2025.
Photometry measures the intensity of light from a source, most commonly used in optics and remote sensing, in order to analyze planetary surfaces and measure brightness, also known as reflectance. Reflectance is particularly important in lunar surface analysis because it offers valuable insights into surface composition and properties. The Planetary Surface Texture Laboratory (PSTL) is a facility at Johns Hopkins Applied Physics Laboratory that houses a goniometer system designed to improve the understanding of the polarization and photometric characterizations of planetary surface analog materials. This large arc system, (~1.5 meter radius), includes a sample stage and 2 caddies; one holds the polarimetric camera while the other holds the semi-collimated, unpolarized light. The phase angles range between 20° (at i = 40°) to 120° (at i = -60°) for this study; the camera (viewing angle) remains constant as the light source moves throughout the data collection.
The reflectance of a material varies with the photometric conditions and is a function of properties such as particle size, porosity, roughness, and internal particle scattering behavior. The overall albedo and color of a surface may vary with the phase geometry (angles between the light source and the detecting optics). This is of particular importance because of the extreme viewing geometries encountered at the lunar south pole.
Lunar Simulant Evaluation
The availability and use of lunar regolith simulants is crucial for future lunar missions and understanding how to support a sustainable presence on the surface. When using lunar simulants, we have to keep in mind that the simulants are approximations and do not possess all the same characteristics of lunar regolith. However, understanding how lunar simulants differ spectrally from lunar regolith by observing the optical properties is important for providing crucial information about the composition, application, and formation history of the Moon.
We assessed 12 different lunar regolith simulants from 5 different simulant provider companies; Colorado School of Mines (CSM), Off Planet Research, Space Resource Technologies (previously Exolith), NASA/United States Geological Survey (USGS) and Deltion, (4 based in the United States, 1 based in Canada, respectively). These simulants included representation for dust, mare, nearside and farside highland regolith.
Our preliminary analysis shows that the composition of these simulants has an effect on the reflectance behavior. All of the highland simulants have a higher overall reflectance than the mare simulants. This is because the majority of minerals that make up the lunar highland simulants is largely plagioclase, which absorb little light, causing a higher reflectance. While the majority of minerals that make up the lunar mare simulants is largely olivine and pyroxene, which absorbs more light, causing a lower reflectance. Any variation in reflectance as a function of phase angle can be attributed to several factors such as albedo, composition, and physical properties including the scattering behavior of the individual particles, and porosity.
We also collected measurements of samples that were prepped differently in order to show similarities to actual lunar terrains (as viewed from an Earth-based telescope or from orbit). Typically, to understand the full reflectance range of the material, our samples are prepped with a smooth surface. We also prepared a textured sample that was randomly chopped until it had the same depth as the sample holder. As expected, the contrasting degree of shadowing between a smooth and a rough surface can be seen. The textured sample has a rougher surface, therefore, has more micro-shadowing, causing the textured surface to be darker than the smooth surface. The effect is most pronounced in forward scattering conditions (i.e., large phase angles, >90°).
Overall, our initial findings produced expected results, although a more detailed study is underway. In general, these simulants can provide a means for developing in-situ resource utilization technologies, lunar soil testing, extraction, construction, and astronaut trainings. We can also use this data to improve remote sensing techniques and calibrate upcoming mission instruments to refine photometric simulations. Being able to provide a framework for improved interpretations of phase and polarimetric observations of planetary surfaces would ultimately be beneficial for future planetary studies.
How to cite: Martin, A., Magana, L., and Blewett, D.: Planetary Surface Texture Laboratory: Polarimetric Investigation of Lunar Regolith Simulants, EPSC-DPS Joint Meeting 2025, Helsinki, Finland, 7–13 Sep 2025, EPSC-DPS2025-1168, https://doi.org/10.5194/epsc-dps2025-1168, 2025.
Introduction
The amidogen (NH2) radical is a widely found species in the coma of comets. It is believed to be primarily produced through the photodissociation of ammonia (NH3) as parent species by the solar ultraviolet radiation. The presence of ammonia in comets serves as a crucial indicator of the first molecules formed in the protosolar nebula, reflecting the primordial conditions of the early Solar System. NH3, together with H2O, CH4, CO and CO2, is believed to be one of the first ices formed on the surface of dust grains in the presolar nebula (Watanabe & Kouchi 2008).
Detecting ammonia (NH3) in comets remains challenging. In the radio domain, its inversion transitions near 24 GHz have been firmly detected only in a few cases, such as comets C/1996 B2 (Hyakutake) and C/1995 O1 (Hale-Bopp) (Palmer et al. 1996; Bird et al. 1997), due to beam dilution and sensitivity limits. In the infrared, rovibrational transitions around 3 µm offer a favourable window, though atmospheric absorption and line blending with other species often interfere with clear identification. In contrast, NH2,
the primary photodissociation product of NH3, emits strongly in the optical range (4000–8000 Å), and is commonly used as a proxy for ammonia in cometary comae, assuming it originates solely from NH3 photolysis (Tegler & Wyckoff 1989). After formation, NH2 radicals are excited by solar radiation and
decay via fluorescence. Fluorescence models generally assume equilibrium conditions in an optically thin coma, where collisional effects near the nucleus are negligible (Tegler & Wyckoff 1989; Kawakita et al. 2001; Kawakita & Watanabe 2002). Under these assumptions, NH2 emission can be reliably used to
infer ammonia abundance.
Aim
In the current literature, there are relatively few studies on NH2 fluorescence models, and these are confined to specific spectral regions at a time (Kawakita & Watanabe 2002; Kawakita & Mumma 2011), leaving gaps in the overall understanding of NH2 fluorescence behaviour across broader ranges.
The starting point of this study is to develop a comprehensive and improved fluorescence model for NH2, aiming to provide a unified framework for the calculation of fluorescence efficiencies (g-factors) for multiple bands, offering a more complete and consistent approach to NH2 fluorescence analysis.
One of the drivers behind revising the current understanding of the spectroscopic behaviour of NH2 is the presence of numerous unidentified features in high-resolution cometary spectra (Brown et al. 1996; Cremonese et al. 2007; Cambianica et al. 2021). In particular, high-resolution spectra of comet
NEOWISE (Cambianica et al. 2021) revealed a considerable number of unidentified lines. These lines are typically confined to specific regions of the spectrum, suggesting that they may originate from the same species. Since other known radicals, such as CN and C2, already have well-established models for line positions and fluorescence efficiency (Rousselot et al. 2000; Tanabashi et al. 2007; Schleicher 2010; Brooke et al. 2014), it is unlikely that these unidentified features belong to them. As a result, NH2 remains a promising candidate for resolving some uncertain line assignments. A detailed re-analysis of
existing NH2 spectroscopic data, along with a revision of the current fluorescence models, is necessary to explore this possibility.
Methods
The treatment of fluorescence equilibrium equations is based on the methodology implemented in the Python code FlorPy (Bromley et al. 2024). FlorPy is a valuable tool for solving these equations, and allows the computation of fluorescence efficiencies (g-factors) for individual transitions, if the line positions and Einstein coefficients are known.
This activity has prompted the authors to improve the spectroscopic study of the NH2 radical by re-analising the vast but rather sparse data collection present in the literature (Hadj Bachir et al. 1999; Huet et al. 1996; Dressler & Ramsay 1959; Ross et al. 1988).
For this purpose, we will use the PGOPHER program (Western 2017), a tool widely employed for spectral fitting of many molecular species. Such comprehensive treatment of the NH2 radical will culminate in a complete set of g-factors for cometary abundance retrieval. This approach would make a significant contribution in terms of the accuracy of the g-factors calculation, though it also introduces several complications.
As a matter of fact, NH2 is a triatomic radical with an open-shell electronic configuration (Dressler & Ramsay 1957). In its electronic ground state (X2B1), it is bent and behaves as a regular semi-rigid asymmetric top. The first excited state exhibits a quasi-linear configuration and it features a strong vibronic coupling between the electronic angular momentum and vibrational angular momentum produced by the linear (doubly degenerate) bending motion. This coupling is labelled as Renner-Teller effect and breaks down the Born-Oppenheimer approximation, making the usual formalism for the computation of ro-vibrational energies no longer applicable (Renner 1934).
The PGOPHER tool operates within the frame of the Born-Oppenheimer approximation, i.e. by postulating a clear separation between electronic and ro-vibrational energies. Still, it can be used for problematic cases, as of NH2, by adopting the approach of effective fits, i.e. by separating the overall spectrum in independent subbands, for which specialised Hamiltonians are able to "effectively" reproduce the observed line positions within experimental accuracy. If properly adopted, this approach can provide a set of spectroscopic parameters which, if difficult to interpret in the usual manner, do have good spectral predictive capability within the range of energies actually sampled by the analysis.
Conclusions
This work presents a new approach to the analysis of the NH2 radical, currently under development. It focuses on its fluorescence mechanisms and the computation of g-factors for individual transitions. The development of a self-consistent model for NH2 would significantly enhance the accuracy of abundance calculations in cometary environments and contribute to a deeper understanding of molecular spectroscopy in comets. However, this approach also presents challenges, particularly concerning the Renner-Teller effect, which will require further refinement of existing models. Despite these complications, the work is expected to improve the current understanding of NH2 radical fluorescence mechanism in cometary comae.
How to cite: Mura, A., La Forgia, F., Cremonese, G., Bizzocchi, L., Lazzarin, M., Kawakita, H., Cambianica, P., Kobayashi, H., Melosso, M., Munaretto, G., Puzzarini, C., Shinnaka, Y., and Tsujimoto, K.: Fluorescence Modelling and Spectroscopic Analysis of the NH2 Radical inCometary Environments , EPSC-DPS Joint Meeting 2025, Helsinki, Finland, 7–13 Sep 2025, EPSC-DPS2025-1190, https://doi.org/10.5194/epsc-dps2025-1190, 2025.
Understanding processes related to volatiles and minerals on the Moon is important for constraining its surface origins and evolution. To better comprehend the history of lunar volatiles, including their delivery and transport, knowledge of regolith composition is needed. Additionally, space weathering embeds iron metal particle by-products into grain rims of the surface regolith in a ubiquitous manner. Therefore, quantifying this iron in lunar samples helps us understand space weathering effects on the Moon and across the inner Solar System (Noble et al., Icarus, 2007; Veres et al., 56th LPSC, 2025).
Raman Spectroscopy is an established technique for studying planetary samples and simulants. We present Raman spectroscopic measurements of various Apollo samples and synthetic analogs, providing further insight and confirmation into their mineralogical and volatile composition and abundance, and underscoring the effectiveness of Raman spectroscopy in advancing planetary science.
The simulants and synthetic analogs we measured include two suites of synthetic nanophase iron-infused silica gel samples from Noble et al. (2007), a synthetic mare sample analog for the Apollo 17 site, Apollo regolith samples 10084 and 15041, and the Apollo rock sample 14310.
Measurements were taken with laser excitation wavelengths of 532 nm and 785 nm, and multiple measurements were taken at different locations on certain samples. After data processing methods such as noise reduction and normalization were completed, the Raman peak shifts were identified for corresponding mineral presence and cross-compared with previous compositional studies. A selection of resulting Raman shift spectra is shown in Figure 1.
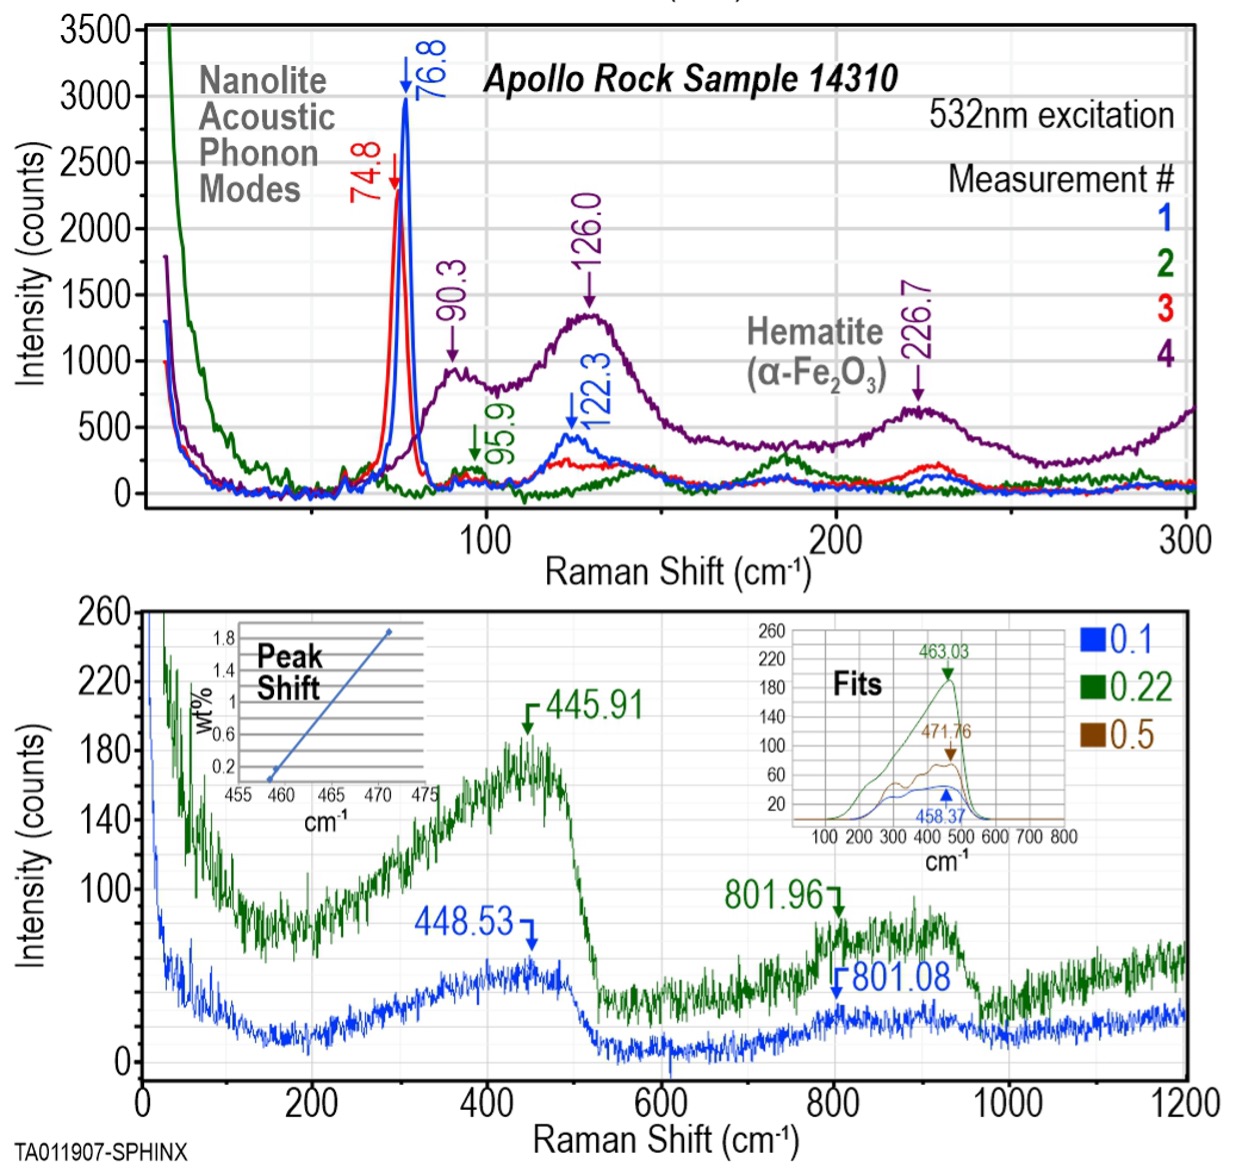
Figure 1. (top) Raman shift spectra of Apollo rock sample 14310, showing phonon mode and hematite peaks. (bottom) Raman shift spectra of silica gel samples SG50.1 and SG50.22. Insets show corresponding Gaussian-Lorentzian fits and wt%-peak shift relationship.
How to cite: Veres, B. E., Retherford, K. D., Miller, M. A., Blase, R. C., Bueno, P. C., Cahill, J. T. S., Molyneux, P. M., Moore, T. Z., Poston, M. J., Raut, U., Schwenzer, S. P., Stevanovic, A., Stockstill-Cahill, K. R., and Whizin, A. D.: Raman Spectroscopic Analysis of Lunar Samples and Synthetic Analogs, EPSC-DPS Joint Meeting 2025, Helsinki, Finland, 7–13 Sep 2025, EPSC-DPS2025-1236, https://doi.org/10.5194/epsc-dps2025-1236, 2025.
Atmosphereless Solar System objects (SSOs), such as asteroids, exhibit special features in the way they scatter unpolarized incident sunlight: mainly, the nonlinear increase in brightness at small phase angles (the angle between the Sun and the observer seen from the object, α) and the negative surge in the degree of linear polarization at α ≤ 30°. The phenomena are likely due to the surface regolith consisting of closely packed small particles.
In order to examine the features, first we have modelled the photometric and polarimetric phase curves of lunar observations with a novel version of the radiative-transfer coherent-backscattering (RT-CB) algorithm developed by Muinonen et al. [1] using the empirical scattering matrix of the dark lunar regolith simulant JSC-1A [2], for which the matrix elements have been parametrised [3] (Figure 1).


Figure 1: The photometric phase curve of the Moon from observations by Rougier [4] and averaged by Bowell et al. [5] (left figure, red dots) and the polarimetric phase curve of the waning Moon by Lyot [6] (right figure, red dots) modelled with the RT-CB algorithm using the parametrised empirical scattering matrix of the JSC-1A regolith simulant. The resulting modelled curves (blue line) were computed with 1 million rays, with a mean-free-path length of 5 μm and a single-scattering albedo of 0.723.
Furthermore, we have measured the intensity and the linear polarization of a flat surface of the JSC-1A containing particles smaller than 106 μm at zenith incidence angles 0° to 70° and zenith emergence angles −80° to 80° with the spectrogoniometer at the University of Helsinki Astrophysical scattering laboratory. We will similarly measure a brighter substance for the purpose of mimicking a higher-albedo asteroid, and present RT-CB modelling results for both materials.
[1] K. Muinonen, A. Leppälä, J. Markkanen, JQSRT 330, (2025).
[2] O. Muñoz, E. Frattin, J. Martikainen et al., JQSRT 331, (2025).
[3] K. Muinonen, A. Leppälä, in preparation, (2025).
[4] G. Rougier, Ann. Obs. Strasbourg 2, (1933).
[5] E. Bowell et al., Asteroids II, (1989).
[6] B. Lyot, PhD. Thesis, (1929).
How to cite: Pentikäinen, H., Penttilä, A., Muinonen, K., Leppälä, A., and Vuori, M.: Polarimetric and photometric modelling of regolith simulants, EPSC-DPS Joint Meeting 2025, Helsinki, Finland, 7–13 Sep 2025, EPSC-DPS2025-1533, https://doi.org/10.5194/epsc-dps2025-1533, 2025.
Introduction
Barbarian asteroids represent a unique group of objects that exhibit a broad negative branch in their polarization phase curves. They are named after (234) Barbara, the first asteroid for which such behaviour was observed [1], and are primarily classified within the L taxonomic class. Since magnitude–phase (mag–phase) curves are sensitive to the surface properties of asteroids, we aim to derive such relations for a number of Barbarian asteroids to determine whether they also display anomalous behaviour in this respect.
To date, we have presented results for (599) Luisa and (729) Watsonia [2], as well as for (234) Barbara, (236) Honoria, and (980) Anacostia [3]. These studies show that, except for Honoria, the other four objects occupy a distinct position on the G₁–G₂ plot, where G₁ and G₂ are the coefficients of the [H, G₁, G₂] phase function. At the upcoming conference, we will present results for (387) Aquitania, for which the observing campaign is still ongoing.
Observing Campaign
Previous observations of Barbarian asteroid lightcurves were conducted using multiple telescopes with different photometric systems. While the geographic distribution of these telescopes (at different longitudes) facilitated full rotation-phase coverage in the composite lightcurve, it also introduced systematic biases in the transformation of photometric data. To mitigate this issue, we conducted observations of Aquitania using a single instrument: our 0.7-m robotic telescope at Winer Observatory (Arizona), equipped with Johnson R and Pan-STARRS g, r, i, z filters.
This approach allows us to collect data in a consistent and well-defined photometric system. However, it has one drawback: the rotation period of Aquitania is 24.144 hours, requiring a long observational window to achieve full phase coverage. Consequently, the campaign is ongoing (planned through the end of May 2025), and we will present final results at the conference.
Colour Indices of Aquitania at Different Phase Angles
To derive the most accurate mag–phase curves, it is necessary to account for: (1) lightcurve amplitude effects (addressed by aligning partial lightcurves to a reference composite lightcurve), (2) aspect angle effects (corrected by normalizing average magnitudes to a 90° aspect), and (3) the dependence of mag–phase behaviour on wavelength (minimized by using a consistent photometric band). In our study, we account for point (1), but not for (2), as we compare our G₁ and G₂ parameters with those reported by Shevchenko et al. (2016) [4], who did not normalize their data to a 90° aspect.
However, Shevchenko et al. used Johnson V-band data, whereas our results are based on the Johnson R band. Therefore, we must consider potential biases introduced by the wavelength dependence (3).
Starting from Aquitania’s opposition in January 2025, we performed observations not only in the R band, but also in the Pan-STARRS g, r, and i bands (the V filter was unavailable). Our aim was to quantify the bias that may arise when comparing mag–phase curves obtained in different bands, and to derive a correction equation. Figures 1–3 show the relationship between the (g–R), (g–r), and (g–i) colour indices and solar phase angle. Red lines indicate the least-squares weighted linear fits. In all three cases, the Pearson correlation coefficient is statistically significant, confirming the validity of the linear relationship. Quadratic fits did not improve the results.
The slope parameters and their 1σ uncertainties are:
- g–r: slope = 0.0030 ± 0.0004
- g–R: slope = 0.0017 ± 0.0004
- g–i: slope = 0.0026 ± 0.0005
It is worth noting that the result for the g–R colour may be biased, as the asteroid magnitudes were calibrated using solar analogue stars from the Pan-STARRS catalogue. The R magnitudes of these stars were obtained via additional transformations. When considering only g–r (136 nm effective wavelength difference) and g–i (270 nm difference), the slope coefficients are nearly identical. In contrast, the slope for r–i (135 nm difference) is effectively zero (0.0002 ± 0.0006), suggesting that wavelength effects are more pronounced at shorter wavelengths. This is compatible with the overall trend that phase dependence gradually weakens with wavelength [5].
We will investigate how this wavelength dependence influences the G₁ and G₂ parameters of the mag–phase relations for Barbarian asteroids.
References
- [1] Cellino, A., et al. (2006) Icarus, 180, 565
- [2] Mykhailova, S, et al. (2023) ACM Conference, Flagstaff, Arizona. LPI Contribution No. 2851, 2023, id. 2202
- [3] Kwiatkowski, T., et al (2024) EPSC Abstracts Vol. 17, EPSC2024-858, 2024, https://doi.org/10.5194/epsc2024-858
- [4] Shevchenko, V. G., et al. (2016). Planetary and Space Science, 123, 101
- [5] Alvarez-Candal, A. et al. (2024) A&A 685, A29
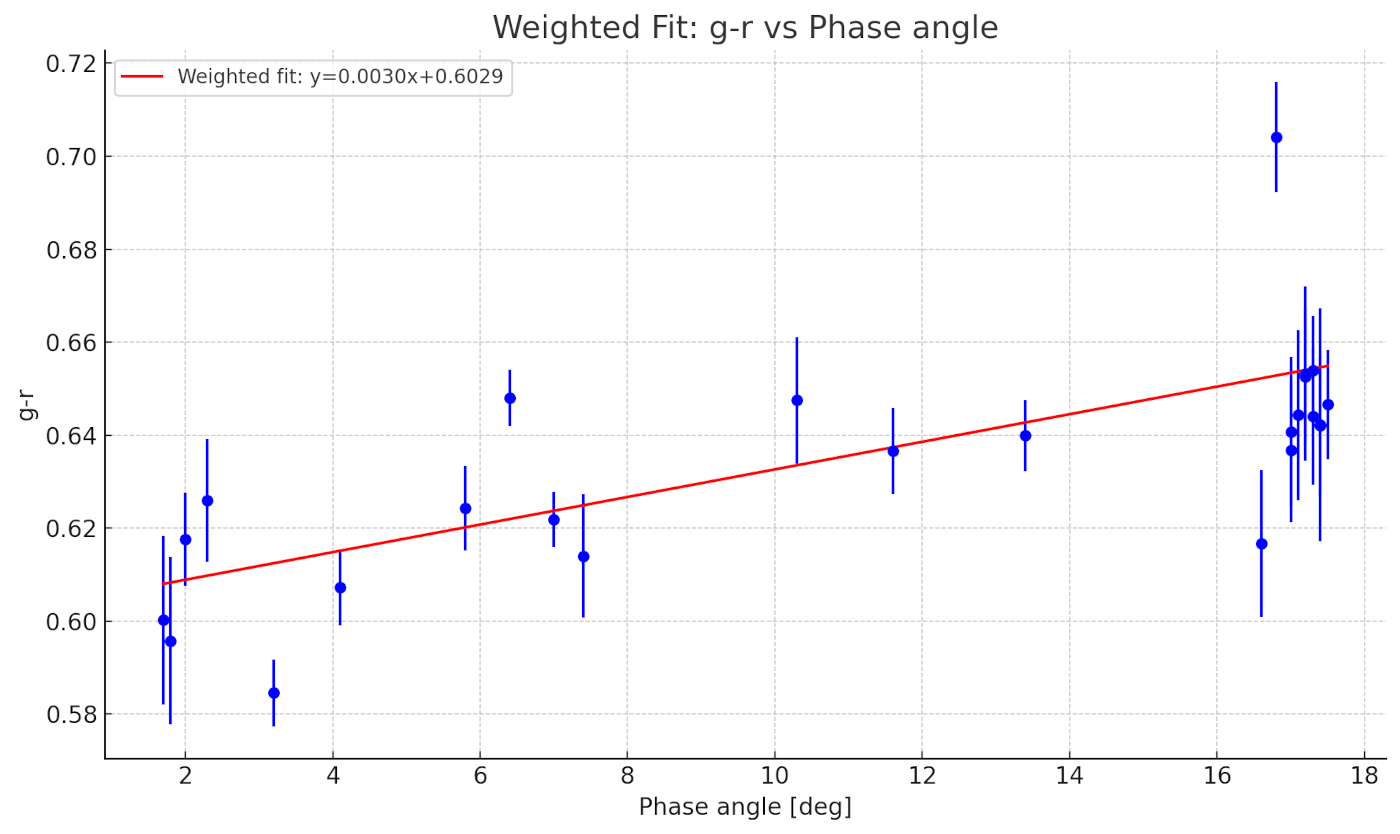
Fig. 1. Dependence of (g-r) on the phase angle.
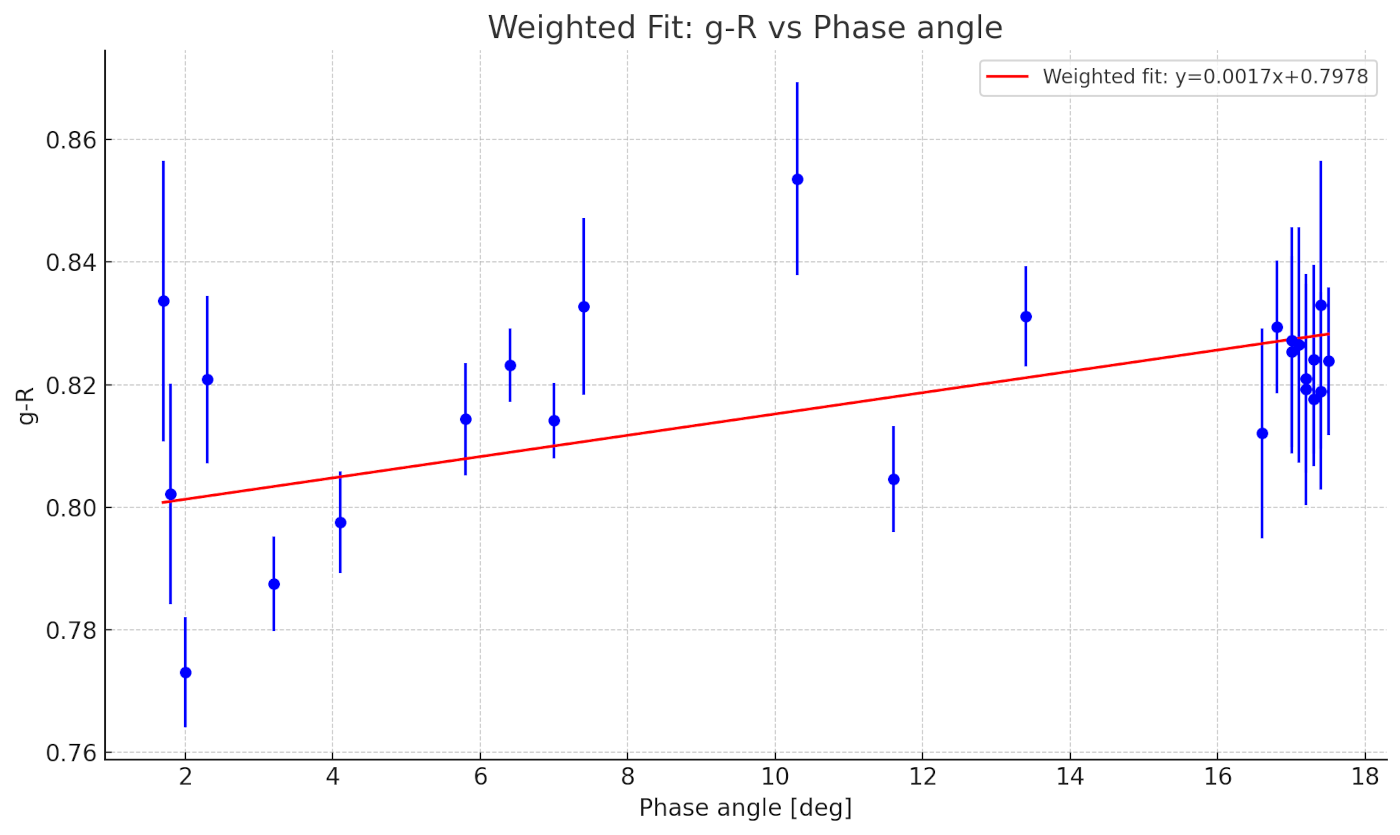
Fig. 2. Dependence of (g-R) on the phase angle.
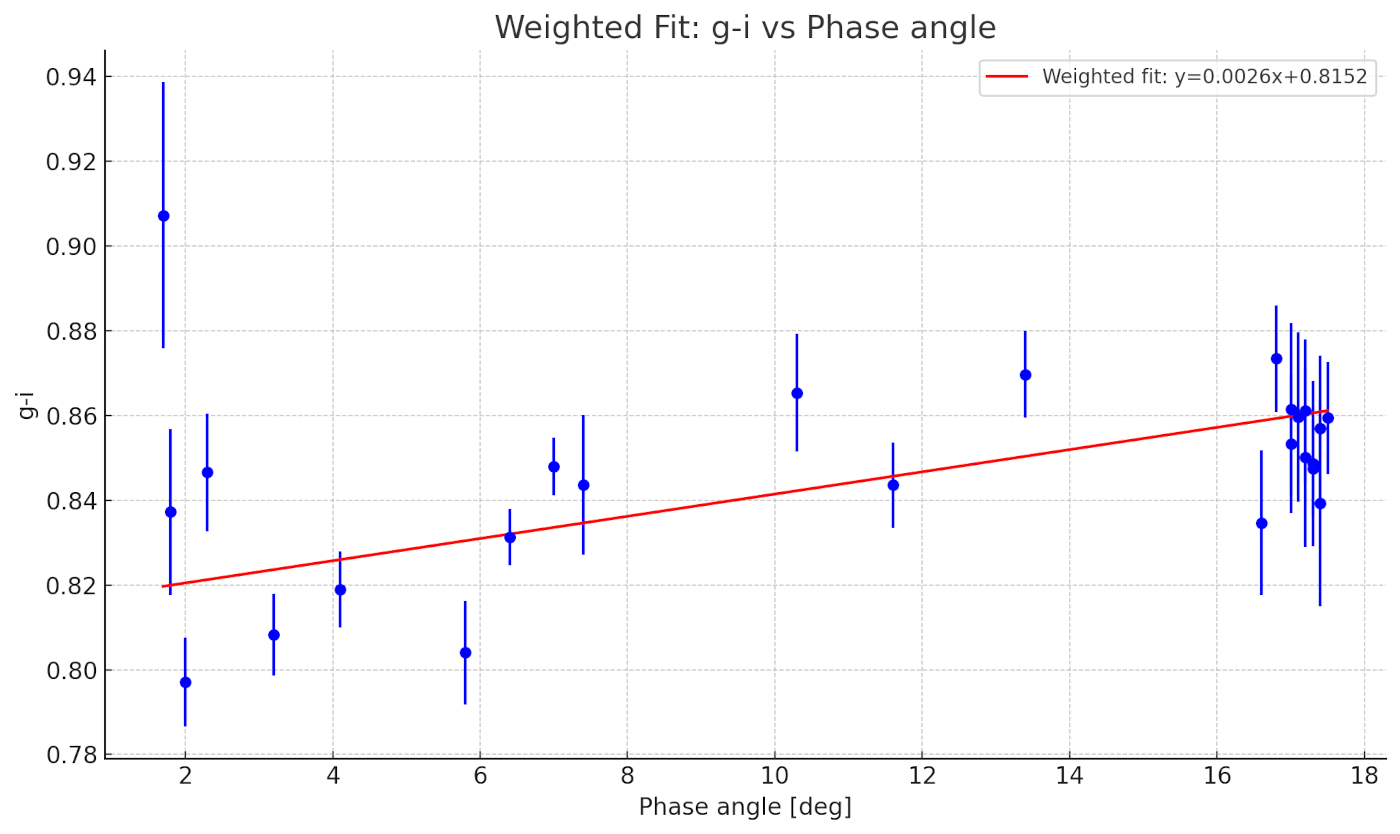
Fig. 3. Dependence of (g-i) on the phase angle.
How to cite: Kwiatkowski, T., Mykhailova, S., and Kamiński, K.: Magnitude–Phase Curves of the Barbarian Asteroids: The Case of (387) Aquitania, EPSC-DPS Joint Meeting 2025, Helsinki, Finland, 7–13 Sep 2025, EPSC-DPS2025-1596, https://doi.org/10.5194/epsc-dps2025-1596, 2025.
Data alignment and fusion are crucial steps in exploiting complementary data from different satellites. In planetary science, and particularly in remote sensing, the majority of data are not correctly aligned due to inaccuracies in sensor location. This makes merging and joint analysis imprecise and time-consuming, as planetary scientist have to correct these alignments manually. Existing alignment algorithms are designed for feature-rich data and pairwise alignment. The present study considers the case of Digital Terrain Models (DTMs), which are 3D data formats where elevation information is derived from a pair of 2D photogrammetric observations. This 3D information provides additional information useful for alignment. However, existing 3D alignment algorithms still suffer from the above-mentioned limitations with this data. The aim of this study is to develop a method to automatically align rigidly an arbitrary number of DTMs while producing a topographic model that fuses their information. We introduce a self-adaptive envelope, coupled to DTMs, whose role is both to produce a high resolution topographic model and to direct the alignment of the DTMs to a common reference.
How to cite: Brun, L., Paiement, A., Doute, S., and Bernard Salas, J.: Alignment and fusion of digital terrain models : case study of planetary surfaces, EPSC-DPS Joint Meeting 2025, Helsinki, Finland, 7–13 Sep 2025, EPSC-DPS2025-1613, https://doi.org/10.5194/epsc-dps2025-1613, 2025.
Introduction
The spin period is essential for asteroid studies: it underpins the determination of surface thermal properties (Delbo et al., 2015; Hung et al., 2022; Novaković et al., 2024), internal structures (Rozitis et al., 2014; Fodde & Ferrari), and modeling non-gravitational effects (Yarkovsky, YORP; Vokrouhlický et al., 2015; Fenucci & Novaković, 2022). All these are also highly relevant for planetary defense-related studies.
Rotation periods have been derived from light curves built from photometric observations and fall into dense (high-cadence) or sparse (survey) regimes. Dense photometry—targeted runs over 2–3 nights—yields reliable periods but is limited by telescope-time demands. For these reasons, until recently, the number of asteroids with determined rotation periods was limited. However, reducing sparse photometry data requires additional steps (e.g., corrections for changes in observational geometry). Generally, it makes the rotation period extraction more challenging and less reliable.
The so-called super-fast rotators (SFRs) are objects rotating faster than the cohesionless “spin barrier” at 2.2 hr (Pravec & Harris, 2000). They are especially interesting to study, but are even more prone to misidentification in sparse data (Warner & Harris, 2011). To enhance our understanding of SFRs, it is essential to reliably obtain their periods using dense photometry. In this respect, the SFR candidates identified from sparse data are good starting points. For this reason, we initiated a long-term monitoring program of SFRs candidates. The first part of our campaign targeted 15 SFRs candidates to verify their rotation periods via high-precision dense photometry.
Targets and Equipment
The targets are selected according to the results obtained by Waszczak et al. (2015), Erasmus et al. (2018, 2019), Pal et al. (2020), and Chang et al. (2014, 2022). All these are SFR candidates identified based on the sparse photometry data. Figure 1 shows the spin period of asteroids as a function of the diameter, taken from the Asteroid Lightcurve Database (LCDB; Warner et al., 2009). Our targets are possibly located approximately inside the box.
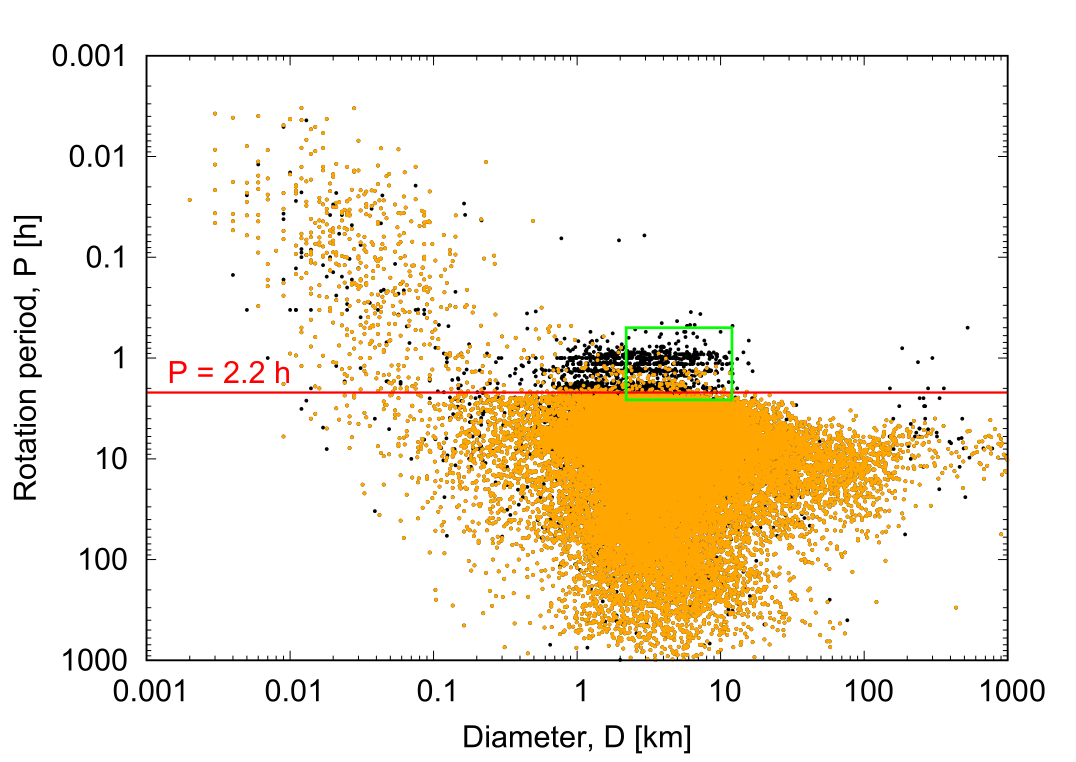
The observations were performed from Observatorio de Sierra Nevada (OSN) and the Astronomical Station of Vidojevica (ASV). Table 1 provides additional information about the equipment.
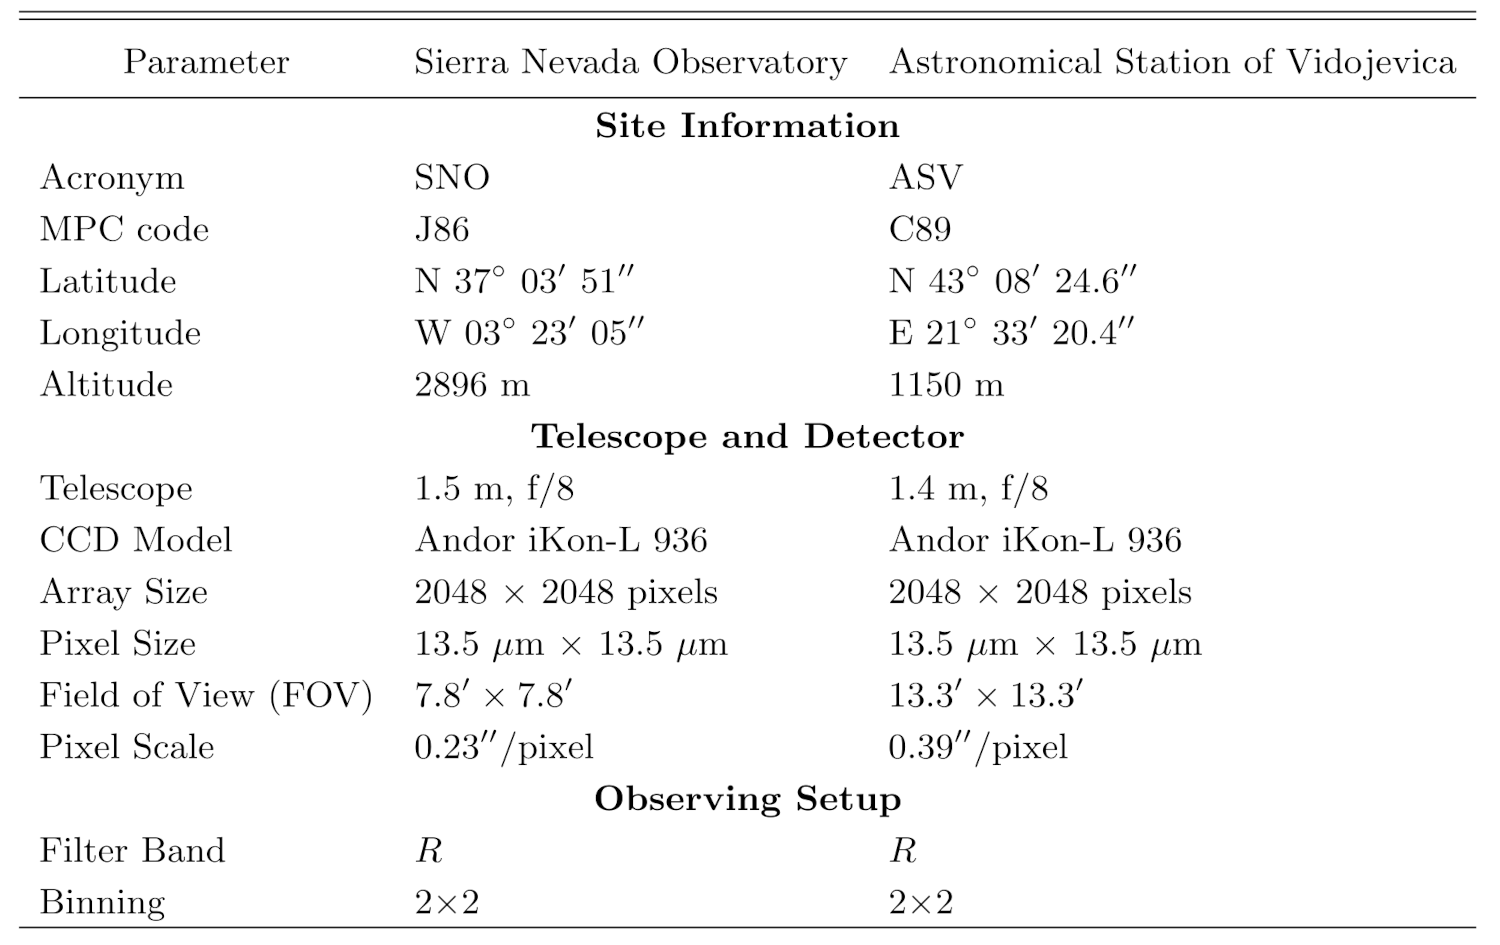
Methods
The image processing, measurement, and period analysis were done using procedures incorporated into the Tycho Tracker software (Parrott, 2020). All raw images underwent bias and flat-field corrections (ASV images were also dark-corrected). Aperture photometry was calibrated against the ATLAS All-Sky Stellar Catalog (Tonry et al., 2018). We fitted the 2nd–6th order Fourier series to determine double-peaked periods and amplitudes; uncertainties came from Monte Carlo resampling. Observing circumstances are in Table 2.
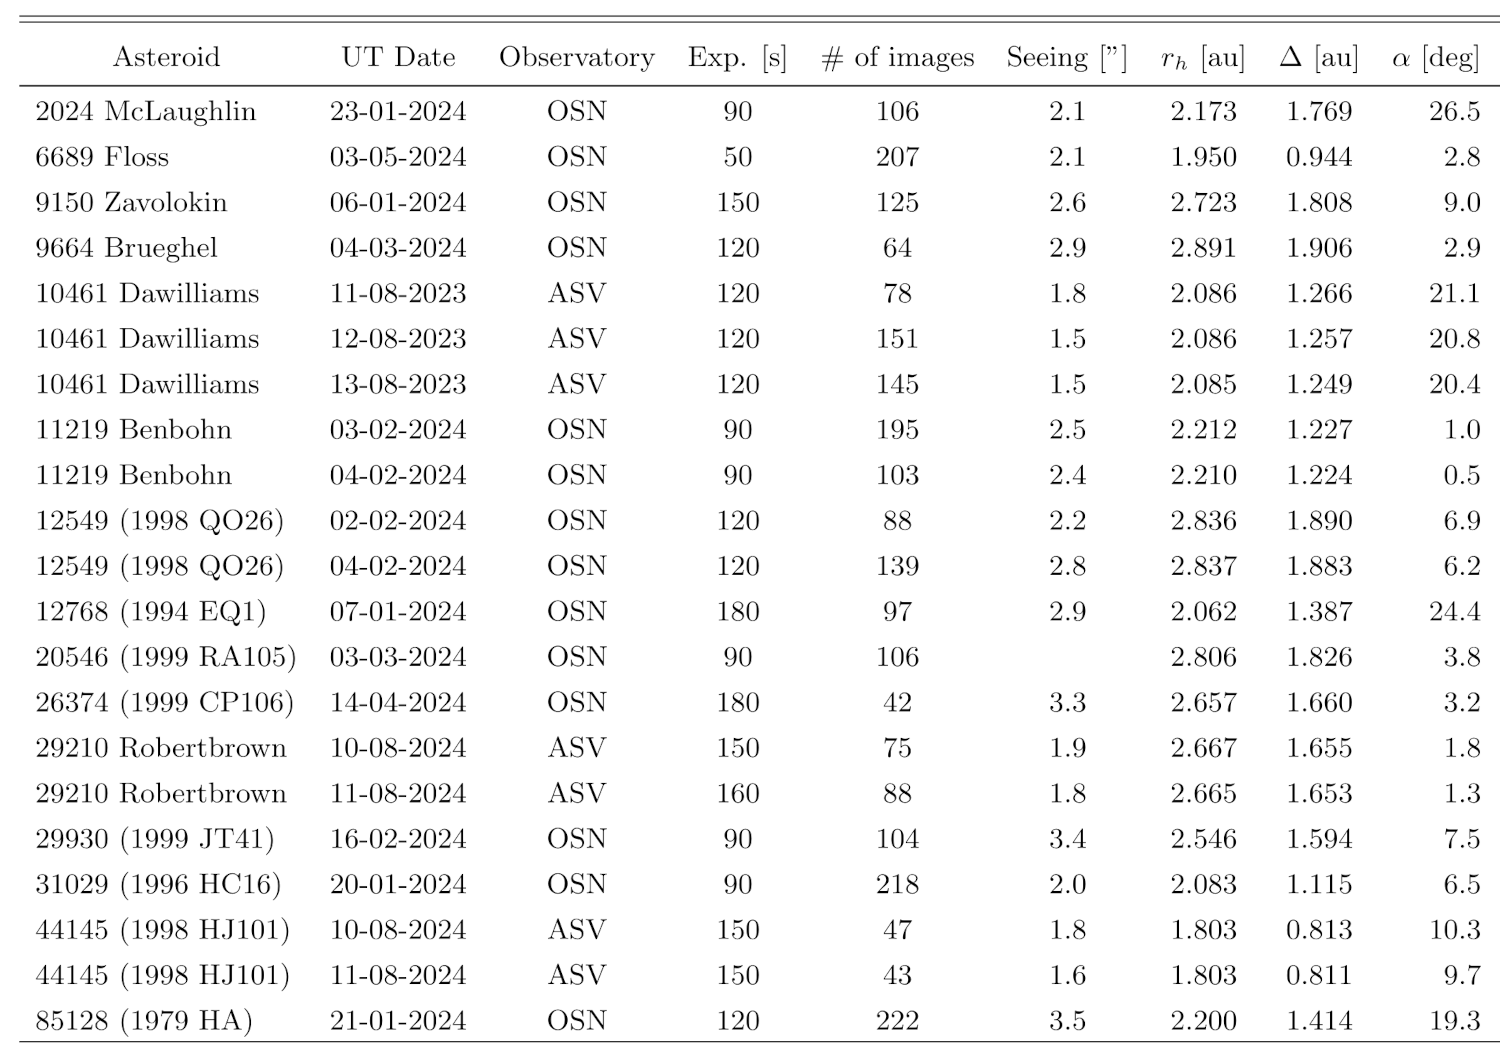
Resuts
Rotation periods were secured for 12 of the 15 targets. Only four literature values were confirmed; three of these—(2024) McLaughlin, (31029) 1996 HC16 (shown in Fig. 2), and (44145) 1998 HJ101—remain bona fide SFRs. We measured longer periods for the other eight asteroids, excluding them as SFRs. This underscores the need for dense photometry follow-up to validate SFR candidates.

Acknowledgments
BN acknowledges support by the Science Fund of the Republic of Serbia, GRANT No 7453, Demystifying enigmatic visitors of the near-Earth region (ENIGMA). Observations were made at the Observatorio de Sierra Nevada, operated by the Instituto de Astrofı́sica de Andalucı́a, and Astronomical Station of Vidojevica, operated by the Astronomical Observatory of Belgrade.
References
Chang, C.-K. and 12 colleagues 2014. 313 New Asteroid Rotation Periods from Palomar Transient Factory Observations.
ApJ, 788. doi:10.1088/0004-637X/788/1/17
Chang, C.-K. and 14 colleagues 2022. The Large Superfast Rotators Discovered by the Zwicky Transient Facility. ApJ, 932. doi:10.3847/2041-8213/ac6e5e
Delbo, M., Mueller, M., Emery, J.P., Rozitis, B., & Capria, M.T. 2015, Asteroid Thermophysical Modeling, 107–128, Asteroids IV, (University of Arizona Press)
Erasmus, N., McNeill, A., Mommert, M., Trilling, D.E., Sickafoose, A.A., van Gend, C. 2018. Taxonomy and Light-curve Data of 1000 Serendipitously Observed Main-belt Asteroids. ApJSS, 237. doi:10.3847/1538-4365/aac38f
Erasmus, N., McNeill, A., Mommert, M., Trilling, D.~E., Sickafoose, A.~A., Paterson, K. 2019. A Taxonomic Study of Asteroid Families from KMTNET-SAAO Multiband Photometry. ApJSS, 242. doi:10.3847/1538-4365/ab1344
Fenucci, M., Novakovic, B. 2022. MERCURY and ORBFIT Packages for Numerical Integration of Planetary Systems: Implementation of the Yarkovsky and YORP Effects. SerAJ, 204, 51–63. doi:10.2298/SAJ2204051F
Fodde, I., Ferrari, F. 2025. Dynamical modelling of rubble pile asteroids using data-driven techniques. A&A 695. doi:10.1051/0004-6361/202452432
Hung, D., Hanus, J., Masiero, J.~R., Tholen, D.J. 2022. Thermal Properties of 1847 WISE-observed Asteroids. PSJ, 3. doi:10.3847/PSJ/ac4d1f
Novakovic, B., Fenucci, M., Marceta, D., Pavela, D. 2024. ASTERIA-Asteroid Thermal Inertia Analyzer. PSJ, 5. doi:10.3847/PSJ/ad08c0
Pal, A. and 12 colleagues, 2020. Solar System Objects Observed with TESS--First Data Release: Bright Main-belt and Trojan Asteroids from the Southern Survey. ApJSS, 247. doi:10.3847/1538-4365/ab64f0
Parrott, D. 2020, Tycho Tracker: A New Tool to Facilitate the Discovery and Recovery of Asteroids using Synthetic Tracking and Modern GPU Hardware. JAVSO, 48, 262.
Polishook, D. 2013, Minor Planet Bulletin, 40, 42
Pravec, P., Harris, A.W. 2000. Fast and Slow Rotation of Asteroids. Icarus 148, 12–20. doi:10.1006/icar.2000.6482
Rozitis, B., Maclennan, E., Emery, J.P. 2014. Cohesive forces prevent the rotational breakup of rubble-pile asteroid (29075) 1950 DA. Nature 512, 174–176. doi:10.1038/nature13632
Tonry, J.L. and 8 colleagues 2018. The ATLAS All-Sky Stellar Reference Catalog. ApJ, 867. doi:10.3847/1538-4357/aae386
Vokrouhlicky, D., Bottke, W.F., Chesley, S.R., Scheeres, D.J., & Statler, T.S. 2015, The Yarkovsky and YORP Effects, 509–531, Asteroids IV, (University of Arizona Press)
Warner, B.D., Harris, A.W., Pravec, P. 2009. The asteroid lightcurve database. Icarus 202, 134–146. doi:10.1016/j.icarus.2009.02.003
Warner, B.D., Harris, A.W. 2011. Using sparse photometric data sets for asteroid lightcurve studies. Icarus 216, 610–624. doi:10.1016/j.icarus.2011.10.007
How to cite: Novakovic, B. and Gutiérrez, P.: Monitoring super-fast rotating asteroid candidates, EPSC-DPS Joint Meeting 2025, Helsinki, Finland, 7–13 Sep 2025, EPSC-DPS2025-1666, https://doi.org/10.5194/epsc-dps2025-1666, 2025.
Very small asteroids with diameters smaller than around 200 m, although they constitute the majority of objects in the immediate vicinity of the Earth, we still know little about their mineralogical composition (important for assessing impact hazards and better understanding larger asteroids - rubble piles as their potential building blocks) and the behaviour of their rotation axes (being small and relatively close to the Sun, they are good candidates for testing theories of non-gravitational effects such as the YORP and Yarkovsky effects).
Since 2015, we have been conducting campaigns of photometric observations of very small near-Earth asteroids, especially with a very long observation arc in order to determine their physical properties from a single near-Earth flyby. We determine the rotation periods, colour indices, taxonomic types, absolute brightnesses from the phase curves, effective diameters, and spin axis. Examples of our results:[1],[2],[3].
Between 2024-10-01 and 2024-10-12 we observed a very small asteroid 2020~WG (H=21.64 +/- 0.40 mag [4]). The work is still in progress. Here we want to present some of the preliminary results.
We used observations in griz filters to determine the taxonomic type.
The first such observations were made by the 0.6-m REM telescope in La Silla (Chile). It is one of the few telescopes that can simultaneously observe in 4 filters. Comparison of brightnesses made simultaneously eliminates the influence of rotation and change of observation geometry on the colour index results. Unfortunately, we obtain only a few useful observation points, hence the relatively high measurement uncertainty, see Table 1.
Our main instrument, the 0.7-m RBT telescope in Arizona, made 30-s exposures. Observations were divided into 3 blocks to determine g-r, g-i, and g-z, respectively. In each block, exposures were alternately made in the g filter and one of the other filters. This technique minimizes the influence of rotation and changes in the observation geometry on the obtained results. We obtained the shifts of the lightcurves in the different bands by compositing the lightcurves using the PerFit program[5]. For an example of a composite lightcurve, see Fig.1.
We also collected data from the 1.88-meter telescope of the Kottamia Astronomical Observatory (KAO) in Egypt. Since we did not have the possibility of rapid alternating filter changes, we used 5-s exposures in 15-min blocks. Block sequence: g,z,g,z,g,z,g,i,g,i,g,r,g,r,g. We determined the color indices in the same way as for the RBT data.
The SDSS colour indices for each data set are presented in Table 1. We assumed the mean value of the colour indices to be a weighted average, where the weights were the inverse squares of the uncertainties.
Following the publication by [6], we converted the colour indices to reflectance values and then compared them with the reflectance values for the taxonomic classes. In this case, the taxonomic class cannot be determined unambiguously. Fig. 2 shows three probable taxonomic classes compared to our results: Xe, K, Cg. We consider Xe as the most probable for which albedo pv=0.15 +/- 0.041 [7]. With this albedo value and H=21.64 +/- 0.40 mag [4], the asteroid's effective diameter is D=0.161 +/- 0.036 km. Due to the very similar albedo for K class (pv=0.14 +/- 0.02) [6], the diameter D=0.167 +/- 0.032 km, is essentially the same within uncertainty. It should be noted that for the Cg type, the asteroid may be larger (pv=0.076 +/- 0.034) [7], D= 0.227 +/- 0.064.
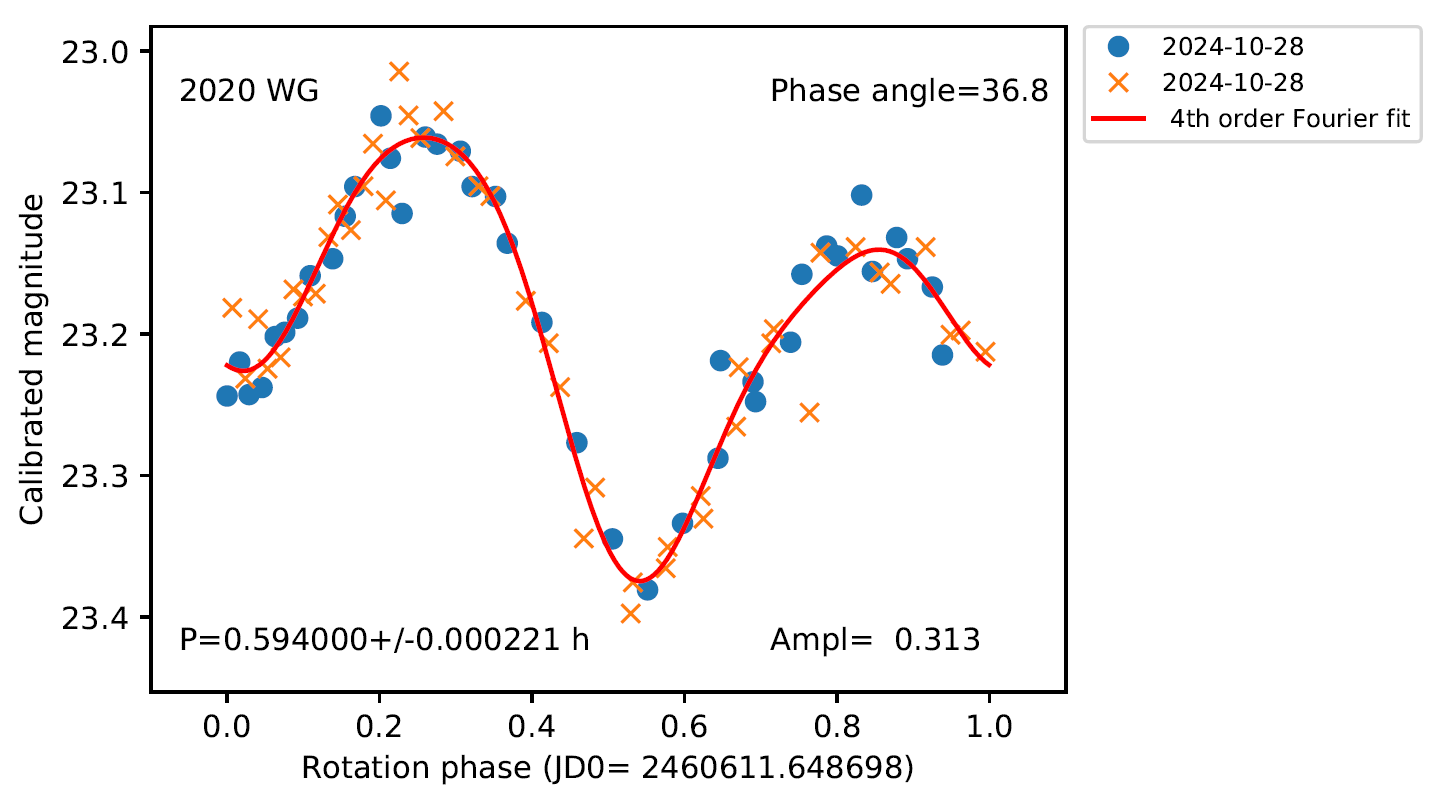
Fig. 1. Example of composite lightcurve. Data from RBT telescope, 2024-10-28. Blue dots - observation in g band, orange crosess - i band. The lightcurve in i band was shifted to the lightcurve in the g band. The synodical rotation period P is 35.64 +/- 0.01 minutes.
| UTC date, telescope | g-r | g-i | g-z |
| 2024-10-26 REM | 0.572 +/- 0.054 | 0.702 +/- 0.068 | 0.684 +/- 0.061 |
| 2024-10-28 RBT | 0.560 +/- 0.009 | 0.704 +/- 0.009 | 0.699 +/- 0.012 |
| 2024-10-29 RBT | 0.567 +/- 0.009 | 0.701 +/- 0.087 | 0.705 +/- 0.013 |
| 2024-10-29 KAO | 0.577 +/- 0.008 | 0.729 +/- 0.010 | 0.718 +/- 0.012 |
| average | 0.569 +/- 0.005 | 0.715 +/- 0.007 | 0.707 +/- 0.007 |
Tab. 1. Colour indices in SDSS bands


Fig. 2. Reflectance values obtained from the colour indices of asteroid 2020 WG compared to the three most probable taxonomic classes. Data for taxonomic
types from [6].
Acknowledgements
This research was funded in whole or in part by the National Science Centre, Poland, Grant No. 2021/41/N/ST9/04259. These results are part of a project that has received funding from the European Union’s Horizon 2020 research and innovation programme under grant agreement No 101004719. We would like to thank the REM telescope team for their help in observations.
References
[1] Kwiatkowski et al. (2021) A&A 656, A126
[2] Koleńczuk et al. (2022) Colours and taxonomy of 2022 AB: a super fast rotating near-Earth asteroid, EPSC 2022, held 18–23 September 2022 in Granada, Spain
[3] Koleńczuk et al. (2022) Colour Indices and Taxonomy of Super-Fast Rotating Very Small Near-Earth Asteroid 2015 RN35, ACM 2023, held 18-23 June 2023 in Flagstaff, USA
[4] https://ssd.jpl.nasa.gov/
[5] Kwiatkowski et al. (2009) A&A 495, 967–974
[6] DeMeo & Carry (2013), Icarus, 226, 723
[7] Warner et al. (2009) Icarus 202, 134
How to cite: Koleńczuk, P., Kwiatkowski, T., Kamińska, M., Kamiński, K., and Abdelaziz Moursi, A. M.: Physical Properties of the Very Small Near-Earth Asteroid 2020 WG, EPSC-DPS Joint Meeting 2025, Helsinki, Finland, 7–13 Sep 2025, EPSC-DPS2025-1716, https://doi.org/10.5194/epsc-dps2025-1716, 2025.
The reflectance spectra of asteroids and meteorites in the visible/NIR range are characterized by the presence of charge transfer and crystal field transition bands that can be used to infer the composition of the materials. Sunshine et al. [1] have shown that these bands can be modeled using the Modified Gaussian Model, and thus that the reflectance spectra these materials can be fitted by a number of gaussian bands superimposed onto a continuum. In order to apply this model to the analysis of reflectance spectra of asteroids and planetary surfaces in general it is necessary first to make initial guesses about the number and position of the bands to be fitted. This initial step is often complicated by the presence of noise, which can mask the presence of some features. Also, even relatively small amounts of noise can lead to non-unique solutions to the fitting procedure [2]. Both problems can, to some extent, be solved by the use of spectral wavelet analysis [3] to the reflectance spectra of such materials, since it can autonomously detect absorption features in the presence of noise and the use of the wavelet coefficient of the features across multiple scales can provide more robust constraints to the fitting procedure. This work presents tests of the robustness of the algorithm using synthetic spectra and its application to meteorite reflectance spectra from the RELAB database.
References:
[1] Sunshine et al. 1990.J ournal of Geophys. Res. 95, 6955-6966.
[2] Mothé-Diniz et al. 2008. Icarus 195,277-294.
[3] Starck et al. 1997. Astrophys. J. 483, 1101-1020.
How to cite: Carvano, J. M.: Detection and reconstruction of absorption bands on visible/NIR reflectance spectra of minerals using the wavelet transform and the Modified Gaussian Model, EPSC-DPS Joint Meeting 2025, Helsinki, Finland, 7–13 Sep 2025, EPSC-DPS2025-1804, https://doi.org/10.5194/epsc-dps2025-1804, 2025.
Primitive asteroids belonging to the C-complex groups are considered to be among the most ancient and least thermally altered bodies in the Solar System. They are thought to preserve a record of early Solar System conditions, including the primordial distribution of volatiles and organic compounds that may have played a role in the emergence of life on Earth. Understanding their composition, alteration history, and surface evolution is essential for reconstructing early planetary processes.
One of the most widely used techniques for investigating these bodies is low-resolution reflectance spectroscopy, which covers a broad spectral range: from ultraviolet (UV) to near-infrared (NIR) wavelengths. This method allows for the identification of broad absorption features and spectral slopes indicative of surface mineralogy and alteration processes.
However, due to the limited quantum efficiency of CCDs in the near-UV (NUV) and atmospheric scattering, most spectroscopic surveys - such as the Small Main Belt Asteroid Spectroscopic Survey (SMASS) I and II [1, 6], and the Small Solar System Objects Spectroscopic Survey (S3OS2) [4]- are constrained to wavelengths above 0.45 μm, leaving NUV absorption largely unexplored. In this work, we aim to explore the presence of hydrated minerals based on spectral key features of primitive asteroids in the NUV-visible range. We investigate properties in the spectra of C-complex asteroids, such as the NUV absorption feature and the 0.7 µm band, to refine our understanding of asteroid surface composition, space weathering effects [3], and aqueous alteration processes [2]. These features serve as crucial indicators of the presence of phyllosilicates and other hydrated minerals.
Since November 2023, we have been conducting observations using the 10-meter Southern African Large Telescope (SALT), located in Sutherland, South Africa. SALT is equipped with the Robert Stobie Spectrograph (RSS), which we used to obtain asteroid spectra at a resolution of R = 800. A distinctive advantage of SALT is its enhanced throughput at short wavelengths, reaching down to 0.32 μm in the near-ultraviolet, thanks to the NaCl correction lens.
For some observations, we also used the 10.4-meter Gran Telescopio Canarias (GTC), located in La Palma, Spain. It allowed us to observe asteroids that were not accessible from SALT. By observing selected targets with both telescopes, we were also able to check our spectra for instrumental biases.
At the conference, we will present the results from our first observing pool, which includes spectra of 25 asteroids and their analysis; outline our ongoing long-term observational program and future plans. We will also discuss our observational strategy, particularly the identification and use of solar analogue stars in the NUV range in the Southern Hemisphere for accurate spectral calibration.
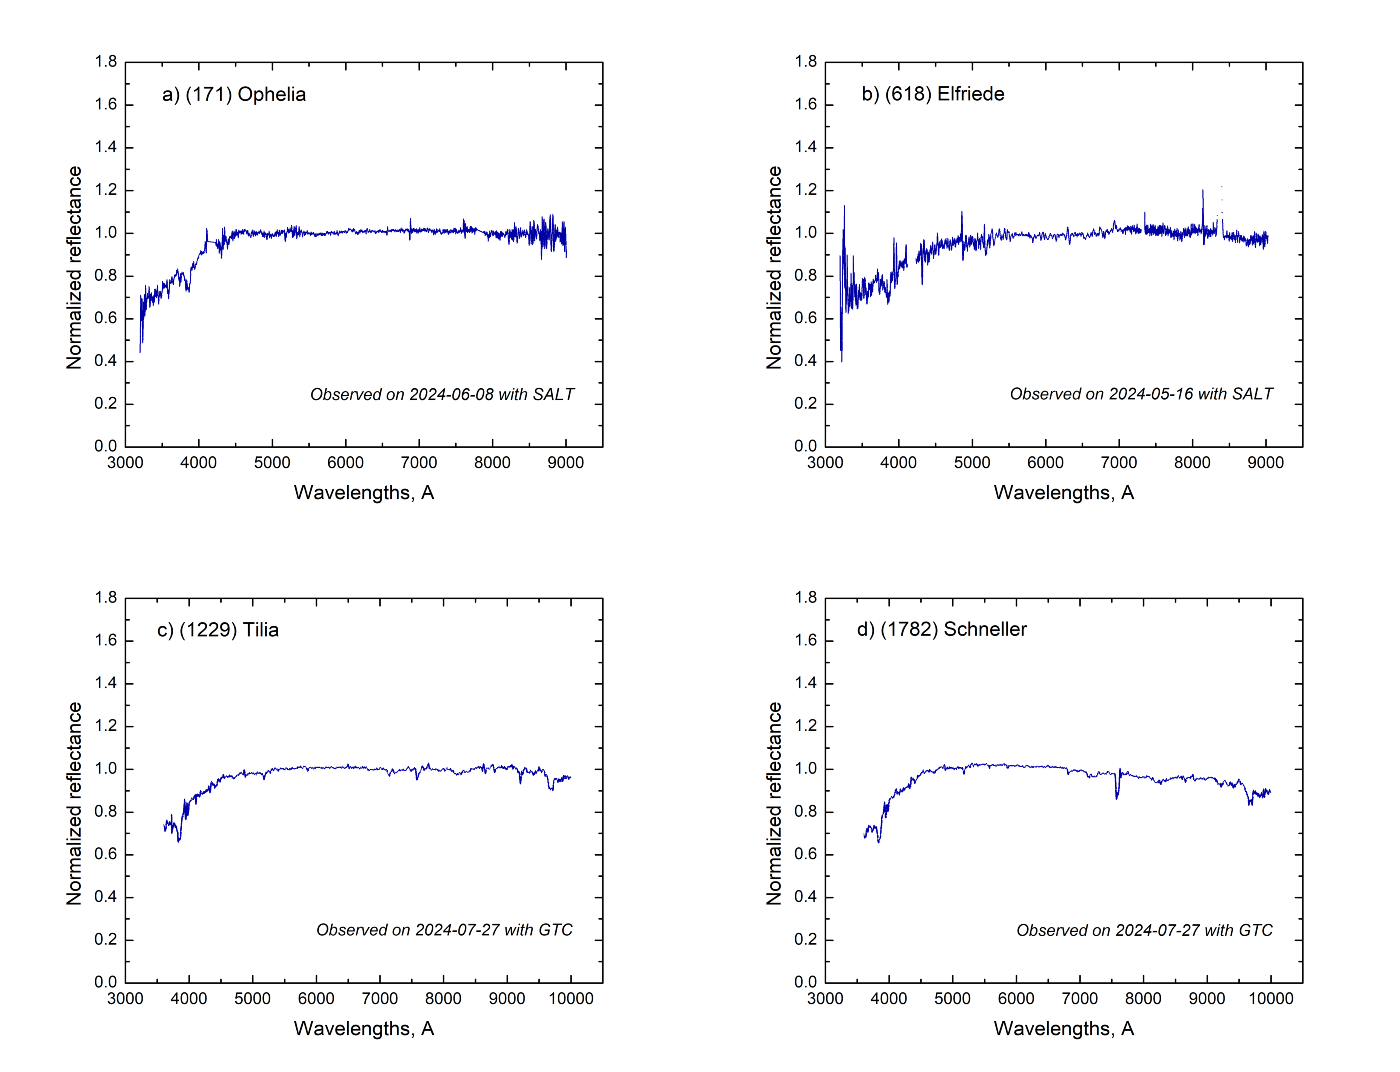
Figure 1: Examples of reflectance spectra of several C-type asteroids observed: a-b) with SALT in the range 0.32-0.9 μm; c-d) with GTC in the range 0.35-1.0 μm. Asteroid spectra have been divided by spectra of the solar analogue star SA112-1333, obtained on the same night as the asteroids. All spectra have been normalized to 1 at a wavelength of 0.55 μm..
Acknowledgments: Part of observations reported in this abstract were obtained with the Southern African Large Telescope (SALT). This work has been done under the SALT programs 2023-2-SCI-025, 2024-1-SCI-012 and 2024-2-SCI-005 (PI: T. Kwiatkowski). Polish participation in SALT is funded by grant No. MEiN nr 2021/WK/01. This work has been done under the GTC program GTC37-24A (PI: J. de León). JdL acknowledges support from the Agencia Estatal de Investigación del Ministerio de Ciencia e Innovación (AEI-MCINN) under grant "Hydrated Minerals and Organic Compounds in Primitive Asteroids" with reference PID2020-120464GB-100.
References: [1] Bus, Binzel (2002) Icarus, 158, 1; [2] Fornasier et al. (2014) Icarus, 223; [3] Hendrix & Vilas (2019) Geophys. Res. Lett., 46, 24; [4] Lazzaro et al. (2004) Icarus, 172, 1; [5] Vilas (1994) Icarus, 111, 2; [6] Xu et al. (1995) Icarus, 115, 1
How to cite: Mykhailova, S., Kwiatkowski, T., de Leon, J., Tatsumi, E., Erasmus, N., and Dimitrow, W.: Investigation of near-ultraviolet-visible range in spectra of primitive asteroids, EPSC-DPS Joint Meeting 2025, Helsinki, Finland, 7–13 Sep 2025, EPSC-DPS2025-1272, https://doi.org/10.5194/epsc-dps2025-1272, 2025.
Please decide on your access
Please use the buttons below to download the supplementary material or to visit the external website where the presentation is linked. Regarding the external link, please note that Copernicus Meetings cannot accept any liability for the content and the website you will visit.
Forward to presentation link
You are going to open an external link to the presentation as indicated by the authors. Copernicus Meetings cannot accept any liability for the content and the website you will visit.
We are sorry, but presentations are only available for users who registered for the conference. Thank you.
Please decide on your access
Please use the buttons below to download the supplementary material or to visit the external website where the presentation is linked. Regarding the external link, please note that Copernicus Meetings cannot accept any liability for the content and the website you will visit.
Forward to session asset
You are going to open an external link to the asset as indicated by the session. Copernicus Meetings cannot accept any liability for the content and the website you will visit.
We are sorry, but presentations are only available for users who registered for the conference. Thank you.