
 1,1,3,3,4,3,3,3,
- 1Image Analysis Group, TU Dortmund University, Dortmund, Germany (moritz.tenthoff@tu-dortmund.de)
- 2Institut für Planetologie, Universität Münster, Münster, Germany
- 3Institute of Space Research, DLR, Berlin, Germany
- 4Applied Physics Laboratory, Johns Hopkins University, MD, USA
- *A full list of authors appears at the end of the abstract
Introduction
On December 1st, 2024, the ESA/JAXA spacecraft BepiColombo performed its fifth Mercury swing-by (MSB#5), during which the onboard Mercury Radiometer and Thermal Infrared Spectrometer (MERTIS) [1,2] observed Mercury’s surface for the first time [3]. MERTIS consists of a radiometer (TIR, two channels, 7-14 µm and 7-40 µm) and an imaging spectrometer (TIS, 80 channels, 7-14 µm). A thermal model is required to retrieve emissivity spectra from the TIS data and to address the anisotropic thermal emission caused by surface roughness. Possible approaches are simple semi-analytical roughness models fit to an emission phase function (EPF) [4,5] or fully numerical models. For this work, we use our numerical thermophysical roughness model [6], which has been validated for the lunar surface with Gaofen-4 [7], Diviner [8], and MERTIS [6] data. We derive essential parameters to tailor the model to Mercury and retrieve spectral emissivities. Performing Principal Component Analysis (PCA) and clustering allows us to gain first insights into Mercury’s emissivity variations.
The planet baffle of MERTIS was blocked during MSB#5 due to BepiColombo’s stacked cruise configuration. The observations were instead taken through the space baffle. While the planet baffle was extensively calibrated before launch [9], the space baffle was initially not intended for target observations. The effects of the baffle complicate data calibration. Hence the results presented here should be considered preliminary. The team is currently investigating and improving the calibration [3].
Thermal Model
Many airless planetary bodies (e.g., Mercury, asteroids, and the Moon) are covered by a rough and highly insulating regolith. Different surface orientations on small spatial scales (mm-cm) lead to significant temperature variations on those scales. Consequently, the observed thermal emission is a superposition of multiple Planck functions. The thermal emission produced by a rough surface can significantly deviate from that of a smooth surface (corresponding to a single Planck function).
We model this subpixel roughness with fractal surfaces [6], including self-scattering and self-heating between the facets. Computing the model for every TIS pixel is computationally expensive. Instead, we evaluate the model for a uniform grid in the parameter space and interpolate the results according to the MSB#5 geometry. We estimate three main model parameters:
- The bolometric directional-hemispherical albedo Adh, which controls the reflected solar irradiance.
- The bolometric hemispherical emissivity εh, which controls the total emitted thermal radiance.
- The surface roughness θ, which alters the directional thermal emission characteristic.
Model Parameter Estimation
A theoretical analysis of laboratory data suggests that the bolometric emissivity of Mercury’s surface is lower than that of the Moon, which is often assumed to be εh = 0.95 [11]. Figure 1 shows modeled radiances for different global values of the directional-hemispherical albedo compared to the measured radiances. Even when Adh is set to values outside the plausible range, the model does not match the data. By reducing the bolometric emissivity to εh = 0.75 , we can reproduce the measured radiances (see Figure 2).
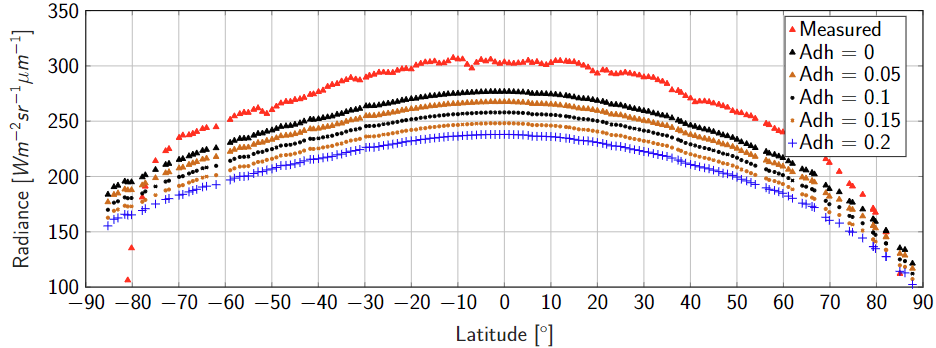
Figure 1. Radiances at 8.6 µm with εh = 0.95
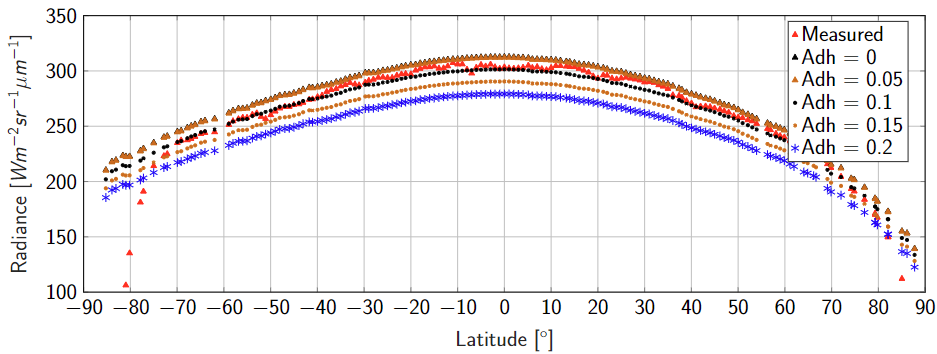
Figure 2. Radiances at 8.6 µm with εh = 0.75
We derived individual Adh values for each MERTIS measurement from MDIS data [10] to incorporate spatial albedo variations. Averaging the values yields 0.07.
Figure 3 shows the same profile as Figure 1 and 2 for different surface roughness parameter values. Near the subsolar point, a rough model behaves like a smooth model, and the parameter has no effect. However, a smooth model cannot fit the data for increasing latitudes due to thermal beaming [12]. We find that a roughness between 30° and 35° is required to explain the data.
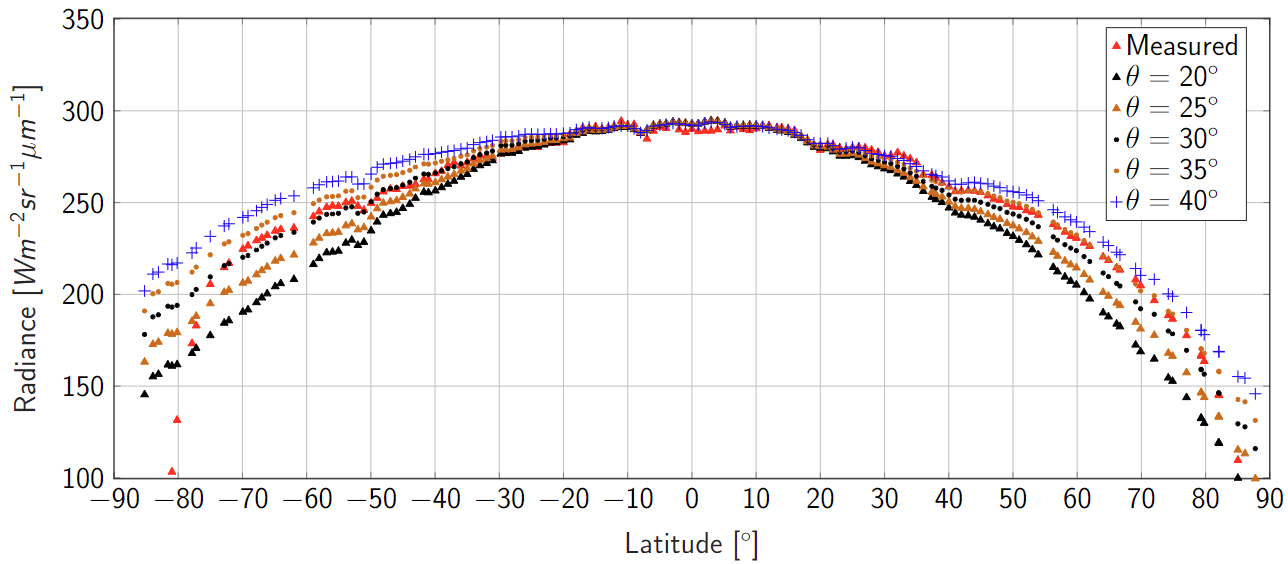
Figure 3. Radiances at 8.6 µm for different roughness values.
Figure 4 shows the radiances gridded to a perspective projection. While the model agrees with the data in the latitudinal direction, there is an offset in the longitudinal direction. However, the highest temperature of a slowly rotating body like Mercury should be centered on the subsolar point and decrease in all directions with increasing incidence angle. This offset is likely caused by the unusual observation conditions. We used a wavelength-independent and pixel-position-dependent fourth-order polynomial fit to correct the radiance scaling without affecting the shape of the spectra.
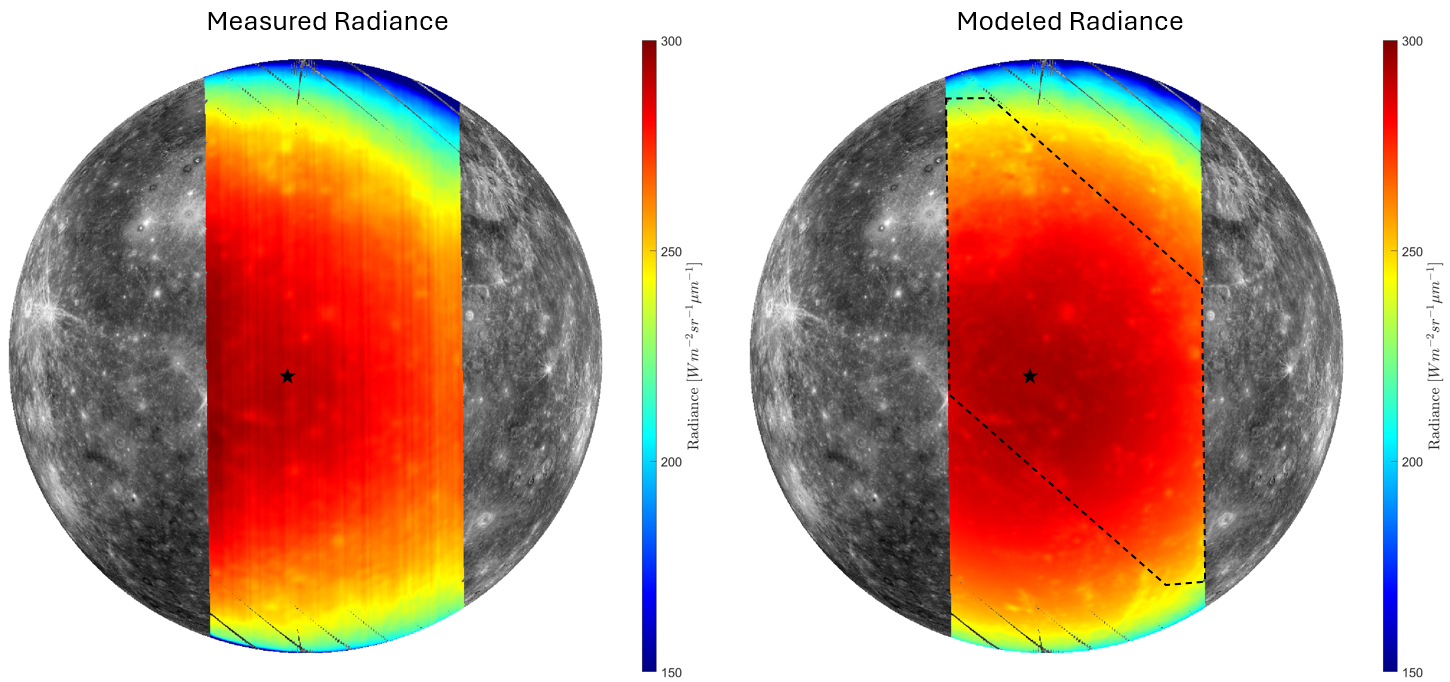
Figure 4. Radiances at 8.6 µm. The black star marks the subsolar point. The dashed area is investigated in Figure 5.
High-Level Emissivity Analysis
Selecting only frames where all 100 TIS pixels saw Mercury allows us to use Fourier filtering to suppress the striping artefacts. To reduce the dimensionality of the data and visualize spatial variations, we applied a PCA to the retrieved spectral emissivities. We only use the first two components PC1 and PC2. Figure 5 shows a false color image with PC1 in red, PC2 in green and a constant value of 0.5 in blue. Further, we used a self-organizing feature map (SOM) to cluster the features PC1 and PC2 into 9 clusters.
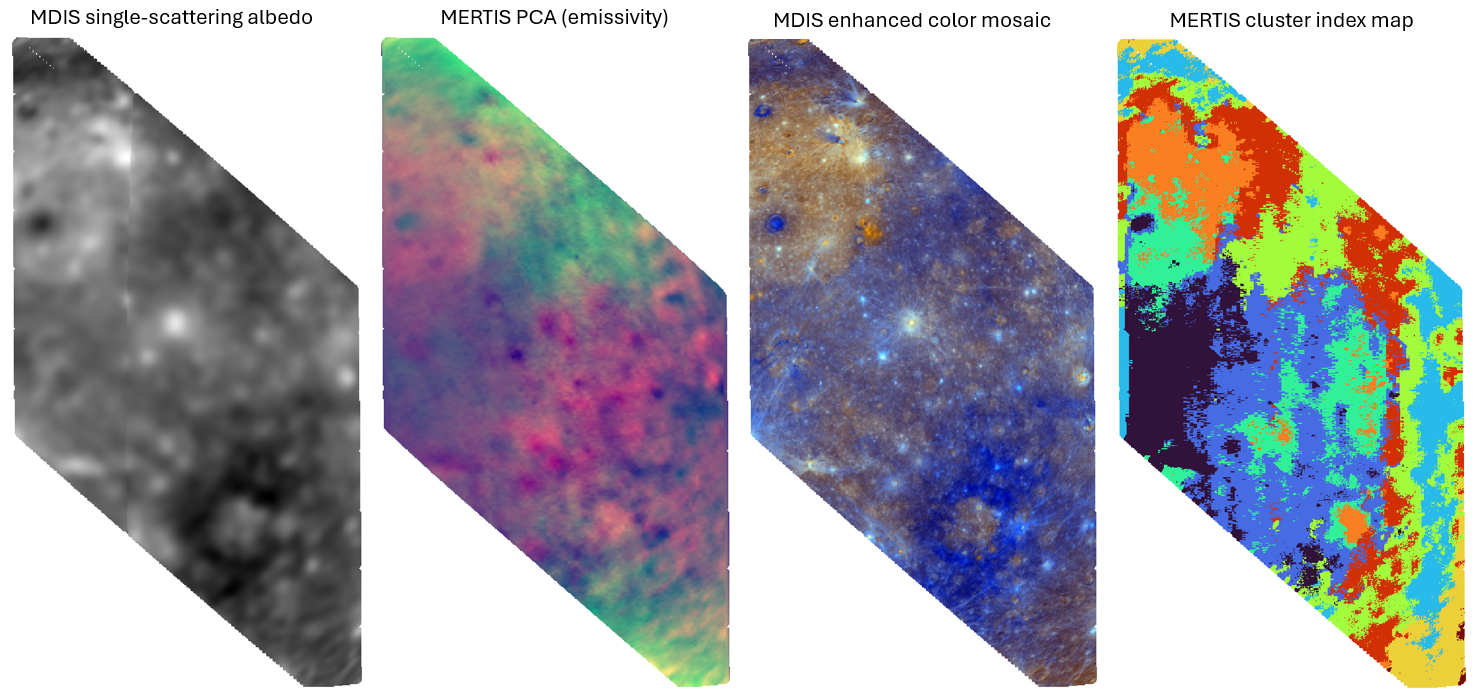
Figure 5. Comparison between maps derived from MDIS [10,13] and MERTIS data. The Caloris basin is visible in the PCA image and cluster index map. Several show up in the emissivity-derived maps. The low reflectance material around Tolstoj vanishes, and the Tolstoj interior is assigned to the same cluster as part of the Caloris interior.
References
[1] Hiesinger, H., et al. 2010, Planet Space Sci. 58 [2] Hiesinger, H., et al. 2020, Space Sci. Rev., 216, 147 [3] Adeli, S., et al., EPSC 2025. [4] Jhoti, E., et al. (2023), TherMoPS IV, 48 [5] Powell, T., et al. 2025, LPSC 2025 [6] Wohlfarth, K., et al., 2023, Astronomy & Astrophysics, 674, A69. [7] Wu, Y., et al. 2021, Geophys. Res. Lett., 48 [8] Bandfield, J. L., et al. 2015, Icarus, 248, 357 [9] D’Amore, M. et al. 2018, Infr. Remote Sens. Instr, 26 897-904 [10] Becker, K. J., et al. Lunar Planet. Sci. Conf. 43. No. 2654. 2012. [11] Wohlfarth, K. 2025, 10.5281/zenodo.14727529 [12] Delbo, M. et al. 2015,AsteroidsIV,107 [13] B. W. Denevi et al., LPSC2016, 1264 (2016).
Johannes Benkhoff, Harald Hiesinger, Andreas Morlok, Iris Weber, Karin Bauch, Aleksandra Stojic, Addi Bischoff, Jörn Helbert, Mario D'Amore, Alessandro Maturilli, Joerg Knollenberg, Ekkehard Kuhrt, Indhu Varatharajan, Stephane Erard, Gabriele Arnold, Mark Robinson, Neil Bowles, Benjamin T. Greenhagen, Urs Mall, Pierre Vernazza, Olivier Groussin, Christian Wöhler, Ljuba Moroz, Gisbert Peter, Luigi Colangeli, Walter Ingo, Ann L. Sprague, M. Rataj, Simon Calcutt
How to cite: Tenthoff, M., Wohlfarth, K., Wöhler, C., Schmedemann, N., Bauch, K. E., Barraud, O., Verma, N., Powell, T. M., Greenhagen, B. T., Knollenberg, J., D‘Amore, M., Helbert, J., Adeli, S., and Hiesinger, H. and the MERTIS Team: MERTIS Thermal Modeling: Mapping Emissivity Variations from BepiColombo’s Mercury Swingby 5, EPSC-DPS Joint Meeting 2025, Helsinki, Finland, 7–12 Sep 2025, EPSC-DPS2025-1029, https://doi.org/10.5194/epsc-dps2025-1029, 2025.