
 1,2,3,2,
- 1Belgian Institute for Space Aeronomy (BIRA-IASB), Planetary Atmospheres, Uccle, Brussels, Belgium (arianna.piccialli@aeronomie.be)
- 2INAF - IAPS, Istituto di Astrofisica e Planetologia Spaziali, Via del Fosso del Cavaliere, 100, I-00133 Rome, Italy
- 3Laboratoire de Météorologie Dynamique (LMD/IPSL), Sorbonne Université, ENS, PSL Research University, Institut Polytechnique de Paris, CNRS, Paris, France
- 4Institut d'Astrophysique de Paris, Sorbonne Université, CNRS & LESIA, Observatoire de Paris, PSL.
Introduction: We present zonal thermal winds derived by applying the cyclostrophic balance from the Visible and Infrared Thermal Imaging Spectrometer (VIRTIS) temperature retrievals. VIRTIS was one of the experiments on board the European mission Venus Express [1]. For this study, we analyzed the complete VIRTIS-M dataset acquired between December 2006 and January 2010 [2,3], which we used to investigate both the day-to-day and local time variability.
Mesosphere dynamics: Venus offers a unique environment for investigating atmospheric dynamics on a planet with slow rotation. The dynamics of its upper atmosphere (60-120 km) is a combination of the retrograde zonal wind found in the lower mesosphere and the solar-to-antisolar winds that characterize the thermosphere. This region experiences intense turbulence and marked variability both over short periods and across extended timescales. Additionally, a variety of wave phenomena, spanning multiple spatial scales, have been observed at and above the clouds, and are believed to significantly influence the overall atmospheric circulation. Despite extensive observations, the basic processes driving the super-rotation – where the cloud-level winds move roughly 80 times faster than the rotation of the planet itself – as well as other dynamical features of Venus circulation, remain insufficiently understood [4].
Temperature maps: We used temperature retrievals derived from the VIRTIS experiment on board the European mission Venus Express [1]. VIRTIS consisted of two channels: VIRTIS-M and VIRTIS-H. In this study, we analyzed the complete VIRTIS-M dataset acquired between December 2006 and January 2010, corresponding to orbits #23 to #843 [2,3,14]. The VIRTIS observations examined in this study span the nightside of both hemispheres, with significantly denser coverage in the southern hemisphere (see Figure 1.)

Figure 1: Number of VIRTIS-M temperature retrievals (about 470000 profiles in total) used in this work [15], distributed over local solar time and latitude.
Winds maps: Different techniques have been used to obtain direct observations of wind at various altitudes: tracking of clouds in ultraviolet (UV) and near infrared (NIR) images give information on wind speed at cloud top (~70 km altitude) [5] and within the clouds (~61 km, ~66 km) [6], while ground-based measurements of doppler-shift in CO2 band at 10 μm [4] and in several CO (sub-)millimeter lines [7,8] sound thermospheric and upper mesospheric winds, showing a strong variability.
In the mesosphere, at altitudes where direct observations of wind are not possible, zonal wind fields can be derived from the vertical temperature structure using the thermal wind equation. Previous studies [9,10,11,12] showed that on slowly rotating planets, like Venus and Titan, the strong zonal winds at cloud top can be successfully described by an approximation of the Navier–Stokes equation, the cyclostrophic balance in which the equatorward component of the centrifugal force is balanced by the meridional pressure gradient. Figure 2 shows an example of zonal wind derived from VIRTIS temperature retrievals combining all cubes in orbit #151.
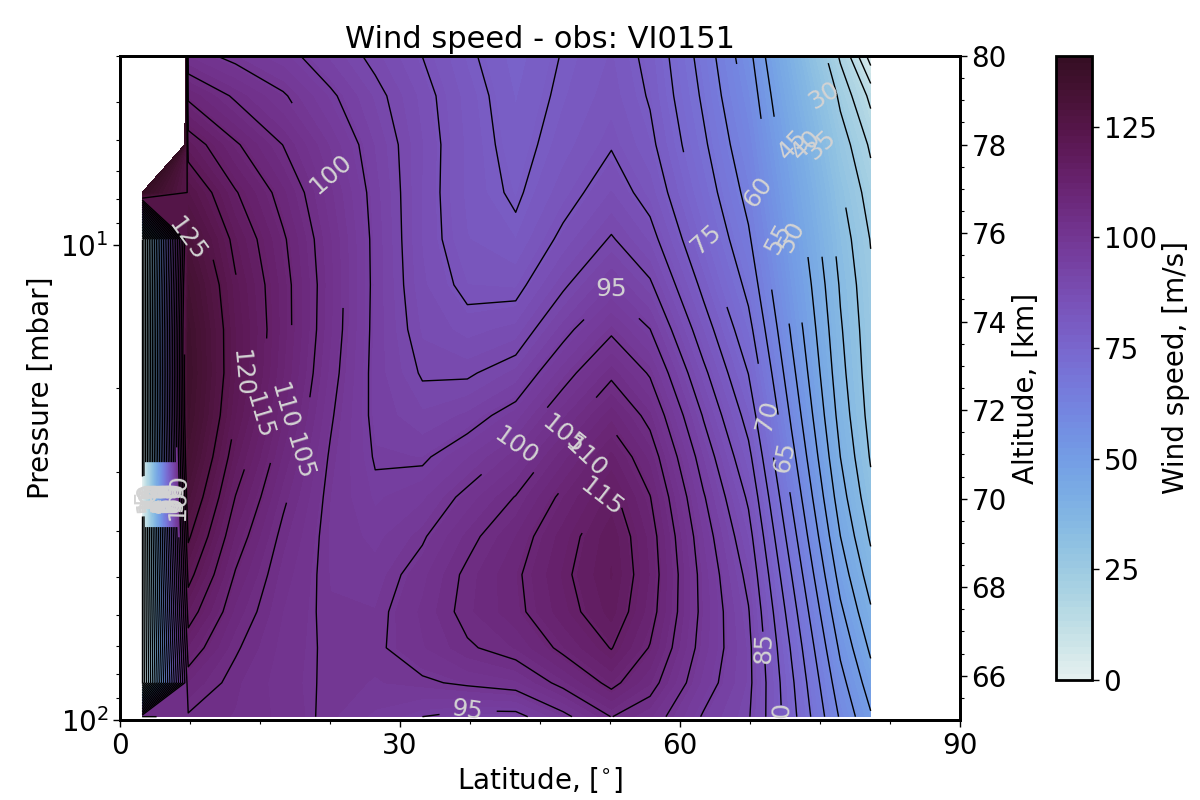
Figure 2: Latitude-altitude cross section of zonal thermal wind speed (m/s) derived from VIRTIS-M temperature profiles for orbit VI0151 assuming cyclostrophic balance. Contour interval is 5 m/s, some contours have been removed to render the plot clearer.
Orbit-to-orbit variations: We retrieved the wind field for 63 orbits (#VI0023 - #VI0374) acquired between 14 May 2006 and 30 April 2007. We analyzed the orbit-to-orbit variations by averaging the wind speeds over latitudinal bins of 30°. Figure 3 shows the averaged wind speeds at an altitude of ~68 km.
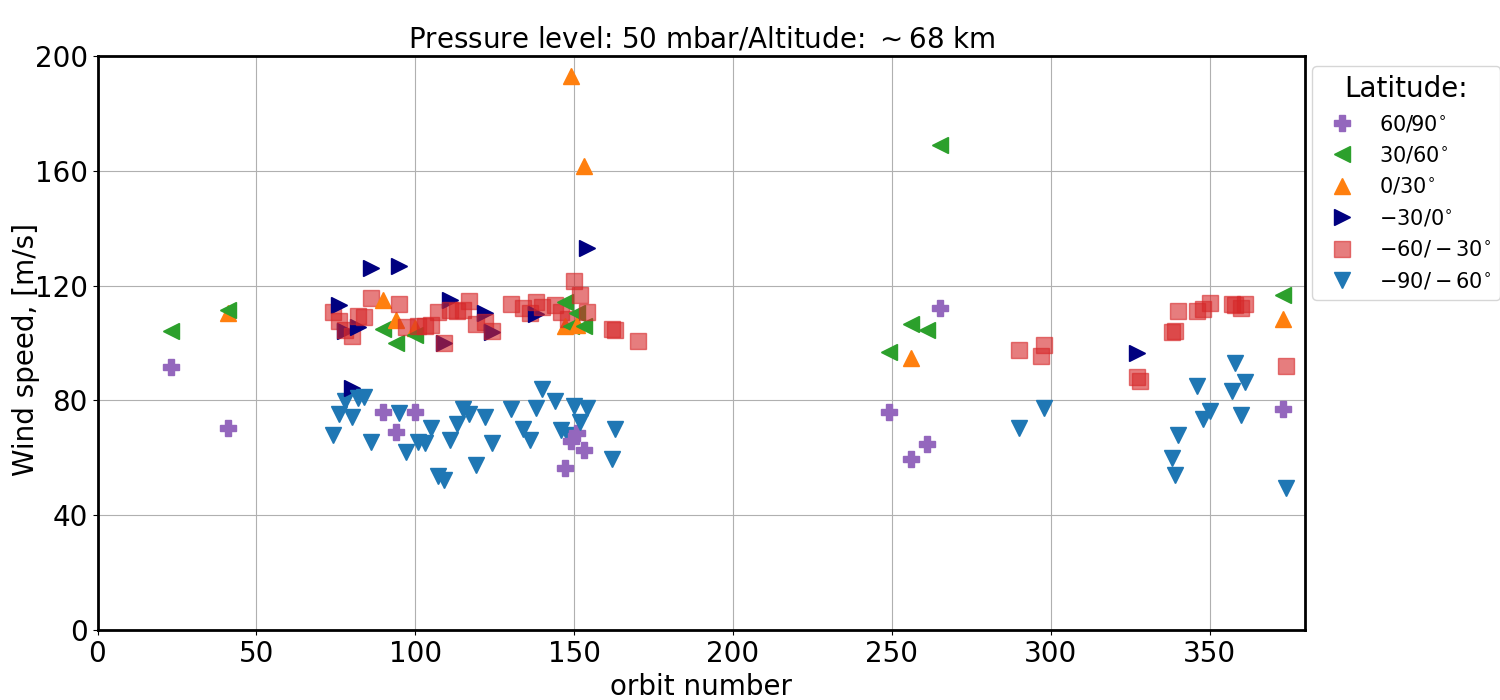
Figure 3: Orbit-to-orbit variations of wind velocities averaged over latitudinal bins of 30°, and at four different pressure levels. The pressure level is 50 mbar (≈68 km). Different symbols and colors refer to different latitudinal bins, as showed in the legend.
Within each latitudinal bin, the wind present a clear hemispheric symmetry. In addition, we can observe a midlatitude jet (30-60°) with a maximum speed of ~110 m/s. The wind appear to be stable over time.
Local time variations: To investigate how zonal winds vary with local time in greater detail, we divided the temperature profiles into local time intervals of 1 h and then retrieved the wind speed for each local time bin. Finally, we interpolated the latitudinal wind profiles to a latitudinal grid of 5°. Figure 4 (Left) shows the wind anomaly at 20 mbar on a latitude (5°) and local time (1 h) grid. We observe a pattern compatible with thermal tides, with a pronounced minima before midnight. A preliminary comparison with simulations from the Venus Climate Database (VCD) shows a good agreement Figure 4 (Right) [13].
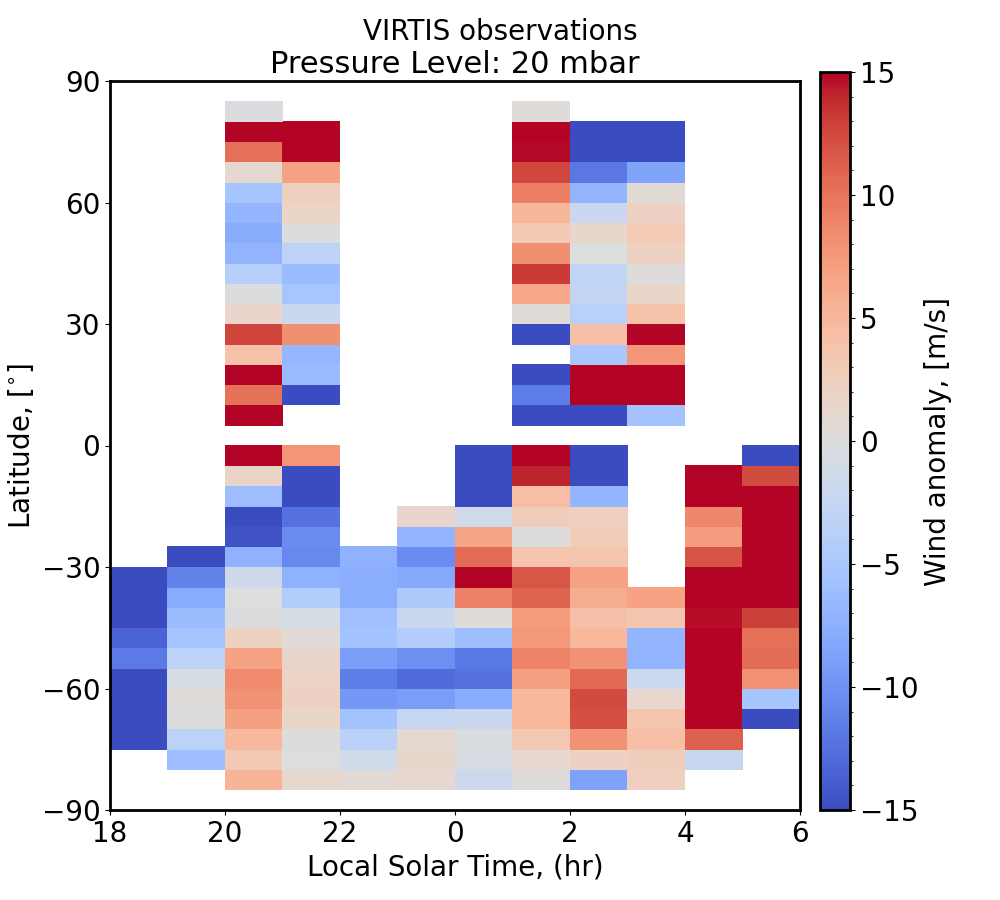
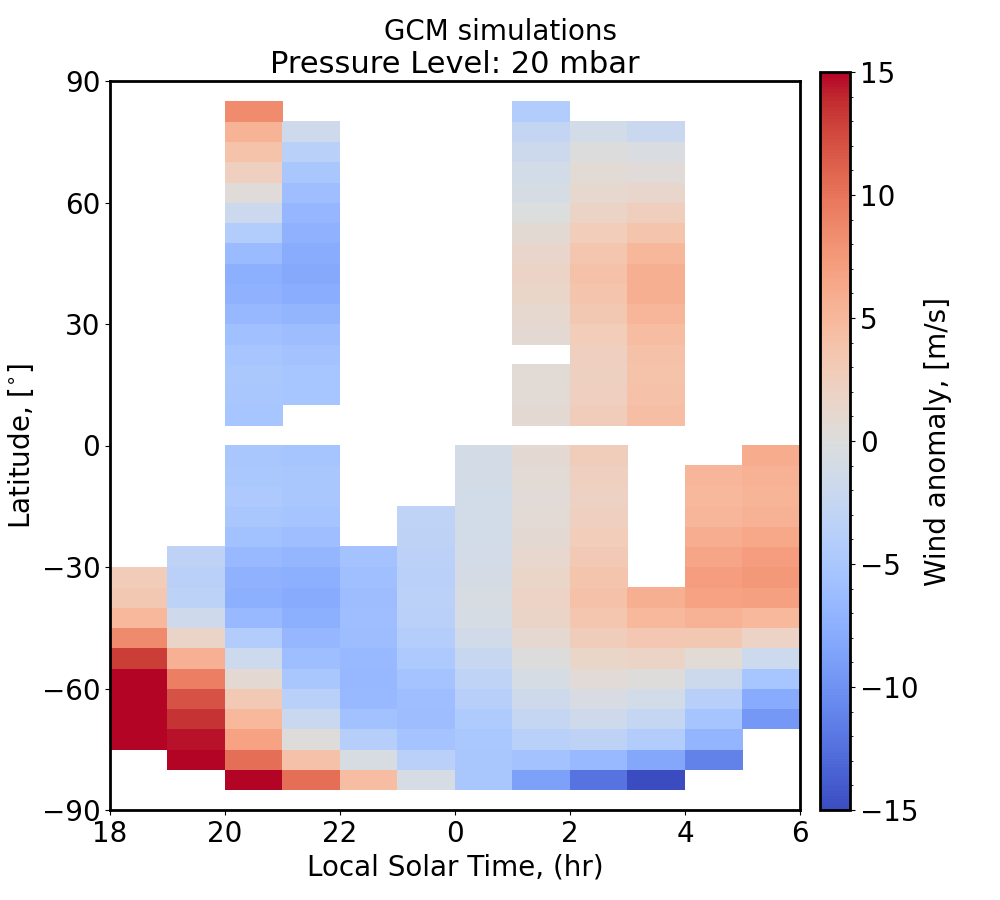
Figure 4: Horizontal cross-section of wind anomaly at 20 mbar. (Left) VIRTIS observations; (Right) Simulations acquired by the VCD.
References: [1] Drossart, P. et al. (2007) PSS, 55:1653–1672. [2] Grassi D. et al. (2008) JGR, 113, 2, E00B09. [3] Migliorini, A. et al. (2012) Icarus 217, 640–647. [4] Sanchez-Lavega, A. et al. (2017) Space Science Reviews, Vol. 212, Iss. 3-4, pp. 1541-1616. [5] Goncalves R. et al. Atmosphere, 12:2., (2021) doi: 10.3390/atmos12010002. [6] Hueso, R. et al. (2012) Icarus, Vol. 217, Iss. 2, p. 585-598. [7] Sornig, M. et al. (2013) Icarus 225, 828–839. [8] Rengel, M. et al. (2008) PSS, 56, 10, 1368-1384. [9] Piccialli, A. et al. A&A, 606, A53 (2017) doi: 10.1051/0004-6361/201730923 [10] Newman, M. et al. (1984) J. Atmos. Sci., 41, 1901-1913. [11] Piccialli A. et al. (2008) JGR, 113,2, E00B11. [12] Piccialli A. et al. (2012) Icarus, 217, 669–681. [13] Martinez et al 2023 https://doi.org/10.1016/j.icarus.2022.115272. [14] Grassi, D., et al., (2014) JGR (Planets), 119, 837–849, doi:10.1002/2013JE004586.
How to cite: Piccialli, A., Grassi, D., Lebonnois, S., Migliorini, A., Piccioni, G., Drossart, P., and Politi, R.: Zonal Wind Variability in Venus’ Mesosphere from VIRTIS/VEx Temperature Retrievals, EPSC-DPS Joint Meeting 2025, Helsinki, Finland, 7–12 Sep 2025, EPSC-DPS2025-104, https://doi.org/10.5194/epsc-dps2025-104, 2025.