
 1,2,4,1
- 1Institut für Geophysik und Extraterrestrische Physik, Technische Universität Braunschweig, Braunschweig, Germany
- 2Laboratoire Lagrange, Observatoire de la Côte d’Azur, CNRS, Université Côte d’Azur, Nice, France
- 3Laboratory for Atmospheric and Space Physics and Department of Astrophysical and Planetary Sciences, University of Colorado, Boulder, USA
- 4School of Physics and Astronomy, University of Leicester, Leicester, UK
The Moon’s surface thermal environment is extreme compared to other planetary bodies in the solar system, with temperatures ranging between 400 K at the subsolar point and lower than 40 K in permanently shadowed regions around the poles (Paige et al. 2010). The surface temperature of the Moon also represents a fundamental boundary condition that governs the thermal state of the Moon’s regolith, the interior, and the behaviour of near-surface volatiles. The regolith is the layer of unconsolidated material covering the lunar surface, created by impacts and space weathering. The lunar environment is known to be characterized by interactions between the space plasma and the dusty surface, leading to a complex exosphere. Knowing more about the current state of the lunar regolith can give us insight into the geological history of the moon.
In contrast to in-situ measurements or returned samples, remote sensing measurements can be used to constrain surface properties on a global scale. NASA’s Lunar Reconnaissance Orbiter (LRO) was the first spacecraft to create a global 3D map of the lunar surface. During the 15+ years of operation of LRO, the Diviner Lunar Radiometer Experiment (Diviner) has measured the brightness temperature of the lunar surface in 9 wavelength channels ranging from 0.35 µm to 400 µm (Paige et al. 2010) with a spatial resolution of approximately 250 meters per pixel. With the help of thermal models, the Diviner measurements were used to derive global properties of the lunar regolith (Hayne et al. 2017). Based on the latter work, Bürger et al. (2024) developed a thermal model of the lunar regolith using microphysical parameters, such as the regolith grain size and stratification. However, their best-fit results to Diviner nighttime measurements were non-unique.
On the contrary to the diurnal cycle which spans roughly 29.5 Earth days, lunar eclipses (solar eclipses as seen from the lunar surface) provide cooling curves of the regolith on a much smaller timescale of roughly 4 Earth hours. As a consequence, eclipse cooling occurs only within a thin layer corresponding to the much shallower thermal skin depth < 1 cm (compared to ~10 cm for the diurnal cycle). Lunar eclipse events lead to a significant cooling of the lunar surface by ΔT ≈ 200 K, due to the lack of a lunar atmosphere. Therefore, eclipse events offer a unique opportunity to constrain the physical properties of the uppermost regolith layer, the interaction zone between the lunar space environment and the lunar surface.
We present a refinement of the thermal model of Bürger et al. (2024) by combining Diviner daytime, nighttime, and eclipse measurements to resolve the degeneracy of the solution space and give best-fit estimates for microphysical properties of the lunar regolith such as regolith grain size and stratification on a global scale. To capture the precise timing and geometry of each lunar eclipse we improve the upper boundary condition of the thermal model by using the SPICE toolkit. We filter for locations with a low rock abundance below the average of 0.4% (Bandfield et al. 2011) and small local slopes below 5 degrees, describing default regolith properties and avoiding offsets of the lunar local time. We analyse lunar maria and highlands independently and investigate a latitudinal trend of the derived regolith properties. A comparison with in-situ measurements conducted by the Apollo mission is made to confirm the results.
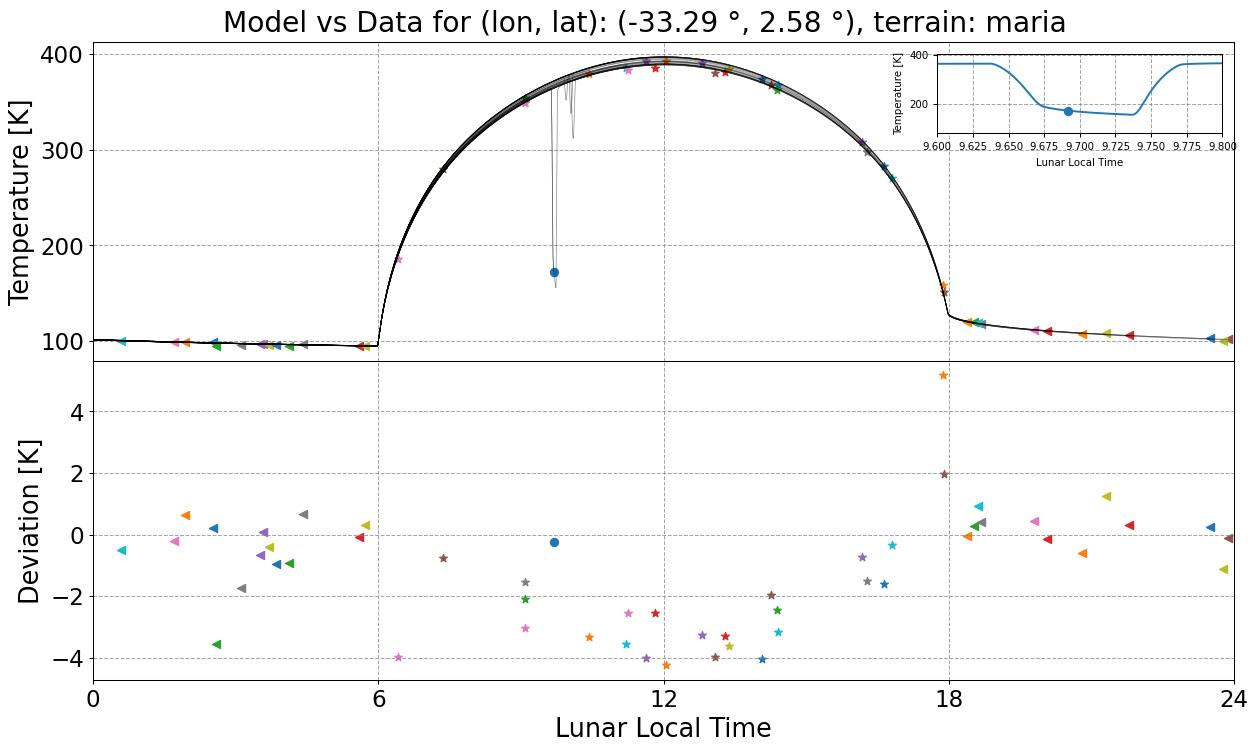
Figure 1: Comparison of the thermal model with the Diviner data for a location in the maria near the equator. The top panel shows the available Diviner measurements for this location between 2009-12-01 and 2024-06-01 on top of their respective simulated diurnal curves. Nighttime data are marked with triangles, daytime data with asterisks. The eclipse event on the morning side is marked with a circle and shown in the cutout in the top right corner. The temperature drops by ~200 K for a short duration and then rises quickly to continue the ascending curve of the morning side. A drop in temperature without a measurement means that the location was not in the field of view of Diviner during the eclipse, instead it is part of the diurnal curve of another data point. The bottom panel shows the difference between model and data with χ2 = 1.6 K.
References:
Paige et al. (2010), Space Sci. Rev., 150(1-4).
Bandfield et al. (2011), JGR, 116(12).
Hayne et al. (2017), JGR, 122(12).
Bürger et al. (2024), JGR, 129(3).
How to cite: Langermann, L., Bürger, J., Hayne, P. O., Delbo, M., and Blum, J.: Refining a Thermophysical Model of the Lunar Surface using Eclipses, EPSC-DPS Joint Meeting 2025, Helsinki, Finland, 7–12 Sep 2025, EPSC-DPS2025-1060, https://doi.org/10.5194/epsc-dps2025-1060, 2025.