
 1,
1,- 1Purdue University, United States of America (harr1273@purdue.edu)
- 2Smithsonian National Air and Space Museum, United States of America
Introduction:
The Martian North Polar Layered Deposits (NPLD) are a kilometers-thick stack of icy layers, with a bulk composition of 95% water ice and the rest being silicate dust and lithics [1–2]. Individual layers within the NPLD vary in dust content, ranging from negligible amounts to potentially ~60% dust [3]. These differences are believed to be controlled by orbital forcing in Martian history, where each layer contains a snapshot of the paleoclimate at the time of deposition [4]. Specifically, it is believed that the large variations in Martian obliquity, ranging from ~15°– 60°, create alternating periods of ice accumulation and ice loss [5]. Our best tool to understand the layering within the entire vertical extent of the NPLD is orbital radar sounding, such as that from the Shallow Radar (SHARAD) onboard the Mars Reconnaissance Orbiter (MRO). However, visible imaging of exposures of the upper NPLD have shown that layers can have thicknesses down to decimeter to meter scales [6], smaller than SHARAD’s vertical resolution of ~10m. The impact that these sub-resolution layers have on radar observations is not completely understood [7–8], and it is hypothesized that a radar reflector within the NPLD may be the result of either a single relatively thick layer, or “packets” of thinly spaced layers [9]. Therefore, to understand the Martian paleoclimate recorded in the NPLD, we must have a better understanding of how different scales of layering influence the radar observations. To address this, we combine results from laboratory analog experiments and wave propagation simulations with Mars’ remote sensing observations.
Laboratory Setup:
We create a series of laboratory analogs to test how radar observations are influenced by various sub-resolution layer thicknesses and spacings. Our radar measurements are made using a 2.7 GHz GSSI StructureScan Mini XT system, which is higher frequency than SHARAD but allows for experiments of a tractable size. Our experiments consist of different configurations (Fig. 1) of 100% water ice layers and dust-rich layers composed of ~55% Martian regolith simulant MGS-1 [10] and ~45% ice, within a 72cm × 72cm × 45cm polyethylene container housed in a -20°C freezer. These experiments focus on dusty layer thicknesses and spacings ranging from λ/2 to λ/16 (where λ is the wavelength of the transmitted radar wave in free space, 11 cm for 2.7 GHz).
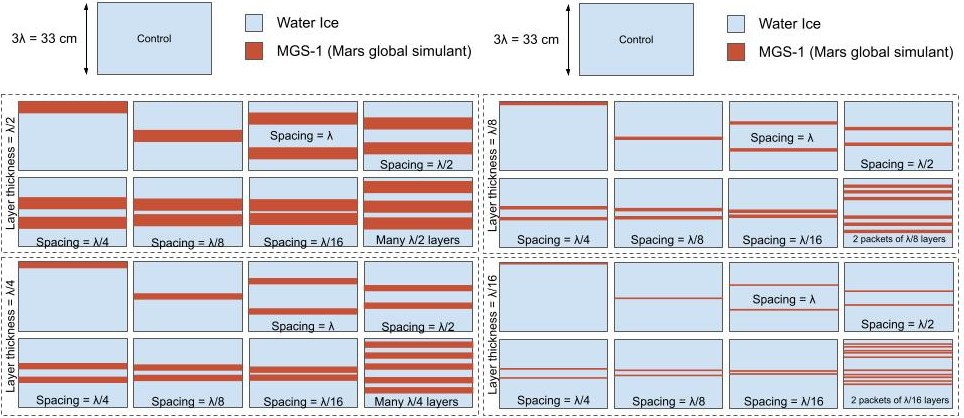
Fig. 1 Example of various dusty layer configurations to be tested. Experiments are conducted in a 72cm × 72cm × 45cm polyethylene container and radar data is collected using a commercial radar system with a center frequency of 2.7GHz (free space λ ≈ 11cm).
Preliminary Results:
Current results indicate that the critical thickness for a single dusty layer to have distinct upper and lower reflectors in our NPLD analog experiments is > λ/8, which matches theoretical expectations [7]. Fig. 2 shows radargrams for a single λ/4 thick dusty layer, where upper and lower reflectors are distinct, and a single λ/8 dusty layer, where the upper and lower reflectors are combined into one reflector. Based on early results, coarsely spaced layer packets may be differentiated from singular thick dusty layers based on total power returned from the lowest reflector. In Fig. 3, a singular λ/2 thick dusty layer has reduced power returned from the reflector corresponding to the bottom of the layer, compared to that from a layer packet configured with two λ/8 thick dusty layers, spaced λ/2 apart. Combining these initial results with more experiments and simulations to extrapolate results to larger scales and lower frequencies will establish a guideline to interpreting SHARAD data of the NPLD.
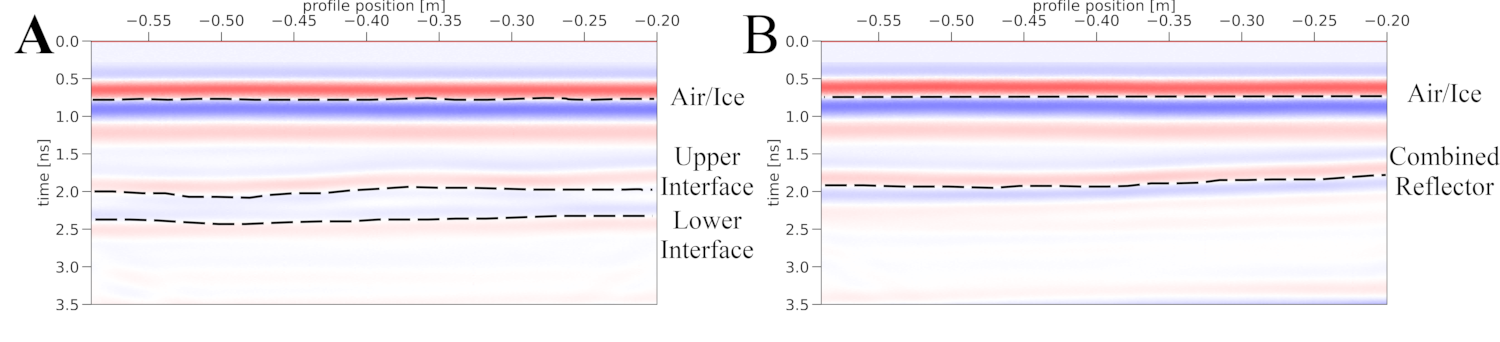
Fig. 2 A) Radargram of a single λ/4 (2.75 cm) thick dusty layer. Upper and lower contacts with the ice show distinct separate reflectors. B) Radargram of a single λ/8 (1.375 cm) thick dusty layer. Upper and lower contacts do not show distinct reflectors and combine into one reflector.

Fig. 3 Comparison of radar power returned for two experimental configurations: a single, thick (λ/2; 5.5cm) dusty layer and two thinner (λ/8; 1.375 cm) dusty layers spaced λ/2 (5.5cm) apart. Left side of each subpanel illustrates the stratigraphic configuration (centered on the depth of the middle of the experimental column), with dusty layers in orange and water ice in light blue. Right side of subpanels shows radar power (relative to transmitted power) returned for detected interfaces associated with the layer(s).
Future Work:
More experiments will be run, as shown in Fig. 1, to better understand how the power return of reflectors changes with thickness and spacings. Additionally, experiments focused on packets of λ/8 thick layers at increasingly thinner spacings will be conducted, to understand when layer packets appear as a singular layer in radar data. We are also running simulations of these experiments using two Finite-Difference Time-Domain based electromagnetic wave propagation softwares, gprMax [11] and Remcom’s XFdtd to allow us to relate our empirical laboratory results to theoretical results. For example, in Fig. 4, we show our measured experimental radargrams compared to preliminary simulations of waveform propagation for the same configuration. We will apply these laboratory results and simulations to apply our findings to SHARAD data and place new constraints on layer properties of the NPLD.
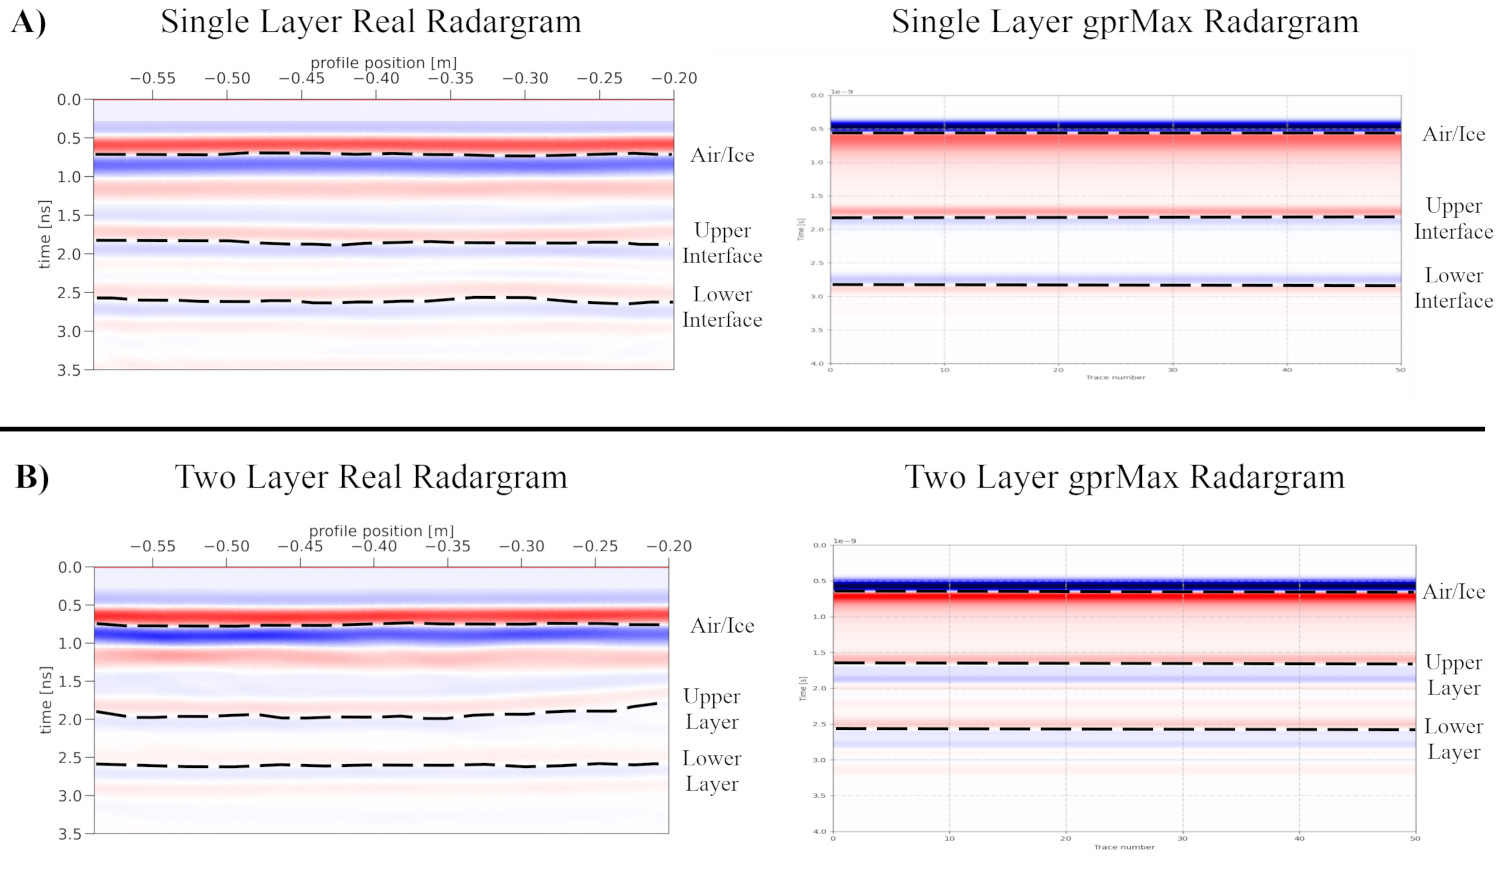
Fig. 4 Comparison of experimentally measured radargrams (left) and gprMax simulations (right). A) Results for the configuration of a single, thick (λ/2; 5.5cm) dusty layer. B) Results for the configuration of two thinner (λ/8; 1.375 cm) dusty layers, spaced λ/2 (5.5 cm) apart.
References:
[1] Malin (1986) Geophys. Res. Lett., 13(5), 444–447. [2] Sinha & Horgan (2022) Geophys. Res. Lett., 49(8). [3] Lalich et al. (2019) JGR Planets, 124(7), 1690–1703. [4] Byrne (2009) Ann. Rev. of Earth and Planet Sciences, 37, 535–560. [5] Montmessin (2006) Space Sci. Rev., 125 (1–4), 457–472. [6] Herkenhoff et al. (2007) Science, 317, 1711–1715. [7] Widess (1973) Geophysics. 38(6), 1176-1180. [8] Zeng (2009) Leading Edge. 28(10), 1192-1197. [9] Putzig et al. (2009) Icarus, 204, 443–457. [10] Cannon et al. (2019) Icarus, 317, 470–478. [11] Warren et al. (2016) Computer Phys. Comms., 209, 163–170.
How to cite: Harris, S., Bramson, A., and McGlasson, R.: Effects of thin layers on radar observations of the Martian polar layered deposits: An integrated approach using experiments, simulations, and spacecraft observations, EPSC-DPS Joint Meeting 2025, Helsinki, Finland, 7–12 Sep 2025, EPSC-DPS2025-1086, https://doi.org/10.5194/epsc-dps2025-1086, 2025.