
 ,
,- Department of Geosciences, Virginia Tech, Blacksburg, United States of America (sdk@vt.edu)
Despite its small size and thin mantle, volcanism was pervasive across the surface of Mercury. A crustal thickness of 35–38 km taken together with a core-mantle boundary depth of approximately 400 km indicates that ~10% of the silicate material within Mercury has experienced melting. This melt is directly linked to the current surface composition, as measured during the MESSENGER mission, with the standard assumptions that the crust was generated through partial melting processes of the mantle and experienced little to no fractionation. The surface composition of Mercury is unlike that of any other body in the Solar System – rich in magnesium and sulfur, as well as other moderately volatile and volatile (e.g., carbon) elements, but poor in iron and titanium, suggesting the surface is dominated by Mg-rich silicate minerals and sulfides. This implies that the mantle has a similarly low FeO content, and a high S content, around 7–11 wt.%. Here we focus on the space and time localization of Northern Smooth Plains (NSP) volcanism on Mercury and the associated active uplift, which post-dates NSP volcanism. We hypothesize an endogenic origin to NSP volcanism that can be explained by a transitional form of temperature-dependent rheology. We considered a set of spherical shell convection calculations with free-slip top (2440 km) and bottom (2020 km), constant temperature boundary conditions (440 K at the top and 1600 K at the bottom), and constant material properties throughout the domain except for rheology which is a strong function of temperature. The calculations have no internal heating and no cooling core boundary condition.
The steady-state planform of the convection is illustrated by the isocontours of temperature in Figure 1. With a viscosity contrast of 20 (Fig. 1a), there is a pattern of (yellow) upwelling linear features and (blue) downwelling linear features in the low to mid latitudes that are interrupted a ring-shaped downwelling near 60–70° latitude in both the northern and southern hemispheres, with a plume at each pole. With a viscosity contrast of 103 (Fig. 1b), we see a similar pattern of linear upwellings and downwellings at low and mid latitudes that merge into large upwelling plumes at the pole. Rather surprisingly, we find a transitional planform with a single upwelling hemisphere and a single downwelling hemisphere with a viscosity contrast of 104 (Fig. 1c). The transitional phase occurs at the same viscosity contrast in these calculations as seen calculations with an Earth-sized core. Finally, with a viscosity contrast of 105 (Fig. 1d) a stagnant lid forms with many small plume-lets (yellow) distributed evenly across the domain with downwelling sheets (blue) between them. The upwelling/downwelling hemisphere pattern (Fig. 1) is surprising because such a long-wavelength structure does not seem possible in a thin shell. We propose that activation energy and crustal rheology are key for the transitional upwelling/downwelling hemisphere form of convection (Fig 1c). The reduction in activation energy compared with olivine basalt is the result of sulfide and graphite within the silicate crust/lithosphere.
We propose this endogenic mechanism explains the observed concentrated region of volcanism expressed as the NSP. We demonstrate the relevance of these calculations to a cooling planet by adding a cooling core boundary condition and radiogenic Heat Producing Element (HPE) concentrations based on the surface abundances of K, Th, and U that were measured with the Gamma-Ray Spectrometer on MESSENGER. The volume and timing of melt generated using an iron free solidus will be compared with the NSP on Mercury. These time evolving calculations allow us to assess the observed post-volcanic uplift.
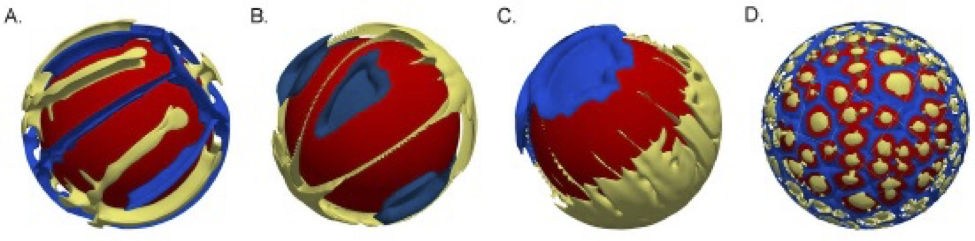
Figure 1: Isotherms from geodynamic models in a Mercury geometry thin silicate shell. Yellow denotes +100 °C above the mean mantle temperature; blue denotes -100 °C below the mean mantle temperature. A. Roll pattern with viscosity contrast of 20; B. Roll pattern with viscosity contrast of 103; C. Hemispheric up/down pattern with viscosity contrast of 104; D. Many small plumes beneath a stagnant lid with viscosity contrast of 105.
How to cite: King, S., Green, A., and Duncan, M.: Mercury's Last Gasp: A Volcanic Origin for the Northern Smooth Plains, EPSC-DPS Joint Meeting 2025, Helsinki, Finland, 7–12 Sep 2025, EPSC-DPS2025-1090, https://doi.org/10.5194/epsc-dps2025-1090, 2025.