
 1,2,3,3
- 1The Graduate University for Advanced Studies (SOKENDAI), Kanagawa, Japan (nozawa.hitoshi@ac.jaxa.jp)
- 2Institute of Space and Astronautical Science JAXA, Kanagawa, Japan
- 3Institute for Radioastronomy INAF, Bologna, Italy
- 4Tohoku University, Miyagi, Japan
- 5The University of Tokyo, Tokyo, Japan
- 6Brown University, Providence, United States of America
Introduction: Understanding the subsurface structure is important for elucidating a planet’s geological evolution and thermal environment from its formation to the present. The Lunar Radar Sounder (LRS) onboard SELENE has detected buried regolith layers formed between subsurface lava flows [1]. While most radar surveys have focused on large-scale horizontal features (tens to hundreds of kilometers), (hundreds of meters to several kilometers) is gaining importance. Theoretically, lunar magma ascends due to buoyancy and volatile exsolution, and if it fails to erupt, gas voids can form at the magma tip [2]. Detecting such cavities would provide evidence of volatiles in lunar magma. In addition, lava tubes, which are potential habitats due to their thermal stability and radiation shielding, are key targets for future lunar exploration and base construction [3].
To detect small-scale subsurface echoes from LRS data, it is essential to accurately simulate the surface scattering from the lunar surface and to subtract this component from the LRS data. Kobayashi et al. (2020) simulated surface scattering using the Stratton–Chu integral method[4], but the resulting echo intensities were often higher than LRS observations at depths greater than 500 m, possibly due to artifacts in the SLDEM elevation model used.
In this study, we develop the detection method of small-scale subsurface echoes using LRS data and surface scattering simulation based on high-precision DEM generated by a Generative Adversarial Network (GAN). Furthermore, we analyze the spatial distribution of subsurface echoes and evaluate the subsurface structure indicated by the detected subsurface echoes.
Methods: The analysis in this study consists of three steps: (1) generation of a high-resolution DEM using a GAN, (2) surface scattering simulation, and (3) detection of subsurface echoes. In the DEM generation phase, we construct a GAN model using high-resolution images (LRONAC images), a low-resolution DEM (SLDEM), and a high-resolution DEM (NACDEM). Then this trained model is then used to generate high-resolution DEMs (hereinafter GANDEM) by inputting SLDEM2015 and LRONAC images. In the surface scattering simulation phase, we calculate the electromagnetic field scattered from the lunar surface using GANDEM. The simulation is conducted based on the method proposed by Kobayashi et al. (2020) [4]. Finally, by comparing the simulated B-scans with LRS observations, we identify small-scale subsurface echoes. Figure 1 shows the overall process of the proposed approach.

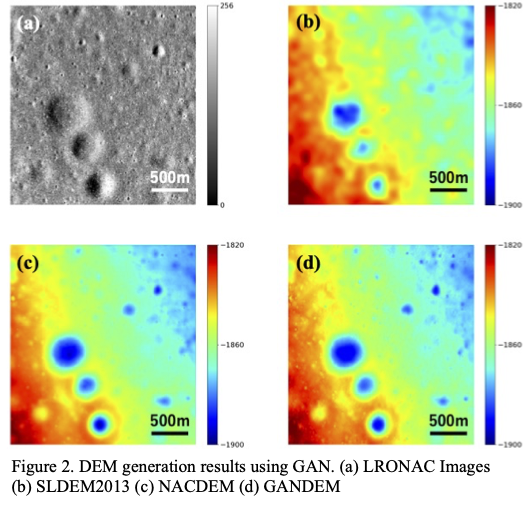
Results: We generated GANDEM for the region of the Mare Tranquillitatis (latitude: 7°N-11°N , longitude: 31°E-34°E). Figure 2 shows the GAN-generated DEM (GANDEM) (Fig. 2(d)) for a portion of that region, as well as the corresponding LRONAC image (Fig. 2(a)) and SLDEM2013 (Fig. 2(b)) NACDEM (Fig. 2(c)). SLDEM2013 cannot reproduce crater shapes with diameters of less than approximately 100 m, compared to NACDEM (Figs 2(b) and 2(c)). On the other hand, GANDEM succeeds in expressing small craters at the same level as NACDEM (Figs 2(c) and 2(d)).
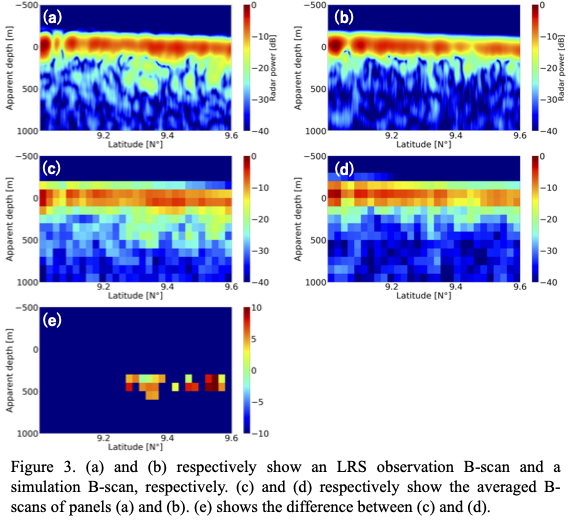
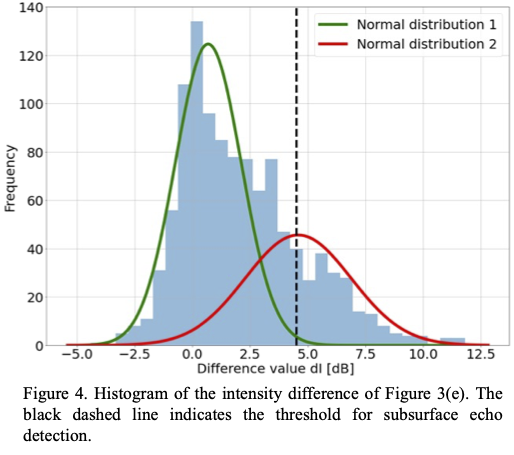
Using the GANDEM, we performed surface scattering simulations for LRS observation lines in the Mare Tranquillitatis. Figure 3 shows results from one representative track: (a) LRS observation radargram, (b) simulation result, (c) and (d) are their respective track-averaged radargrams, and (e) shows the pixel-wise intensity difference between (c) and (d). Figure 4 presents the histogram of intensity differences aggregated from 15 ground tracks in the region. A Gaussian Mixture Model (GMM) was used to fit two distributions. The subsurface echo detection threshold was set at 3σ of the distribution centered near 0, corresponding to 4.50.
Figure 5 shows the distribution map of the extracted SECs. The color represents the apparent depth. The three dotted lines represent grabens, which are linear depression structures on the surface. SECs exist continuously on the northwest extension of graben A, shown by the white solid ellipse. In areas that were not extensional regions of the graben, some SECs were detected continually along multiple LRS ground tracks shown as white dotted ellipses.
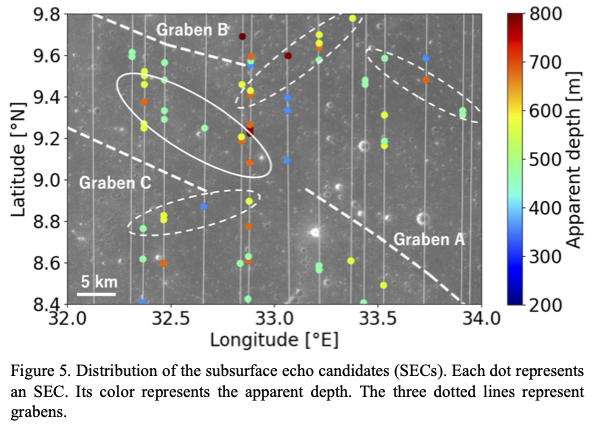
Discussion: SECs have been observed along the northwestward extension of Graben A, which is likely formed by subsurface magma intrusion. These SECs may represent subsurface structures associated with the same intrusion. Additionally, SECs have been continuously detected along multiple LRS ground tracks in areas unrelated to grabens. This suggests the presence of other horizontally continuous subsurface features, such as lava tubes or magma-related voids.
We next consider alternative explanations for the observed SEC intensities and distributions. While echoes from regolith layers between lava flows have been reported in previous LRS studies [1], such layers would extend horizontally for hundreds of kilometers. This wide distribution cannot explain the continuous and linear distribution of SECs detected on the multiple LRS ground tracks in this study. Subsurface faults may return echoes stronger than –25 dB if their planes are oriented nearly perpendicular to the radar beam. However, with average lunar fault angles of ~60° [5], such reflections would occur in radargrams at depths of ~200 km—far deeper than the 350–800 m apparent depths observed for the SECs. Consequently, no fault could be the reflection source for the SECs. Layers of ice and liquid water returning strong radar echoes have been discovered under the surface of Mars [6], but those would not exist in the lunar equatorial region.
Therefore, more plausible subsurface structures indicating SEC detected along multiple LRS ground tracks are considered to be the exsistence of lava tubes or gas voids at magma tips.
References: [1] Ono et al. (2009) Science, 323.5916, 909-912. [2] Head and Wilson, (2017) Icarus, 283, 176–223. [3] Kaku et al., (2017) GRL, 44.20, 10-155. [4] Kobayashi et al., (2020) IEEE Transactions on Geoscience and Remote Sensing, 59.9, 7395-7418. [5] Golombek et al., (1979) Journal of Geophysical Research: Solid Earth, 84.B9, 4657-4666 [6] Orosei et al., (2018) Science, 361, 490–493.
How to cite: Nozawa, H., Haruyama, J., Kumamoto, A., Toyokawa, K., Iwata, T., Head, J., and Orosei, R.: Small-Scale Subsurface Structure Detection using Lunar Radar Sounder and Surface Scattering Simulations Based on GAN-Generated DEM, EPSC-DPS Joint Meeting 2025, Helsinki, Finland, 7–12 Sep 2025, EPSC-DPS2025-1128, https://doi.org/10.5194/epsc-dps2025-1128, 2025.